$BNB: Binance Coin – Crypto Rocket or Volatile Firecracker?(1/9)
Good Morning, TradingView! ☀️ CRYPTOCAP:BNB : Binance Coin – Crypto Rocket or Volatile Firecracker?
CRYPTOCAP:BNB ’s at $566—rocketing off recent highs or just fizzing out? With wild swings and big dreams, is it time to strap in or bail out? Let’s decode it! 🔍
(2/9) – PRICE PERFORMANCE 📊
• Current Price: $ 566 as of Mar 11, 2025 💰
• Recent Moves: Down 13.5% in an hour last night, per posts 📏
• Sector Vibe: Crypto volatility spiking, per market buzz 🌟
It’s a rollercoaster—hold tight! ⚡
(3/9) – MARKET POSITION 📈
• Market Cap: Around $82.5B (149.54M shares) 🏆
• Operations: Powers Binance ecosystem, top exchange ⏰
• Trend: Sentiment mixed, posts flag adoption 🎯
A heavyweight in crypto chaos! 🌍
(4/9) – KEY DEVELOPMENTS 🔑
• Earnings Echo: Q1 2025 beat estimates, per Mar 6 buzz 🔄
• Network Buzz: Record activity fuels optimism 🌐
• Market Reaction: Price yo-yoing, posts note caution 📋
Riding high, but bumpy! 💡
(5/9) – RISKS IN FOCUS ⚠️
• Volatility: 13.5% hourly drop spooks traders 🔍
• Competition: Rivals like Ethereum nip at heels 📉
• Macro Risks: Regulatory shadows loom ❄️
Tricky terrain ahead! 🕵️
(6/9) – SWOT: STRENGTHS 💪
• Ecosystem Might: Fuels Binance, top-tier exchange 🥇
• Adoption: Network humming, per chatter 📊
• Burns: Token scarcity drives value 🔧
A crypto beast with muscle! 🔒
(7/9) – SWOT: WEAKNESSES & OPPORTUNITIES ⚖️
• Weaknesses: Wild swings, regulatory heat 📉
• Opportunities: DeFi, GameFi growth beckon 📈
Can it blast off or stall out? 🤔
(8/9) –📢BNB at $566, wild ride—what’s your vibe? 🗳️
• Bullish: $650+ soon, adoption rules 🐂
• Neutral: Choppy but stable ⚖️
• Bearish: $500 crash, volatility bites 🐻
Holler below! 👇
(9/9) – FINAL TAKEAWAY 🎯
BNB’s $566 dance shows grit 📈, but volatility’s a wild card 🌫️. Dips? That’s our DCA sweet spot 💰. Snag low, aim high! Goldmine or gamble?
BNB
Binance coin seeks to the $900 ┆ HolderStatBINANCE:BNBUSDT on the 6h chart is forming sideways ranges after its rally. Key support sits at 820–830, while resistance lies at 940. Defending support could trigger another bullish breakout toward new ATH levels.

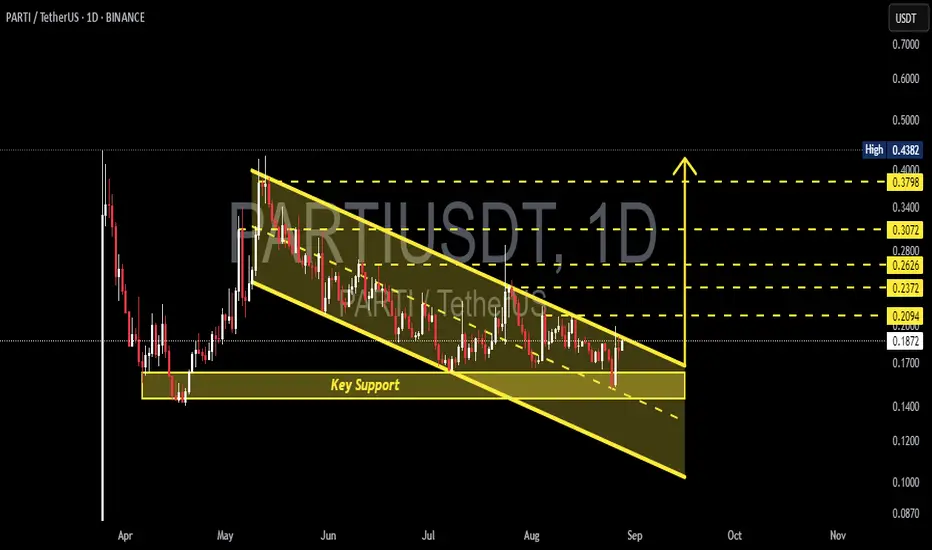
PARTI/USDT — Descending Channel & Key Support Zone!🔎 Market Structure & Pattern
Since May 2025, PARTI has been trading within a clear descending channel, forming consistent lower highs and lower lows.
Current price is around 0.187 USDT, sitting near the channel mid-line and close to the upper trendline resistance.
A key support zone lies between 0.14–0.16 USDT, which has historically acted as a strong demand area.
This setup often suggests a continuation of the bearish trend, but it can also turn into an accumulation pattern if a breakout occurs.
---
🟢 Bullish Scenario
Bullish potential will be unlocked if the price breaks out of the descending channel.
Breakout confirmation: Daily close above the upper trendline and above 0.2094 USDT.
Upside targets:
🎯 0.2094 → breakout trigger
🎯 0.2372 → intermediate resistance
🎯 0.2626 → short-term swing target
🎯 0.3072 → main breakout target
🎯 0.3798 – 0.4382 → major resistance zone (over 100% upside from current levels if confirmed)
Key factor: Breakout must be supported by increasing volume, otherwise it risks being a fake breakout.
---
🔴 Bearish Scenario
If the price fails to break out and gets rejected at the channel resistance:
Bearish confirmation: Rejection at the upper trendline or failure to hold above 0.187 / 0.16.
Downside targets:
🕳️ 0.16 → first support
🕳️ 0.14 → lower edge of key support zone
🕳️ A breakdown below 0.14 could lead to 0.10 – 0.12 USDT, the next potential demand zone.
A strong breakdown with volume would confirm continuation of the bearish trend.
---
📌 Key Technical Levels
Main Support: 0.14 – 0.16 (critical demand zone)
Key Resistance: 0.2094 (bullish trigger)
Upside Targets: 0.2372 | 0.2626 | 0.3072 | 0.3798
Bullish Invalidation: Daily close below 0.14
---
🧠 Conclusion & Bias
Currently, PARTI remains in a downtrend within the descending channel. However, price is approaching a decision zone at the key support (0.14–0.16).
If support holds + breakout occurs: A bullish reversal toward 0.237 / 0.262 / 0.307 is possible.
If support fails: Expect continuation of the bearish trend, targeting 0.12 or even lower.
👉 This is a critical decision point for PARTI — the next move will confirm whether we see a bullish reversal or a bearish continuation.
#PARTI #Crypto #TechnicalAnalysis #DescendingChannel #Breakout #BearishTrend #BullishReversal #PriceAction #SupportResistance #Altcoins #CryptoAnalysis
BNB go to ATHBNB is in good shape and if the next candle closes on the 4-hour timeframe, the probability of a ATH is very high.
Be profitable

SHELLUSDT —Accumulation Phase or Breakdown?📌 Overall Chart Overview
Currently, SHELLUSDT is trading within a Descending Triangle pattern on the daily timeframe. This structure is characterized by lower highs pressing down through a descending trendline, while the bottom side is being defended by a strong demand zone at 0.13 – 0.15 (yellow box).
This setup signals that the market is in a tug-of-war phase: sellers are consistently applying pressure, yet buyers are still holding the line at support. The outcome of this compression will likely lead to a major move in the coming weeks.
---
🔼 Bullish Scenario (Breakout)
If the price manages to close above 0.15 and break through the descending trendline:
It would confirm a bullish breakout, signaling the potential start of a short-term trend reversal.
Upside targets to watch:
T1: 0.2047 (minor resistance)
T2: 0.2275 – 0.2400 (supply zone)
T3: 0.2600 (psychological resistance)
Extension: 0.3301 (major level, opening the path toward 0.5941 in the mid-term).
A valid breakout usually comes with a surge in volume, so volume confirmation will be key.
---
🔽 Bearish Scenario (Breakdown)
On the other hand, if price fails to hold the 0.13 – 0.15 zone and we see a daily close below 0.13:
The Descending Triangle would be confirmed as a bearish continuation pattern.
Downside targets:
T1: 0.1200
T2: 0.1077 (previous major low)
Extension zone: 0.1000 – 0.0960 (psychological levels).
This would highlight seller dominance and potentially extend the downtrend further.
---
📊 Additional Insights
Volume & Momentum: Volume is currently flat, reflecting indecision. A spike in volume will likely be the early signal of a major move.
Sentiment: A breakout would turn this demand zone into a golden accumulation area for buyers. A breakdown, however, would act as a trap for weak longs.
Risk Management: Waiting for a daily candle close beyond 0.13–0.15 is the safest approach to avoid fakeouts.
---
✨ Conclusion
SHELLUSDT is at the apex of its Descending Triangle, and the 0.13 – 0.15 range is the critical battle zone. A breakout above 0.15 opens the door for a trend reversal toward 0.20 – 0.26, while a breakdown below 0.13 could drag price down to 0.1077 or even lower.
Traders should remain patient and wait for clear confirmation before committing to an aggressive position. The current market is in a “wait and see” phase, and a powerful move is likely coming soon. 🚀📉
#SHELLUSDT #CryptoAnalysis #Altcoin #PriceAction #TechnicalAnalysis #DescendingTriangle #SupportResistance #BullishBreakout #BearishBreakdown #CryptoTrading #RiskManagement

Binance coin broke through the previous resistance ┆ HolderStatBYBIT:BNBUSDT has broken through previous resistance after months of consolidation and wedge formations. Momentum remains bullish, and with price holding above $800, the next key target sits at $950. The chart structure favors continued gains if buyers maintain control.

BNC - The Trio Intersection Ahead!The chart is lining up something interesting: a trio intersection of cycle timing, trendline support, and horizontal demand. This is often where momentum shifts from hesitation to acceleration.
📊 Technical Analysis
- NASDAQ:BNC is consolidating above the $20 zone , with $15 still the key line in the sand for bulls.
- Cycles are showing another low forming right into support — a repeating pattern we’ve been tracking closely.
- The trio intersection (cycle + support + trendline) suggests a potential inflection point. If buyers step in here, the projected cycle points to a move toward $50 first , then possibly triple digits in the next leg.
💡 Bigger Picture
What makes this setup powerful isn’t just the chart — it’s the backdrop.
- CEA Industries has already deployed over $240M into BNB, with an ambitious target to own 1% of BNB’s total supply by end of 2025.
- Backed by 10X Capital, YZi Labs, and even CZ’s family office, the company is accumulating BNB ahead of expected ETF and institutional demand.
- Think of it as MicroStrategy 2.0 — but with a coin that’s outpaced Bitcoin over the last five years, and underpins one of the busiest ecosystems in crypto.
📊In brief:
Technicals and fundamentals are aligning at a key junction. If this trio intersection holds, BNC could be gearing up for its next major bullish cycle.
📌 Previous BNC analysis is attached for context.
➡️ Talk to your financial advisor and start your due diligence on CEA Industries (NASDAQ: BNC) before the institutions move in.
📚 Always follow your trading plan => including entry, risk management, and trade execution.
Good luck!
All Strategies Are Good, If Managed Properly.
~ Richard Nasr

BRETT/USDT — End of Consolidation, Beginning of a Big Move?BRETT/USDT is currently forming a symmetrical triangle pattern on the Daily timeframe (1D). This structure is shaped by lower highs (selling pressure) and higher lows (buying pressure), which are now converging near the apex zone (0.049–0.064). As price approaches the tip of the triangle, volatility often expands sharply, leading to a major directional breakout.
---
🔹 Pattern & Key Levels
Pattern: Symmetrical Triangle (neutral — can break either way).
Strong Support: 0.045 – 0.049
Key Resistance: 0.064
Major Horizontal Levels:
0.091 → mid resistance
0.115 → strong resistance
0.152 → psychological zone
0.211 – 0.236 → previous highs
Lower Supports: 0.037 / 0.031 / 0.026 / 0.023
---
🚀 Bullish Scenario
1. Breakout confirmation if daily close happens above 0.064 with strong volume.
2. A successful retest of 0.064 as support will further strengthen the bullish setup.
3. Upside targets:
TP1 = 0.091
TP2 = 0.115
TP3 = 0.152
Measured move projection (long-term potential) = ~0.277
4. Stop-loss idea: below 0.049 or under the lower trendline.
---
🔻 Bearish Scenario
1. Breakdown confirmation if daily close happens below 0.045.
2. Failed retest of 0.045–0.049 as resistance would confirm further downside.
3. Downside targets:
TP1 = 0.037
TP2 = 0.031
TP3 = 0.026
Final strong support = 0.0234
4. Stop-loss idea: above 0.058–0.064 (upper trendline zone).
---
⚖️ Conclusion
BRETT/USDT is approaching a critical decision zone. The symmetrical triangle shows market compression — pressure is building up for a powerful breakout.
A bullish breakout above 0.064 could fuel a rally toward 0.091 – 0.152 and potentially higher.
A bearish breakdown below 0.045 may trigger a correction toward 0.026 – 0.023.
Best strategy: Wait for breakout confirmation with daily close + volume, apply strict stop-losses, and take profits step by step at key levels.
#BRETTUSDT #BRETT #AltcoinAnalysis #CryptoBreakout #TechnicalAnalysis #SymmetricalTriangle #ChartPattern #CryptoTA #SupportResistance

BNB tuched its TPThe first position reached its target with reward 2
Please go and see the previous analysis.
I am waiting for a new high to be recorded

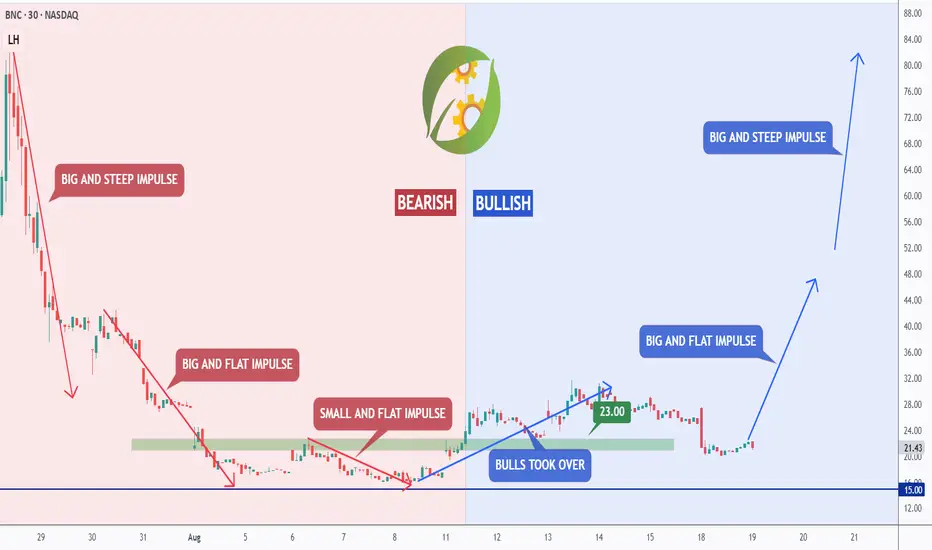
BNC - Shift in Momentum in Action!In our last update, we pointed out how BNC was holding its ground at the $12–$15 support zone. Now, we’re seeing that shift in momentum play out in real time; with the bears losing steam and the bulls taking over.
📊 Technical Update
The chart shows it clearly:
- In the bearish phase, every downward impulse got weaker — from big and steep to small and flat. Selling pressure was fading.
- Bulls stepped in at the $15 demand zone, flipping the structure bullish.
- Since then, we’ve seen a big and flat bullish impulse , hinting at healthy accumulation before the next leg.
🔎If momentum holds:
- First target: $50 => a structural resistance and psychological barrier.
- Second target: $82 => the top of the projected markup, filling a major price gap.
As long as $23 holds, and especially $15, the bullish case remains strong.
💡 Bigger Picture
This isn’t just a chart story — it’s backed by fundamentals. BNC is the first U.S.-listed company making BNB its core treasury asset , giving investors rare one-click exposure to a coin most can’t buy directly.
With over $500M already in BNB and a clear first-mover advantage, the mix of a strong macro narrative and a clear bullish shift makes this a setup worth watching closely.
📌 Previous BNC analysis is attached for context.
➡️ As always, speak with your financial advisor and do your own research before making any investment decisions.
📚 Always follow your trading plan => including entry, risk management, and trade execution.
Good luck!
All Strategies Are Good, If Managed Properly.
~ Richard Nasr
BNBUSDT long position Long position on BNB currency
in the specified range for scalping and even spot in the larger range
BNC - Where Cycles Meet Opportunity!In our last updates, we tracked how BNC NASDAQ:BNC shifted momentum and entered a bullish structure. Now, price is consolidating at a key support zone, a normal phase in bigger cycles, while the fundamentals continue to strengthen behind the scenes.
📊 Technical Analysis
- Cyclic rhythm: Price continues to respect cyclical lows (highlighted in green), suggesting we’re in a repeating accumulation/rebound structure.
- Support in play: The $20 - $21 level is being tested again, with the stronger $15 support zone still intact as a line in the sand for bulls.
- RSI confluence: Momentum indicators (RSI) are once again dipping into oversold territory, just as they did at the last local low, hinting at potential buyer re-entry.
- 200 MA: Price is sitting near the 200-period MA, adding another layer of dynamic support to watch.
If bulls hold the $20 area, we could see another cyclical rebound play out, targeting higher highs in the weeks ahead.
💡 Bigger Picture
What makes BNC stand out isn’t just its bold BNB strategy — it’s the timing . The crypto market is maturing, yet most U.S. investors are still locked out of direct BNB exposure. ETFs and sovereign funds are circling, but haven’t moved yet.
That means BNC is positioning itself ahead of the institutions - offering retail investors the rare chance to front-run Wall Street. It’s the kind of countercultural setup that often leads to the biggest asymmetrical gains: buy before the herd, hold before the headlines.
📌 Previous BNC analysis is attached for context.
➡ ️ Talk to your financial advisor and start your due diligence on CEA Industries (NASDAQ: BNC) before the institutions move in.
📚 Always follow your trading plan => including entry, risk management, and trade execution.
Good luck!
All Strategies Are Good, If Managed Properly.
~ Richard Nasr

BNB/USDT 12h chart🔎 Current situation
• Price: 898.50 USDT (+7.03%) - outstanding candle.
• Trend: We see a strong growth impulse, confirmed by the reflection from the trend line (yellow).
• Support:
• 869.75 USDT (next short -term support).
• 838.37 USDT.
• 818.56 USDT (SMA #2).
• resistance:
• 921.99 USDT.
• 952.26 USDT (key level - potential target, can be tested).
⸻
📊 Indicators
• SMA (movable average):
• The price struck over SMA and lasts above-a pro-rectification signal.
• MacD:
• The MacD line pierces the signal line from the bottom → fresh buy signal.
• The histogram begins to grow green.
• RSI (Relative Strength Index):
• Currently ~ 60 → a lot of space for the purchase zone (70+).
• RSI directed up, confirms the momentum of bulls.
⸻
📈 Scenarios
1. Bycza (more likely short -term)
• If the price lasts above 869–870 USDT → attack on 922 USDT.
• Breaking 922 with a strong volume → Another target 950–960 USDT.
2. Bear (less likely now but possible)
• Rejection from 922 and descent below 870 USDT → withdrawal to 838 or even 818 USDT.
• Only the loss of 818 will negate the current upward trend.
⸻
📝 Summary
BNB currently looks very strong - a fresh growth impulse, breaking over medium, MacD gives a buy signal, RSI is not yet in the purchase zone.
➡️ If something negative on BTC or the wide market does not happen, then the 922 and 952 test is real in the short term.

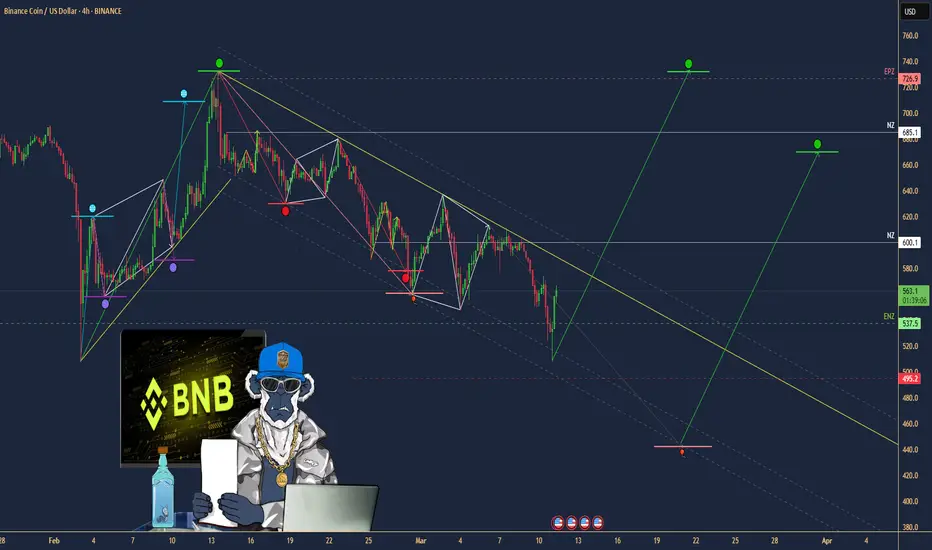
Binance Coin (BNBBTC) Reveals Altcoins Market True Bullish BiasA bullish wave is nullified by a correction. If a strong correction develops after a strong bullish wave, you can chart as if there was no bullish wave to start. That is, once support is found the chart (trading pair) in question is back to baseline and everything becomes possible such as a new bullish wave and cycle.
For example: Binance Coin vs Bitcoin (BNBBTC) produced a very strong bullish cycle ending November 2022. The ensuing correction, from November 2022 until December 2023 fully nullifies the previous bullish wave.
Here we can see BNBBTC established support 2023 December and in February 2025 produced a long-term higher low. That's it.
The bearish cycle ended. A bullish cycle is followed by a bearish cycle. A bearish cycle is followed by a bullish cycle.
Back in February 2021 BNBBTC moved weekly above EMA55. This move was followed by a more than 1,800% bullish wave. Just last week BNBBTC moved above EMA55, activating a new market run.
Summary
» We have the long-term higher low. December 2023 (higher) vs January 2021 (lower).
» We have local higher lows. July & February 2025 (higher) vs December 2023 (lower).
» We have the 672 days long accumulation (sideways) period. This is bullish. Between October 2023 and present day.
» We have a break and close above EMA55. This week starts green above EMA55 as confirmation of this resistance being conquered.
Conclusion · Altcoins Market True Bullish Bias
The altcoins market is bullish.
Will Bitcoin and the altcoins decouple? I don't know, but I can tell you the altcoins market is bullish and ready to grow...
Higher targets are possible than what is shown on the chart.
Namaste.

RAREUSDT — at Critical Accumulation Zone: Breakout or Breakdown?📊 Market Analysis
On the 4D timeframe, RARE/USDT is trading at a crucial pivot zone. The chart structure highlights:
1. Descending Triangle
Clear formation with lower highs pressing price down.
Strong horizontal support between $0.0415 – $0.065 (yellow box).
This pattern often signals bearish continuation, but if accumulation dominates, a bullish reversal can emerge.
2. Major Support Zone
Price has rejected breakdown multiple times in the $0.0415 – $0.050 region, showing active buyers.
This zone acts as the final defense before deeper downside risk.
3. Layered Resistances to the Upside
Key resistance levels if breakout occurs:
$0.0747 → $0.0949 → $0.1349 → $0.1715 → $0.2018 → $0.2208 → $0.2609 → $0.3476 (local high).
---
🚀 Bullish Scenario
For a bullish case, we need:
A confirmed breakout above the descending trendline (yellow).
Strong 4D candle close with volume.
Upside Targets if breakout holds:
🎯 TP1: $0.0747
🎯 TP2: $0.0949
🎯 TP3: $0.1349
🎯 Extended targets: $0.1715 – $0.20
📌 Note: Breakouts from descending triangles often trigger short squeezes → sharp upside moves possible.
---
🐻 Bearish Scenario
If sellers take control and support breaks:
A confirmed breakdown occurs if price closes 4D below $0.0415 with volume.
Downside targets:
🎯 Initial: $0.029 (psychological & historical support).
Lower levels possible if broader crypto sentiment turns bearish.
📌 Note: Descending triangle breakdowns tend to accelerate selling momentum.
---
📌 Pattern & Sentiment
The descending triangle shows sustained selling pressure, but repeated support tests suggest accumulation.
Overall crypto market sentiment (BTC & ETH) will heavily influence the outcome.
In short: RARE is waiting for a major trigger — either breakout or breakdown.
---
🧭 Trading Plan Recap
Bullish if breakout above trendline + close above $0.065–$0.0747 → targets $0.09 / $0.13.
Bearish if close below $0.0415 → target $0.029.
4D timeframe = stronger signals & less noise → better for swing setups.
---
> RARE/USDT 4D — Descending Triangle at Critical Support
RARE is consolidating inside a descending triangle, holding a key support zone at $0.0415 – $0.065.
• Bullish Case → breakout above trendline + volume → targets $0.0747 / $0.0949 / $0.1349 / $0.1715.
• Bearish Case → breakdown below $0.0415 → main target $0.029.
Market structure suggests both accumulation potential and breakdown risk. Wait for confirmation before entering a position.
#RARE #RAREUSDT #Crypto #TechnicalAnalysis #Altcoins #Breakout #SupportResistance #DescendingTriangle

Binance coin has dropped from $860 ┆ HolderStatOKX:BNBUSDT on the 6h chart shows a double top near 880, a sign of temporary weakness. However, the market is holding above the $800 critical level. Past triangle and sideways patterns hint at continued accumulation, with upside potential once 860 is cleared.

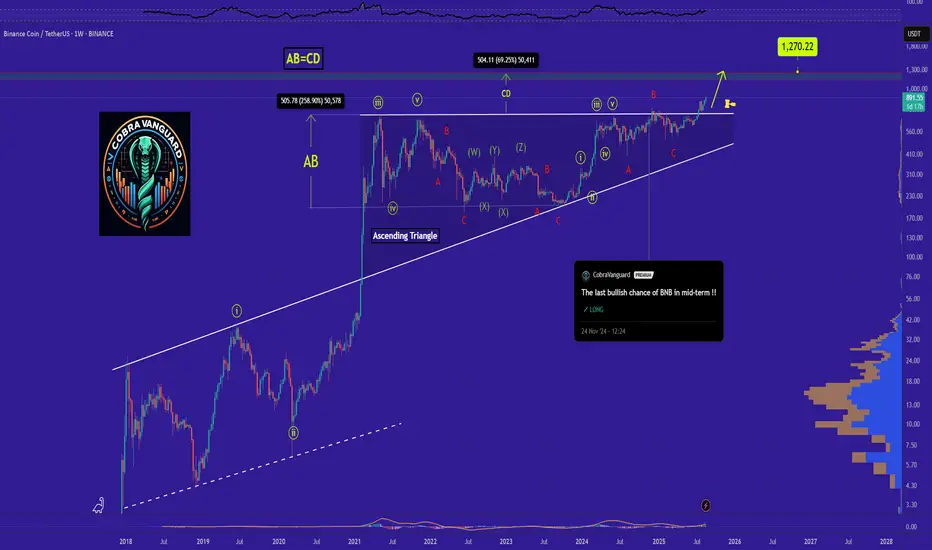
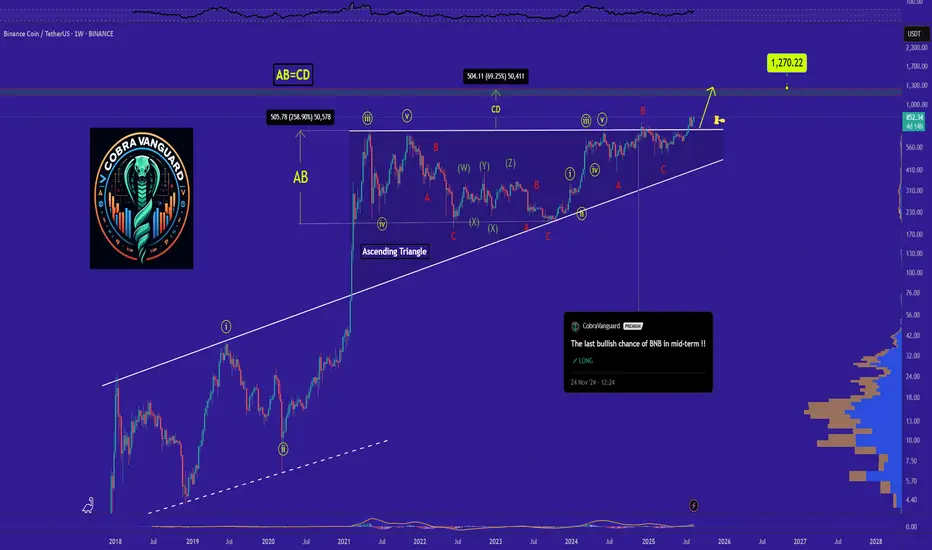
Do you think I'm joking ???As I said, BNB broke the triangle, it could surge to $1000 , and you still think I'm joking!!
The price is currently supported well, which can increase the price.
Stay Awesome , CobraVanguard
Previous analysis
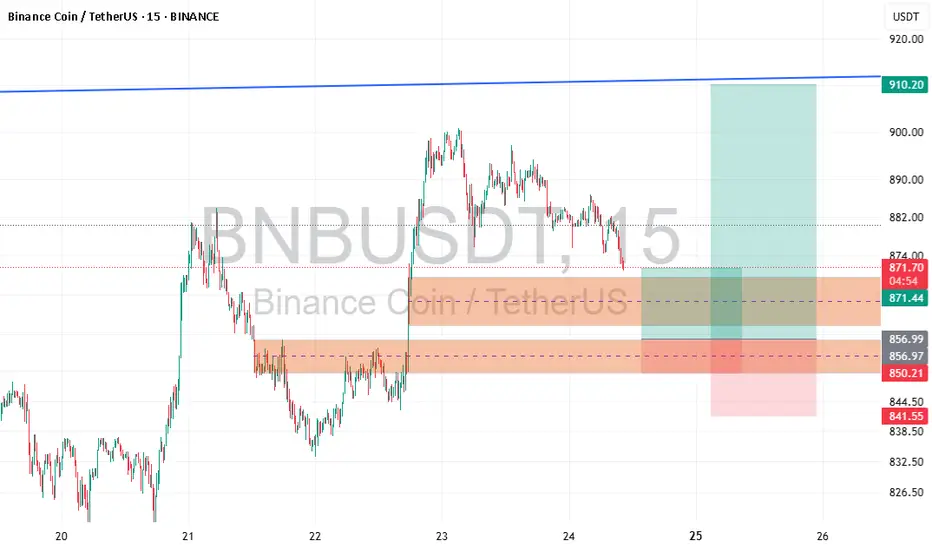
BNBUSD H4 | Potential bearish dropBNB/USD has rejected off the sell entry, which acts as a swing high resistance and could drop from this level to the downside.
Sell entry is at 856.99, which is a swing high resistance.
Stop loss is at 894.52, which aligns with the 127.2% Fibonacci extension.
Take profit is at 779.39, which is a pullback support that is slightly above the 78.6% Fibonacci retracement.
High Risk Investment Warning
Trading Forex/CFDs on margin carries a high level of risk and may not be suitable for all investors. Leverage can work against you.
Stratos Markets Limited (tradu.com ):
CFDs are complex instruments and come with a high risk of losing money rapidly due to leverage. 65% of retail investor accounts lose money when trading CFDs with this provider. You should consider whether you understand how CFDs work and whether you can afford to take the high risk of losing your money.
Stratos Europe Ltd (tradu.com ):
CFDs are complex instruments and come with a high risk of losing money rapidly due to leverage. 66% of retail investor accounts lose money when trading CFDs with this provider. You should consider whether you understand how CFDs work and whether you can afford to take the high risk of losing your money.
Stratos Global LLC (tradu.com ):
Losses can exceed deposits.
Please be advised that the information presented on TradingView is provided to Tradu (‘Company’, ‘we’) by a third-party provider (‘TFA Global Pte Ltd’). Please be reminded that you are solely responsible for the trading decisions on your account. There is a very high degree of risk involved in trading. Any information and/or content is intended entirely for research, educational and informational purposes only and does not constitute investment or consultation advice or investment strategy. The information is not tailored to the investment needs of any specific person and therefore does not involve a consideration of any of the investment objectives, financial situation or needs of any viewer that may receive it. Kindly also note that past performance is not a reliable indicator of future results. Actual results may differ materially from those anticipated in forward-looking or past performance statements. We assume no liability as to the accuracy or completeness of any of the information and/or content provided herein and the Company cannot be held responsible for any omission, mistake nor for any loss or damage including without limitation to any loss of profit which may arise from reliance on any information supplied by TFA Global Pte Ltd.
The speaker(s) is neither an employee, agent nor representative of Tradu and is therefore acting independently. The opinions given are their own, constitute general market commentary, and do not constitute the opinion or advice of Tradu or any form of personal or investment advice. Tradu neither endorses nor guarantees offerings of third-party speakers, nor is Tradu responsible for the content, veracity or opinions of third-party speakers, presenters or participants.

BNB/USDT 4H chart reviewKey levels:
• Resistance: 845.64 → 867.39 → 898.75
• Support: 819.84 → 788.98 → 765.21
• Current price: ~ 835 USDT
Structure:
• The upward trend is still in force (black rising trend line).
• After the summit around 867, the market made a correction to 819 and bounced.
• Now the price consolidates between 819 and 845, just above the trend line.
Scenarios:
1. Bullish (advantage of buyers)
• If the price stays over Trendline and 845, a possible attack on 867, and then to 898.
• Confirmation of increases will be closed with a 4h candle above 845.
2. Bearish (sellers' advantage)
• Support loss 819 = weakness signal.
• Further goals: 789 and 765 (key support).
• Trendline fracture will further strengthen the pressure of supply.
📊 Summary:
• As long as 819 and the trend line hold the advantage on the bull side.
• 845–867 is a strong resistance zone - here you have to be careful about the implementation of profits.
• Breaking below 819 will open the way to a deeper correction.

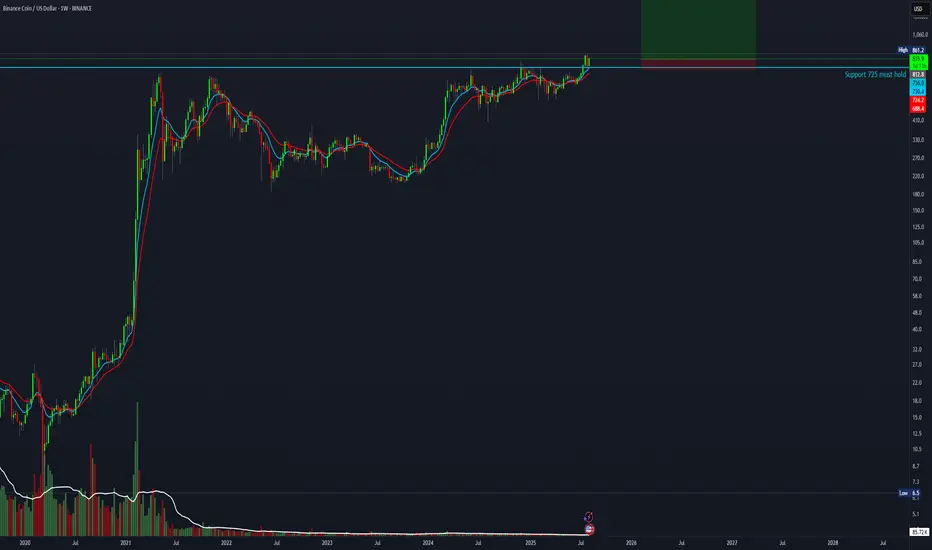
25R setup for BNBEveryone is talking about ETH right now, but don’t forget about this monster — BNB. BNB is about to break out after a successful retest of macro support. Where’s the end after the $850 breakout? Do you really want to bet against CZ? Stop-loss below support at $725.
Good luck — not financial advice.
LONG BNBMulti-Timeframe Bullish Confirmation: Weekly, daily, and 4h charts all show sustained uptrend, with price above key EMAs and strong momentum across time horizons.
Strong Institutional and Ecosystem Support: Recent news highlights large institutional acquisitions and expanding Binance ecosystem utility, affirming BNB’s foundational role in crypto infrastructure.
Clear Technical Targets: Fibonacci extensions and previous highs give a well-defined price objective, with $1,250 as the thesis target and technical resistance only modestly overhead.
Robust Risk Management: Stop loss placed at $626—safely below major technical supports and past swing lows—protects capital while allowing room for volatility.
Healthy Market Structure: No signs of euphoria or volume blow-off, just steady liquidity and rising relative volume, consistent with sustainable growth phases.
Positive Macro and Altcoin Context: Alts have very healthy momentum and inflation as well as risk assets are grinding higher.
Compelling Risk-Reward Profile: Thesis offers an asymmetric opportunity (~1.86 R/R), fitting for a patient multi-week/month position with clear upside and measured downside.

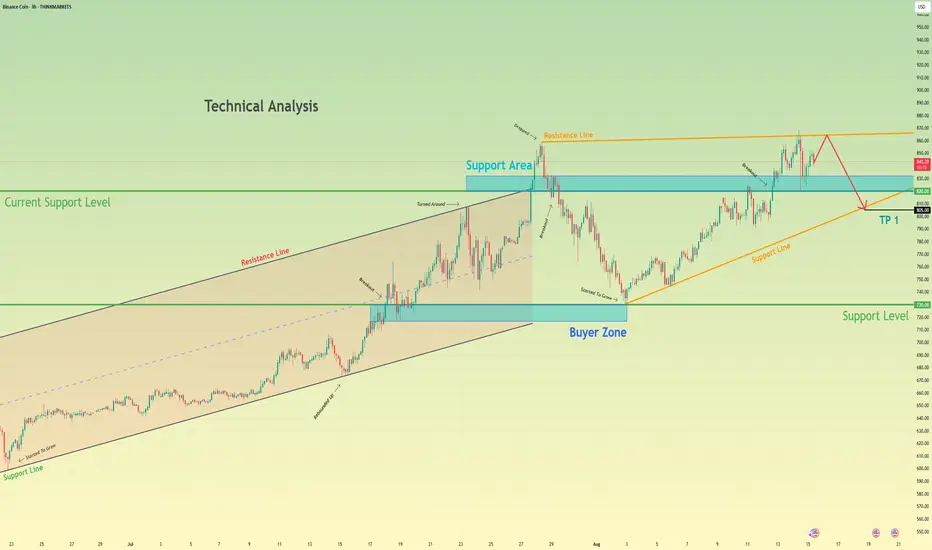
Binance Coin may drop to 805 points and break support levelHello traders, I want share with you my opinion about Binance Coin. The bullish momentum for BNB has been visibly accelerating, with the price transitioning from a steady upward channel into a steeper and more aggressive rising wedge formation. This change in character often suggests a late-stage trend that may be approaching exhaustion. The price action has been oscillating within this wedge, using the 820 level as a key support area for its most recent rebound. Currently, the asset is making another push towards the apex of the formation, approaching the final resistance line that has capped the highs. The primary working hypothesis is a short scenario, which is based on the typically bearish resolution of a rising wedge pattern. It is anticipated that the price will be rejected from the upper resistance line of the wedge, signaling the exhaustion of buying pressure. A confirmed rejection from this peak would likely trigger a sharp reversal, with enough momentum to cause a breakdown below the wedge's ascending support line and the critical horizontal support area around 820. This structural failure would validate the bearish thesis. Therefore, the tp for this anticipated reversal is logically placed at the 805 level, representing a prudent first target for the price to reach following a breakdown of the multi-week wedge structure. Please share this idea with your friends and click Boost 🚀
Disclaimer: As part of ThinkMarkets’ Influencer Program, I am sponsored to share and publish their charts in my analysis.