BNBUSDT – 4H Chart Update.BNBUSDT – 4H Chart Update.
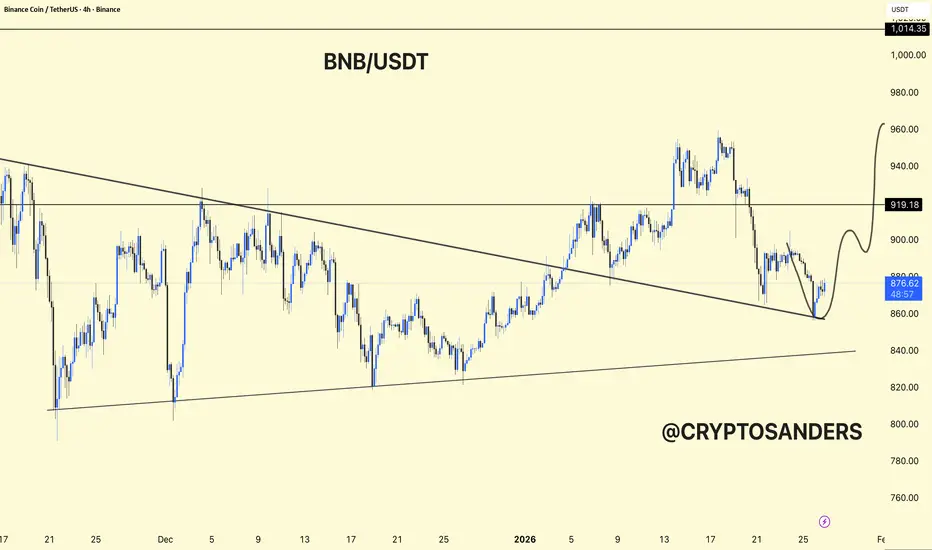
BNB is moving inside a descending channel.
Price is reacting from the lower trendline support around 860–870.
A short-term relief bounce is possible from this zone.
If momentum builds, upside targets are 900 → 920 → 960.
Failure to hold 860 may push the price toward 840–820 support.
Support-based bounce setup, trend still corrective.
⚠️ Trade with confirmation and strict risk management.
BNBBTC
BNB/USDT – 4H Chart UpdateBNB/USDT – 4H Chart Update
BNB is trading near the descending trendline resistance while maintaining higher lows from the demand zone.
🔹 Structure: Gradual recovery within a descending channel
🔹 Support Zone: 820 – 840 (strong demand holding well)
🔹 Immediate Resistance: 890 – 900
🔹 Major Resistance: 920 – 1,000
A strong 4H close above 900–920 can trigger a breakout and accelerate price toward 1,000+.
If the price gets rejected from the trendline, a pullback toward 860–840 is possible before the next move.
Market Bias: Neutral to bullish
Wait for confirmation at resistance for the next trade setup.

BNB Analysis: Bullish Wedge BreakoutHi
BNB has formed a classic wedge pattern following a strong impulsive move to the upside. After consolidating within this structure, price has now broken out above the upper trendline, signaling a continuation of bullish momentum.
Based on the measured move of the pattern, the first upside target is around $968, followed by a secondary target near $988.
The $940–$945 zone (highlighted in gray) appears to be a solid support and potential long entry area, especially if price pulls back and shows bullish confirmation from this region.
Overall, the structure favors the bulls as long as price holds above the breakout level and respects the gray support zone.

BNB - The Shackles Are Off?Binance Coin (BNB) has successfully breached a significant multi-month descending triangle structure on the Daily timeframe. After a period of compression and lower highs, the price has broken the diagonal resistance and is currently stabilizing above the breakout zone. This structural shift signals a potential end to the corrective phase and a resumption of the broader bullish trend.
Why this setup is on our radar:
Structure Invalidation: Descending triangles are typically bearish continuation patterns. However, BNB has defied this by breaking to the upside. When a "bearish" pattern fails and breaks upward, the resulting move is often fueled by trapped shorts covering their positions.
Support Defense: The market established a robust demand zone (yellow box) which refused to break. The breakout confirms that buyers have absorbed the selling pressure and are now pushing for higher valuation.
Trend Continuation: As long as the price maintains stability above the breakout level (the former diagonal resistance), the path of least resistance has flipped to the upside.
Technical Levels & Plan:
Buy Zone: The current stabilization region (890 - 908) offers a logical entry for trend continuation, provided the breakout line holds.
Invalidation Level: The bullish thesis relies on the breakout holding. A Daily close back inside the triangle structure (below ~865) would signal a "Fakeout" and invalidate the current momentum.
Structural Resistance (Targets): Short Term: 980 - 1,050 (Psychological & Local Supply) Mid Term: 1,180 - 1,250 (Previous Major Structure)
Macro / Moonbag: If momentum sustains above $1,000, we look toward a retest of the 52-week highs (1,375+) and price discovery beyond.
Risological Note: We are watching for a "Change of Polarity" where the old resistance diagonal acts as new dynamic support. Strength here confirms the bulls are in control.
Disclaimer: This analysis is for educational purposes only. Crypto assets are highly volatile. This is not financial advice.

BNBUSDT – 4H Chart Update. BNBUSDT – 4H Chart Update.
Price is moving inside a descending channel, but holding the rising demand zone.
Short-term MA curling up; price trying to reclaim the 100 MA.
Support: 820 – 800 (major demand)
Immediate Support: 840 – 830
Resistance: 880 – 900 (trendline zone)
Breakout Zone: 920 – 1,000+
Higher low formed from demand + compression = potential base building.
A clean 4H close above 880–900 can open room for upside expansion.
⚠️ Wait for confirmation, avoid chasing.
DYOR | NFA

BNB Looks Bullish (4H)BNB has been making higher lows and continuously forming bullish CHs.
Based on the latest bullish CH, buy/long positions can be considered on pullbacks within the support zones.
We have two entry points where DCA can be applied.
Also, if the lows hold, it is possible that the liquidity pool above the chart could be swept soon.
A daily candle close below the invalidation level will invalidate this analysis.
For risk management, please don't forget stop loss and capital management
When we reach the first target, save some profit and then change the stop to entry
Comment if you have any questions
Thank You

FireHoseReel | BNB Daily Analysis #29🔥 Welcome To FireHoseReel !
Let’s dive into Binance Coin (BNB) analysis.
👀 BNB 4H Overview
BNB is currently trading inside a 4H range box and is consolidating near the lower part of the range. A newly formed resistance at $870 has been tested three times, but price has failed to break above it so far.
📊 Volume Analysis
BNB volume has been declining within the range. However, each time price approaches the key resistance, volume increases slightly before getting rejected, confirming the strength of this level.
✍️ BNB Trading Scenarios
🟢 Long Scenario:
A confirmed breakout above $870.39, accompanied by rising buy volume, could provide a solid long trading opportunity.
🔴 Short Scenario:
A breakdown below the range low will not be easy. It would require a strong and clear 4H or daily whale candle. After a new structure forms, short triggers may appear.
🧠 Protect your capital first. No setup is worth blowing your account. If risk isn’t controlled, profit means nothing. Trade with rules, not emotions.

FireHoseReel | BNB Daily Analysis #28🔥 Welcome To FireHoseReel !
Let’s dive into Binance Coin (BNB) analysis.
👀 BNB 1H Overview
BNB bounced strongly from the vicinity of its maker-buyer zone with a very long upper wick, which clearly highlights a key demand/support area. Price is currently trading below the multi-timeframe resistance at $843.11, which also acts as a pre-breakout zone.
📊 Volume Analysis
Honestly, there’s not much meaningful insight to extract from BNB volume right now. The volume structure is extremely messy and unreliable, making proper analysis difficult. For that reason, I’m choosing not to rely on volume until it normalizes or the underlying cause becomes clear.
✍️ BNB Trading Scenarios
🟢 Long Scenario:
A confirmed breakout above $843.11, accompanied by increasing buy volume, could trigger a high-risk long setup.
🔴 Short Scenario:
If the maker zone breaks with a strong whale candle and heavy selling pressure, followed by continuation and a pullback, we can look for entry opportunities using proper setup candles. If price starts moving in that direction, I’ll update the analysis accordingly.
🧠 Protect your capital first. No setup is worth blowing your account. If risk isn’t controlled, profit means nothing. Trade with rules, not emotions.

FireHoseReel | BNB Daily Analysis #27🔥 Welcome To FireHoseReel !
Let’s dive into Binance Coin (BNB) analysis.
👀 BNB 1H Overview
After its recent declines, BNB is currently ranging on the 1-hour timeframe between the $850 resistance and the $835 support. A breakout from either side could lead to a move toward the next key resistance or support level.
📊 Volume Analysis
On the 1-hour timeframe, BNB volume looks unclear to me. Volume has dropped significantly and doesn’t provide a strong or reliable signal at the moment, making it difficult to interpret what is happening from a volume perspective.
✍️ BNB Trading Scenarios
🟢 Long Scenario:
A breakout above $850 accompanied by increasing buying volume could trigger a move toward $870, making it a valid long setup.
🔴 Short Scenario:
A breakdown below the $835 support with visible selling volume could push price toward its next maker buyer zone, where we can then reassess market behavior.
🧠 Protect your capital first. No setup is worth blowing your account. If risk isn’t controlled, profit means nothing. Trade with rules, not emotions.

FireHoseReel | BNB Daily Analysis #26🔥 Welcome To FireHoseReel !
Let’s dive into Binance Coin (BNB) analysis.
👀 BNB 4H Overview
BNB has reached the vicinity of its key resistance but was rejected after forming a lower high compared to the previous peak. Price is now rotating downward and moving toward the lower boundary of the range (box).
📊 Volume Analysis
As price approached the $876.76 resistance, buying volume weakened and failed to support a breakout. This lack of demand caused a rejection from the level, allowing sellers to take control of price action.
✍️ BNB Trading Scenarios
🟢 Long Scenario:
Our risky pre-breakout trigger has shifted slightly lower and is now located above the newly formed lower high at $869.32. A breakout above this level, accompanied by rising buying volume, would activate our long trigger.
🔴 Short Scenario:
A breakdown of the maker buyer zone, ranging from $819.90 to $807.46, is expected to occur with a strong impulsive (whale) candle. If this level is broken, we will wait for a pullback to enter short positions.
🧠 Protect your capital first. No setup is worth blowing your account. If risk isn’t controlled, profit means nothing. Trade with rules, not emotions.

FireHoseReel | BNB Daily Analysis #25🔥 Welcome To FireHoseReel !
Let’s dive into Binance Coin (BNB) analysis.
👀 BNB 4H Overview
BNB is currently trading near a key resistance level and is likely to show a reaction at this zone before attempting a breakout. As you can see, buying volume is gradually increasing, which supports a potential upward move.
📊 Volume Analysis
As mentioned in the previous analysis, a significant amount of capital from buy-side makers was deployed within a single 4-hour candle. With buyers’ momentum continuing, BNB still has the potential to push higher.
✍️ BNB Trading Scenarios
🟢 Long Scenario:
A confirmed breakout above the current resistance around $876.56, accompanied by strong buyer participation and increasing volume. Additionally, the RSI oscillator should break above the 60.68 level to validate the long setup.
🔴 Short Scenario:
A breakdown below the buy-side maker support zone between $819.69 – $808.06 could trigger a sharp downside move. Losing this zone may occur via a whale-driven move, so the preferred entry would be on the pullback after the breakdown.
🧠 Protect your capital first. No setup is worth blowing your account. If risk isn’t controlled, profit means nothing. Trade with rules, not emotions.

#BNBUSDT (4H) — Chart Update#BNBUSDT (4H) — Chart Update
Current Price: ~852 USDT
Major Support: 820–830 (rising trendline + demand zone)
Immediate Resistance: 860–880
Major Resistance Levels:
919 USDT
1,014 USDT
1,060 USDT
Price respected the ascending base and printed a bounce from demand.
Short-term structure is recovering, but still below key resistances.
The projected path suggests a higher-low formation if support holds.
Bullish: Hold above 820–830 → push toward 880 → 919.
Strong Breakout: Acceptance above 919 opens 1,014 → 1,060 zone.
Bearish: Lose 820 → structure weakens, deeper pullback risk.
⚠️ Note: Wait for confirmation above 880 / 919 for safer longs.
Risk management is key.

FireHoseReel | BNB Daily Analysis #24🔥 Welcome To FireHoseReel !
Let’s dive into Binance Coin (BNB) analysis.
👀 BNB 4H Overview
BNB formed a strong support around $820 and is now slowly moving upward with solid buy volume. The next key resistance lies at $876, where we need to observe price reaction closely.
📊 Volume Analysis
BNB buy volume has surged significantly. In a single small 4H candle, buyers accumulated around $771M worth of BNB, clearly defending this price zone.
✍️ BNB Trading Scenarios
🟢 Long Scenario:
A breakout above $876, supported by rising buy volume and an RSI move above 60.58, could provide a solid long setup.
🔴 Short Scenario:
A breakdown below the maker-buyer zone at $820, likely driven by whale activity, could open a short opportunity. Entries are preferred on the pullback, with stops placed above the lower high.
🧠 Protect your capital first. No setup is worth blowing your account. If risk isn’t controlled, profit means nothing. Trade with rules, not emotions.

FireHoseReel | BNB Daily Analysis #23🔥 Welcome To FireHoseReel !
Let’s dive into Binance Coin (BNB) analysis.
👀 BNB 4H Overview
BNB has broken its newly formed support, activating our pre-breakout trigger with a strong 4-hour candle. Price is now moving toward the bottom of the range.
📊 Volume Analysis
After breaking the multi-timeframe support highlighted in the previous analysis, BNB’s volume increased significantly. If selling pressure continues, price could extend its move toward the range low.
✍️ BNB Trading Scenarios
🟢 Long Scenario:
A break above $876, accompanied by rising buying volume, strong momentum, and a fakeout of the current zone, could offer a long opportunity. This setup is high risk, so if taking a long, a maximum risk of 0.25% is recommended.
🔴 Short Scenario:
Waiting for BNB to form a new structure and identify fresh trigger zones would be the more logical approach for short positions. We remain patient until clearer short setups appear.
🧠 Protect your capital first. No setup is worth blowing your account. If risk isn’t controlled, profit means nothing. Trade with rules, not emotions.

FireHoseReel | BNB Daily Analysis #22🔥 Welcome To FireHoseReel !
Let’s dive into BinanceCoin (BNB) analysis.
👀 BNB 1D Overview
On the daily timeframe, BNB is forming a trading range of roughly 10%. If this structure continues, it will likely develop into a clear daily box and consolidation zone. The upper boundary of this range is at $923, while the lower boundary is at $823.
📊 Volume Analysis
After printing an ATH at $1,376, BNB’s volume dropped sharply. With volume currently compressed, the next expansion in volume could trigger a move larger than expected.
✍️ BNB Trading Scenarios
🟢 Long Scenario 1:
A break above $923, which marks the top of the trading range, accompanied by strong buying volume confirmation, could provide a solid long setup on BNB.
🔴 Short Scenario:
A break below $823, the bottom of the trading range, confirmed by increasing selling volume, could offer a valid short opportunity on BNB.
🧠 Protect your capital first. No setup is worth blowing your account. If risk isn’t controlled, profit means nothing. Trade with rules, not emotions.

BNBUSDT – Small Chart Update
BNB is holding above the rising support zone.
As long as price stays above $850–860, upside toward $920 → $1,000+ remains possible; a break below support may lead to a deeper pullback.
DYOR | NFA.

BNBUSDT – 4H Chart Update:
BNB is pulling back into the ascending channel support around 840–850, which is a key demand zone.
If this support holds, a bounce toward 900–920 is likely. A breakdown below the channel may open downside toward 810.
DYOR | NFA.

FireHoseReel | BNB Daily Analysis #21🔥 Welcome To FireHoseReel !
Let’s dive into BinanceCoin (BNB) analysis.
👀 BNB 4H Overview
BNB was trading inside a 4H range where I had marked two trigger zones. The short trigger was activated with a strong sell-off candle, and a new trigger zone has now formed around $849.
📊 Volume Analysis
After losing the multi-timeframe support at $877, BNB’s volume shifted into strong selling pressure. This sell pressure slowed down as market makers stepped in around the $850 area.
✍️ BNB Trading Scenarios
🟢 Long Scenario:
A breakout above the multi-timeframe resistance at $899, supported by rising buy volume, could activate the long trigger. If $923 breaks, the position can be held for continuation.
🔴 Short Scenario:
If the market maker buy zone fails and support at $849 is lost with renewed selling pressure, the short trigger will be activated.
🧠 Protect your capital first. No setup is worth blowing your account. If risk isn’t controlled, profit means nothing. Trade with rules, not emotions.

FireHoseReel | BNB Daily Analysis #20🔥 Welcome To FireHoseReel !
Let’s dive into BinanceCoin (BNB) analysis.
👀 BNB 1H Overview
BNB is currently trading inside a small 1-hour range. A breakout from this box could expand the move and transition price action into a 4H structure. On the 1H timeframe, BNB is still trading below its main long trigger zone.
📊 Volume Analysis
During the holiday period, BNB volume declined. However, as we approach the end of the holidays, any increase in volume during the breakout can act as confirmation and justify entering a trade.
✍️ BNB Trading Scenarios
🟢 Long Scenario:
A breakout above $899 with volume confirmation could offer an early long opportunity. If the major resistance at $923 breaks, this position can be held for continuation.
🔴 Short Scenario:
A breakdown below the newly formed support at $861, confirmed by volume, could trigger an early short setup. If price then loses $810, the move can be extended to the downside.
🧠 Protect your capital first. No setup is worth blowing your account. If risk isn’t controlled, profit means nothing. Trade with rules, not emotions.

BNBUSDT (4H) chart update !!BNB is consolidating above a crucial demand zone (≈ 870–885) and respecting the rising trendline from recent lows. The price is currently range-bound, indicating accumulation.
As long as the 885 support holds, a bounce towards 920 → 950 is possible.
A 4-hour close below 850 would weaken the structure and could lead to a drop towards 807.
DYOR | NFA.

FireHoseReel | BNB Daily Analysis #19🔥 Welcome To FireHoseReel !
Let’s dive into BinanceCoin (BNB) analysis.
👀 BNB 4H Overview
BNB is currently moving inside a consolidation box on the 4H timeframe, with volume steadily decreasing inside this range. A breakout from either the top or bottom of the box could trigger a strong move. Price is now approaching the key resistance at $915.
📊 Volume Analysis
Price pushed into resistance with a clear volume divergence, and after sellers stepped in with increased selling volume, BNB was rejected downward. If selling volume continues to rise, the newly-formed support zone may break, allowing price to move lower.
✍️ BNB Trading Scenarios
🟢 Long Scenario 1:
A breakout above $915 with strong buying volume and a volatility-range break above 61.63 can provide a solid long setup.
🔴 Short Scenario:
A breakdown of the newly-formed multi-timeframe support at $864, confirmed by increasing selling volume, can create a valid short opportunity.
🧠 Protect your capital first. No setup is worth blowing your account. If risk isn’t controlled, profit means nothing. Trade with rules, not emotions.

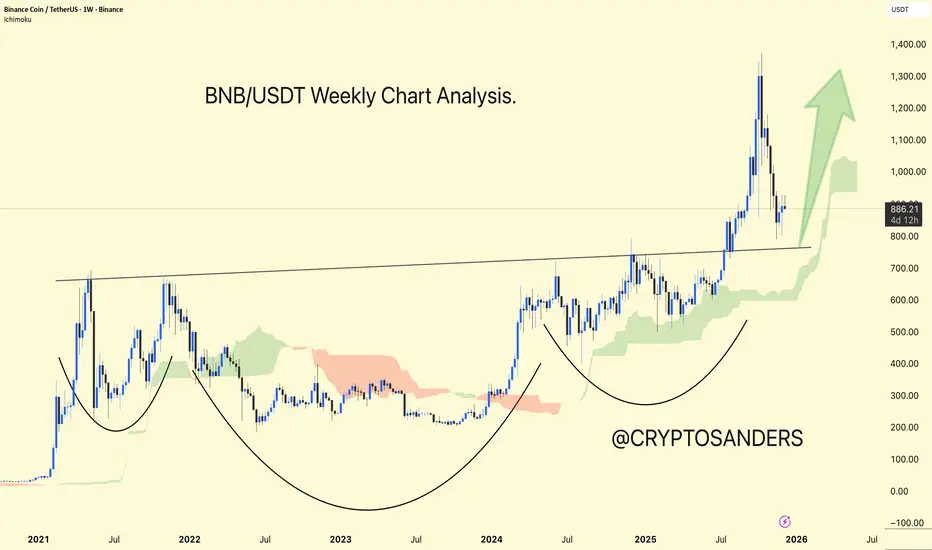
BNB/USDT Weekly Chart Analysis.BNB/USDT is trading in the range of 800 to 900 and remains within a larger bullish structure, but on higher timeframes, the price is still below a significant resistance band in the 1,160–1,180 zone.
Recent technical analysis indicates that BNB is trading above its key moving averages, with most indicators in "buy" territory, confirming the ongoing uptrend. However, some readings are approaching overbought levels.
On the chart, significant resistance is shown near 1,160–1,180 (the upper wedge boundary), while support is initially found around 1,095–1,100 and then at 1,050–1,020 if the wedge base is broken.
DYOR | NFA,
FireHoseReel | BNB Daily Analysis #19🔥 Welcome To FireHoseReel !
Let’s dive into BinanceCoin (BNB) analysis.
👀 BNB 4H Overview
BNB is currently trading inside a large 4H range box. A breakout from this box could trigger a major move.
The $922 level stands as both the top of the range and the 38% Fibonacci retracement of the previous bearish leg.
On the downside, $881 is acting as a freshly formed support zone.
📊 Volume Analysis
Volume slightly increased during the attempt to break $922, but buyers lacked enough strength and selling pressure followed.
A strong and sustained increase in volume will significantly raise the probability of a valid breakout.
✍️ BNB Trading Scenarios
🟢 Long Scenario 1:
A confirmed breakout above $922 creates a solid long opportunity.
Entry confirmation should come from a stable increase in buying volume.
🟢 Long Scenario 2:
You may enter on the 4th test using a stop-buy order with a wider stop, targeting around RR = 2.
⚠️ This type of entry should be executed with maximum 0.5% risk per trade to avoid heavy losses.
🔴 Short Scenario:
Since the broader structure behind price is strongly bearish, and the market previously experienced an aggressive drop from a distribution zone,
a break below the newly formed $881 support can activate a short position, confirmed by rising sell volume.
🧠 Protect your capital first. No setup is worth blowing your account. If risk isn’t controlled, profit means nothing. Trade with rules, not emotions.
