#BNB/USD Buy Trade Scenario.Here’s an up-to-date BNB/USD Buy trade outlook (technical + fundamental) to help you assess whether positioning for a Upside makes sense right now.
Thank You......
Bnblong

BNBUSDT – 4H Chart Update.BNBUSDT – 4H Chart Update.
BNB is moving inside a descending channel.
Price is reacting from the lower trendline support around 860–870.
A short-term relief bounce is possible from this zone.
If momentum builds, upside targets are 900 → 920 → 960.
Failure to hold 860 may push the price toward 840–820 support.
Support-based bounce setup, trend still corrective.
⚠️ Trade with confirmation and strict risk management.
BNB/USDT – 4H Chart UpdateBNB/USDT – 4H Chart Update
BNB is trading near the descending trendline resistance while maintaining higher lows from the demand zone.
🔹 Structure: Gradual recovery within a descending channel
🔹 Support Zone: 820 – 840 (strong demand holding well)
🔹 Immediate Resistance: 890 – 900
🔹 Major Resistance: 920 – 1,000
A strong 4H close above 900–920 can trigger a breakout and accelerate price toward 1,000+.
If the price gets rejected from the trendline, a pullback toward 860–840 is possible before the next move.
Market Bias: Neutral to bullish
Wait for confirmation at resistance for the next trade setup.

#BNB/USD Buy Trade Scenario.Here’s an up-to-date BNB/USD Buy trade outlook (technical + fundamental) to help you assess whether positioning for a Upside makes sense right now.
Thank You......

#BNB/USD Buy Trade Setup.Here’s an up-to-date BNB/USD Buy trade outlook (technical + fundamental) to help you assess whether positioning for a Upside makes sense right now.
Thank You......

BNB Analysis: Bullish Wedge BreakoutHi
BNB has formed a classic wedge pattern following a strong impulsive move to the upside. After consolidating within this structure, price has now broken out above the upper trendline, signaling a continuation of bullish momentum.
Based on the measured move of the pattern, the first upside target is around $968, followed by a secondary target near $988.
The $940–$945 zone (highlighted in gray) appears to be a solid support and potential long entry area, especially if price pulls back and shows bullish confirmation from this region.
Overall, the structure favors the bulls as long as price holds above the breakout level and respects the gray support zone.

BNBUSDT – 4H Chart Update. BNBUSDT – 4H Chart Update.
Price is moving inside a descending channel, but holding the rising demand zone.
Short-term MA curling up; price trying to reclaim the 100 MA.
Support: 820 – 800 (major demand)
Immediate Support: 840 – 830
Resistance: 880 – 900 (trendline zone)
Breakout Zone: 920 – 1,000+
Higher low formed from demand + compression = potential base building.
A clean 4H close above 880–900 can open room for upside expansion.
⚠️ Wait for confirmation, avoid chasing.
DYOR | NFA

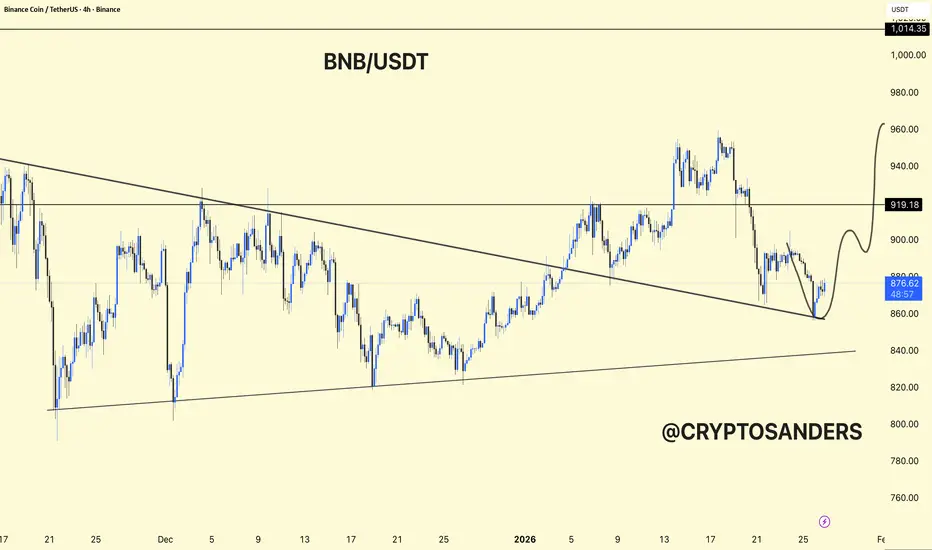
#BNBUSDT (4H) — Chart Update#BNBUSDT (4H) — Chart Update
Current Price: ~852 USDT
Major Support: 820–830 (rising trendline + demand zone)
Immediate Resistance: 860–880
Major Resistance Levels:
919 USDT
1,014 USDT
1,060 USDT
Price respected the ascending base and printed a bounce from demand.
Short-term structure is recovering, but still below key resistances.
The projected path suggests a higher-low formation if support holds.
Bullish: Hold above 820–830 → push toward 880 → 919.
Strong Breakout: Acceptance above 919 opens 1,014 → 1,060 zone.
Bearish: Lose 820 → structure weakens, deeper pullback risk.
⚠️ Note: Wait for confirmation above 880 / 919 for safer longs.
Risk management is key.

BNBUSDT – Small Chart Update
BNB is holding above the rising support zone.
As long as price stays above $850–860, upside toward $920 → $1,000+ remains possible; a break below support may lead to a deeper pullback.
DYOR | NFA.

BNBUSDT – 4H Chart Update:
BNB is pulling back into the ascending channel support around 840–850, which is a key demand zone.
If this support holds, a bounce toward 900–920 is likely. A breakdown below the channel may open downside toward 810.
DYOR | NFA.

BNBUSDT (4H) chart update !!BNB is consolidating above a crucial demand zone (≈ 870–885) and respecting the rising trendline from recent lows. The price is currently range-bound, indicating accumulation.
As long as the 885 support holds, a bounce towards 920 → 950 is possible.
A 4-hour close below 850 would weaken the structure and could lead to a drop towards 807.
DYOR | NFA.

BNB/USDT 1H AnalysisHi
After a prolonged downtrend, BNB has broken its descending trendline, signaling a shift from bearish to bullish momentum. The price formed a symmetrical triangle pattern, completing at point D, which coincides with the lower boundary of the rising channel. Since then, BNB has been trading inside a clearly defined ascending channel, respecting both support and resistance levels.
Recently, a bullish flag has formed, representing a consolidation after a strong upward impulse. A breakout from this flag suggests continuation towards the upper channel boundary near $940–950. Support lies around $880, aligning with both the flag’s lower boundary and the channel’s midline.

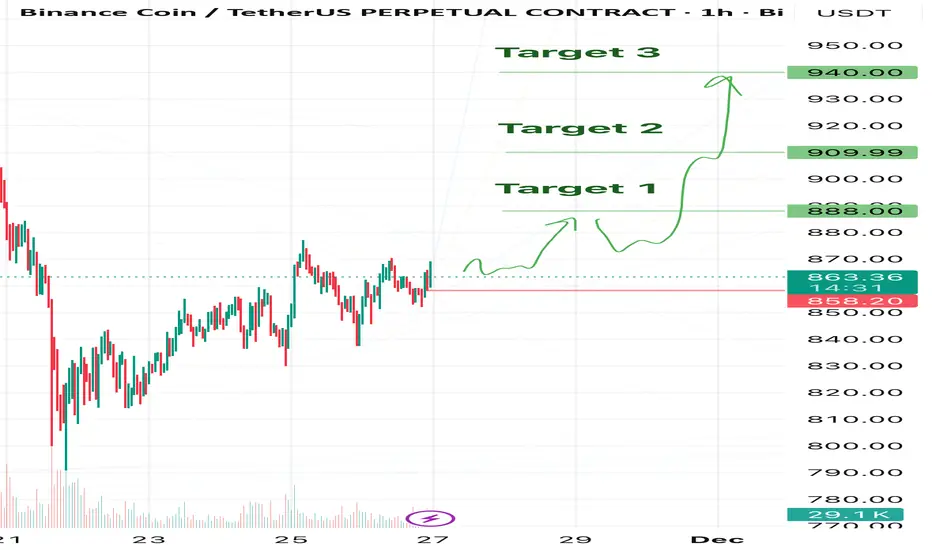
BNB - Optimistic outlookIn my view, BNB looks more than optimistic.
I believe we can see this coin at 900 and higher in the foreseeable future.
But we might currently be in a correction (possibly an ABC) after the previous drop, so we keep our hand on the pulse. As always — mandatory stops, no exceptions!
My current targets:
🎯 Target 1 — $888
🎯 Target 2 — $910
🎯 Target 3 — $940
❌Invalidation level: $858.2
A clear break and close below this zone cancels the bullish scenario for me.
Long bias remains as long as we hold above 858.2.
Trade safe and see you at the targets! 🚀
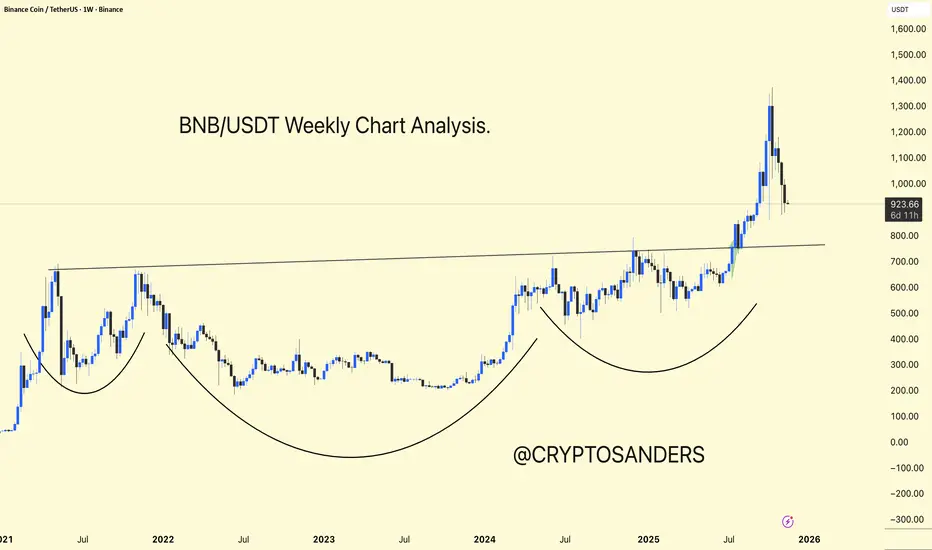
BNBUSDT Weekly Chart – Full AnalysisBNBUSDT Weekly Chart – Full Analysis
BNB is displaying a multi-year Inverse Head and Shoulders structure on the weekly chart, which is a bullish continuation pattern that indicates accumulation followed by a breakout.
Key Breakout: Horizontal resistance near $800 serves as a neckline for the pattern. BNB broke above this level with strong volume, confirming the bullish breakout and initiating a sharp uptrend.
Current Activity: After reaching above $1,300, BNB is currently retracing and testing the breakout area as support ($800–$900). This is a standard retest after a significant uptrend.
Bullish Scenario: If BNB holds $800–$900, a strong upward trend toward new all-time highs is likely, with targets potentially reaching $1,500 and above, measured using cup depth.
Bearish Risk: Losing the $800 neckline would invalidate the current breakout and could lead to a deeper retracement before another upward move.
BNB is in a strong long-term uptrend. After successfully breaking out of a massive cup-and-handle pattern, it is retesting support—a natural and healthy technical move. Holding above $800–$900 keeps BNB in a bullish setup, with further upside potential.
DYOR | NFA
$BNB Eyes Rebound on U.S. Shutdown End and Rate Cuts PotentialBNB Chain’s native token, BNB, slipped below the $1,000 mark in the past 24 hours, dropping to lows near $974 amid a surge in trading volume nearly 88% above its daily average. The move signals short-term bearish sentiment as traders react to broader crypto market weakness.
However, macro fundamentals could soon favor a rebound. With the U.S. government shutdown reportedly nearing resolution and investors widely anticipating a Federal Reserve rate cut in December, liquidity conditions are expected to improve. Lower interest rates typically reduce the cost of capital, boosting investor appetite for risk assets like cryptocurrencies. As liquidity flows back into the market, altcoins such as BNB may see renewed buying pressure.
Technically, BNB broke out of a long-term ascending channel despite the recent sell-off. The $950–$970 zone is acting as a strong support area, acting as a retest to the break-out of the ascending channel. A sustained support of this level could set the stage for a rebound toward $1,375 previous high, the next major resistance and prior high. Conversely, a breakdown and a candle close below $900 could open the door to deeper losses near $900 or lower.
Analysts remain divided. “Short-term volatility doesn’t shake BNB’s fundamentals,” said Jake A. from AIC Labs. “As long as on-chain activity and ecosystem growth continue, the long-term picture remains intact.”
In summary, while BNB faces immediate technical resistance at $1,000, easing macro pressures and a confirmed support base could ignite the next rally toward $1,375 as traders position for a more dovish Fed.

BNB: Inverse Head & Shoulders & Rising Channel StructureHi!
BNB has completed a clear inverse Head & Shoulders pattern at the bottom, with the neckline successfully reclaimed. After the breakout, the price is now moving inside a well-defined rising channel, showing steady bullish momentum.
The market has pulled back toward the midline of the channel, which lines up with previous neckline structure. If this support holds, the next leg higher remains the primary scenario.
Your projection highlights two key points:
A potential higher low forming inside the channel
Continuation toward the 1,031 resistance, with room for an extension toward the top of the channel
As long as the price respects the ascending structure and stays above the neckline/green zone, the bullish outlook remains intact.

BNBUSDTBINANCE:BNBUSDT is Bull-trend and we may buyer in any correction.
Best support: Now level - 1150 - 1075 - 975
Seve profit in levels: 1275 - 1350 - 1400
P;ease control Risk management.⚠️

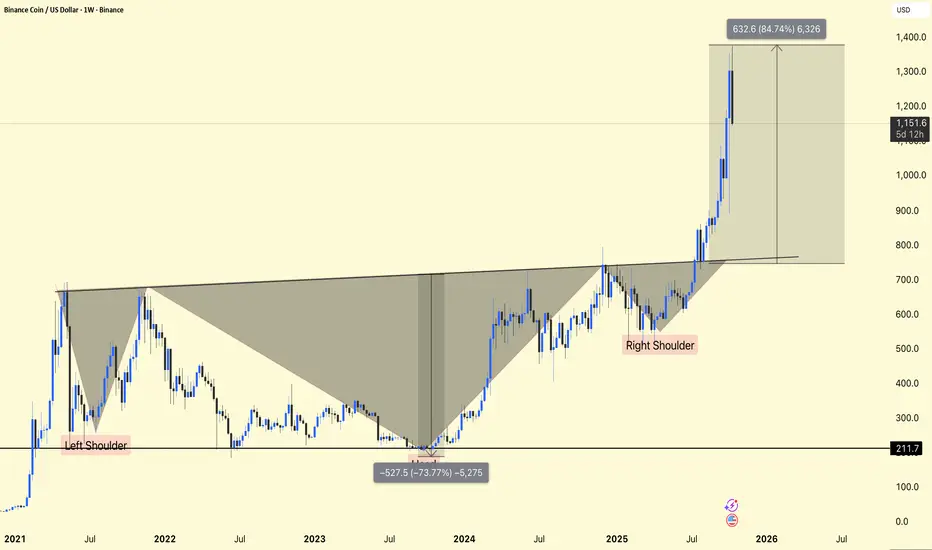
BNB/USDT Weekly Chart Update !!BNB/USDT Weekly Chart Update
BNB has completed a massive inverse head and shoulders pattern on the weekly timeframe – a strong bullish reversal structure that confirms the long-term uptrend.
After breaking the $750 neckline, the price quickly rose to $1,230+, representing a gain of approximately +85% from the breakout zone. Current price activity remains strong, but a short-term decline towards $1,000-$1,100 would be good for continued downside.
Support: $800-$850 (neckline retest zone)
Short-term support: $1,000-$1,100
Target area: $1,350-$1,400
The breakout structure is bullish and intact – declines can be viewed as accumulation opportunities for the next leg up.
DYOR | NFA
BNB; ATHHello friends
Given the recent growth we have had, the price has formed a double top pattern and is in the specified support areas, we can expect the price to be supported until the specified targets.
*Trade safely with us*

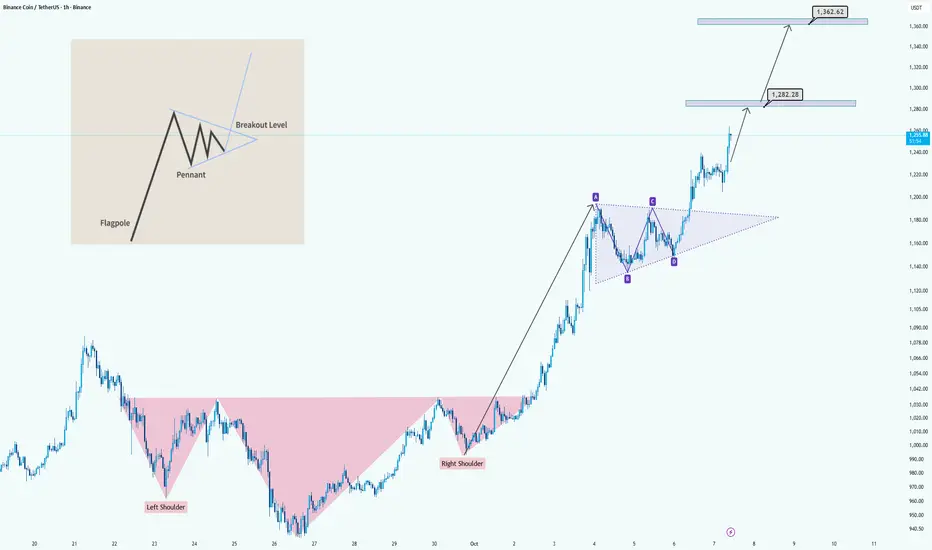
BNB/USDT: Bullish Breakout from H&S and Pennant FormationHi guys!
The chart clearly shows a bullish structure forming after a strong upward move. Initially, the price completed an Inverse Head and Shoulders pattern , signaling a potential trend reversal from bearish to bullish. After the breakout above the neckline, the market continued to climb and started consolidating into a bullish pennant pattern , a continuation setup that typically follows a sharp rally (flagpole).
The pennant breakout confirms renewed bullish momentum, suggesting the next leg higher is underway. Based on the flagpole projection, the measured targets are around $1,282 for the first resistance zone and $1,362 as the extended upside target.
In summary:
Patterns identified: Inverse Head and Shoulders + Bullish Pennant
Trend direction: Bullish continuation
Targets: $1,282 and $1,362
Outlook: Positive as long as price holds above the pennant breakout level
BINANCE HIGH PROBABILITY SETUP SOON!!!🚨 BINANCE HIGH PROBABILITY BUY SETUP 🚨
* Here We Can See Clearly The Next Potential Move For BNBUSD Coming Hours/Days.
* Keep Your Eyes Close On Your Trading Positions.
* Happy PIP Hunting Traders.
FXKILLA.

BNB HIGH PROBABILITY SETUP SOON!!!🚨 BNB HIGH PROBABILITY BUY SETUP 🚨
* Here We Can See Clearly The Next Potential Move For BNB Coming Hours/Days.
* Keep Your Eyes Close On Your Trading Positions.
* Happy PIP Hunting Traders.
FXKILLA.

BNB Fuel Bullish MomentumBNBUSD took support near 55- 4H EMA and showed a nice pullback on positive developments. It hits an intraday high of $1034.90 and is currently trading around $1034.20.
Significant expansion for BNB Chain is possible thanks to corporate treasury adoption, real-world asset (RWA) tokenization, and infrastructure improvements. Planned improvements hope to cut transaction costs in half and increase performance tenfold by 2026; recent Maxwell and Lorentz hard forks are already lowering block times to 0.75 seconds and gas fees to $0.001. Its position as a top Layer-1 with $369.2 billion in 30-day DEX trading volume and more than 5,000 is further enhanced. Corporations like Nano Labs and Windtree, along with institutional interest from groups like B Strategy, are adopting dApps that help to create a supply-demand mismatch by lowering the liquid supply on exchanges. With alliances including Securitize, VanEck, and Ondo Finance, and a $14 billion TVL top, BNB Chain's foray into RWA tokenization is also broadening use, maybe driving BNB prices toward analyst targets of $1,500–$2,000 as these triggers combine to boost institutional demand, real-world applications, and developer activity.
Short-term trend remains bullish as long as support $867 (365 4H EMA) holds. It trades above the 55,200 and 365 EMA on the 4-hour chart. Near-term support is around $989; any close below targets $960/$940/$928/$900/$865/$845/$810/$780/$755/$740. If the pair closes below $500, it potentially leads to further declines towards $400.
Immediate Resistance is at $1035.Any breakout above this resistance confirms bullish momentum and a jump towards $1050/$1100/$1150.
Indicators ( 4-Hour Chart)
Directional Movement Index: Bullish
CCI (50): Bullish
Trading Strategy
It is good to buy on dips around $1000 with a stop-loss set at $960 and a target price of $1150.
