FireHoseReel | BNB Daily Analysis #11🔥 Welcome To FireHoseReel !
Let's dive into BinanceCoin ( BNB ).
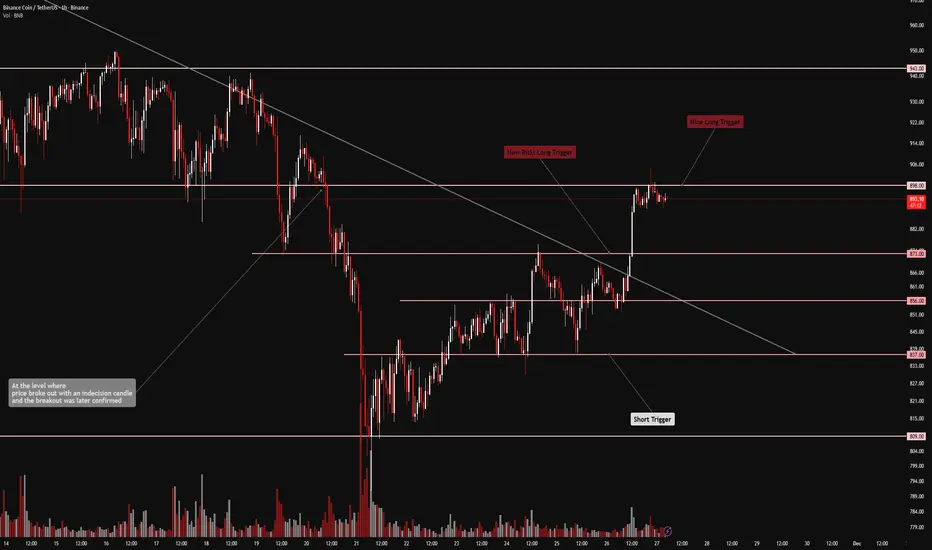
👀 BNB is currently attempting to break a strong support zone at $873. A confirmed breakdown of this level could activate our short trigger.
📊 BNB volume has dropped sharply. One key reason is a completed multi-timeframe distribution structure, along with the impact of the current holiday period. The first strong volume expansion will likely define the next price direction.
🧮 The RSI oscillator remains in the 36.5 range, similar to yesterday. A breakout from this range, aligned with volume expansion, would confirm momentum entering BNB’s next move.
✍️ I will update the scenarios for you, though they remain mostly unchanged from yesterday, with only minor shifts in support levels.
🔴 Short Scenario: A clean break below the marked support with rising sell volume can provide a valid short setup. However, without RSI confirmation, risk should be reduced due to the possibility of a fake breakdown.
🛞 Risk Management & Disclaimer
Please remember to always use proper risk management and position sizing. Nothing in this analysis is financial advice. The market can change quickly, so always trade based on your own strategy, research, and risk tolerance. You are fully responsible for your own trades.
BNBUSDT

BNB/USDT ANALYSIS - 4H interval🔶 1. Current Trend and Market Structure
The chart shows:
A clear short-term uptrend – the price is respecting the ascending yellow trend line.
An increase after a bounce from the SMA 50 (green).
However, there are still no new higher highs – the market is consolidating between 888–910.
➡️ Short-term trend: up
➡️ Medium-term trend: neutral/consolidation
🟩 2. Key Support/Resistance Levels
Resistance:
910–912 USDT – currently a key resistance, tested multiple times.
930–935 USDT – local higher resistance (green zone on your chart).
957–960 USDT – stronger resistance from D1 (blue SMA95 visible in the screenshot).
Supports:
USDT 889–893 – local support and the current battleground.
USDT 871 – SMA 50 + previous swing low.
USDT 849 – powerful support from the HTF.
USDT 837 – the final “lifeline” of the bullish structure.
📈 3. Indicators (MACD, RSI)
MACD
MACD > 0 – positive.
The MACD line is starting to point upwards → a signal of bullish momentum.
No divergence.
➡️ MACD supports the bullish scenario.
RSI
RSI ~59 – a healthy zone, far from overbought.
RSI breaks the local downtrend → increasing buyer strength.
➡️ RSI confirms the bullish trend.
🟧 4. Key Price Action Now
The price is currently approaching resistance at 910–912 USDT and simultaneously touching the local trend line.
This is the market's decision point.
A breakout → opens the way to 930–935.
A rejection → a return to 889, and below 871.

FireHoseReel | BNB Daily Analysis #10🔥 Welcome To FireHoseReel !
Let's dive into BinanceCoin Structure Analysis.
👀 On the 1H timeframe, BNB failed to activate our long trigger and has now broken its key support at $875, closing a candle below this level.
📊 BNB volume has dropped sharply, which actually helps clarify the chart. Whenever volume contracts like this, it often signals that the next major move is getting closer.
🧮 The RSI oscillator is now near its oversold zone.
If RSI breaks below and holds under the 36.5 level, it can accelerate bearish momentum and strengthen the downside move.
✍️ Below are the key scenarios for BNB, which you can use alongside your own trading setup:
🟢 Long Scenario:
A breakout above $902 with rising buy volume.
🔴 Short Scenario:
A break below $875 with increasing sell volume, combined with RSI falling below 36.5, can provide a clean short or exit setup.
🛞 Risk Management & Disclaimer
Please remember to always use proper risk management and position sizing. Nothing in this analysis is financial advice. The market can change quickly, so always trade based on your own strategy, research, and risk tolerance. You are fully responsible for your own trades.

FireHoseReel | BNB Daily Analysis #9🔥 Welcome To FireHoseReel !
Let’s dive into the current BNB market structure and key levels.
👀 BNB – Market Structure & Trade Scenarios
After activating its trigger, BNB is currently trading just below a key resistance zone.
A clean breakout above this resistance could activate our long trigger, making this area a very strong zone for potential long positions after confirmation.
📊 Volume Behavior
Pay attention to volume — over the past few days, volume dropped noticeably, but we’re now seeing early signs of rising buy volume.
While this increase may not be fully visible on the 4H timeframe, on multi-timeframe analysis, the growth in buying pressure toward this resistance is clearly forming.
✔️ BNB/BTC – Relative Strength Check Looking at the BNB/BTC pair, price is currently sitting near a strong support level.
If this support is lost, it would signal a decline in BNB’s relative strength versus Bitcoin.
However, a solid reaction and bounce from this level could help trigger the resistance breakout on the BNB/USDT pair.
On the 4H timeframe, BNB/BTC still holds a slightly bullish structure, but on higher timeframes it appears bearish, meaning we must stay cautious.
📌 Trading Scenarios for BNB
Below are the key scenarios that can be used alongside your own trading strategy:
🟢 Long Scenario
A breakout above $898, confirmed with rising buy volume, can activate our long trigger and offer a valid buy entry.
The current area is a good preparation zone for a potential long after confirmation.
🔴 Short Scenario
For shorts, it’s best to focus on naturally bearish patterns, as supported by Dow Theory, such as:
• Failure Swing
• Non-Failure Swing
• Double Top
A break of newly formed lows with increased sell volume can present strong short opportunities.
🛞 Risk Management & Disclaimer
Please remember to always use proper risk management and position sizing. Nothing in this analysis is financial advice. The market can change quickly, so always trade based on your own strategy, research, and risk tolerance. You are fully responsible for your own trades.

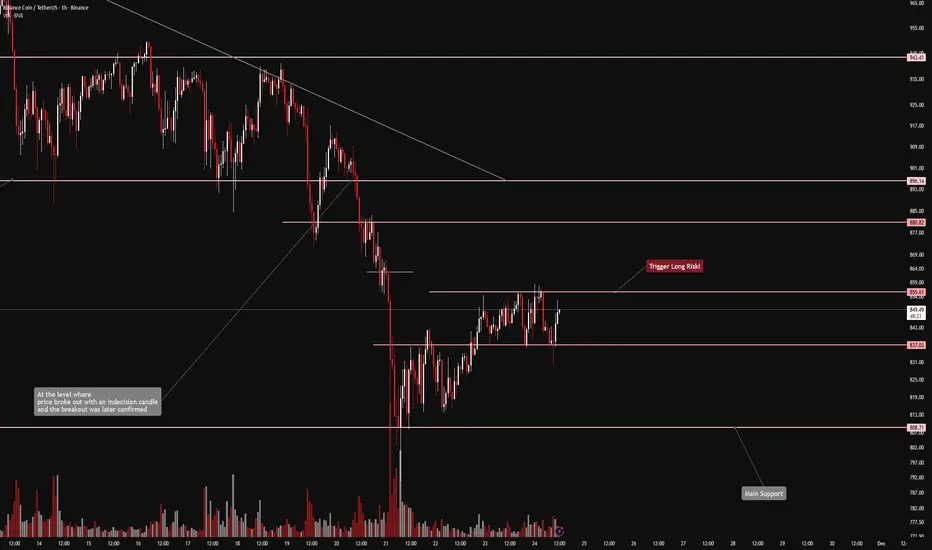
BNB/USDT 1H AnalysisHi
After a prolonged downtrend, BNB has broken its descending trendline, signaling a shift from bearish to bullish momentum. The price formed a symmetrical triangle pattern, completing at point D, which coincides with the lower boundary of the rising channel. Since then, BNB has been trading inside a clearly defined ascending channel, respecting both support and resistance levels.
Recently, a bullish flag has formed, representing a consolidation after a strong upward impulse. A breakout from this flag suggests continuation towards the upper channel boundary near $940–950. Support lies around $880, aligning with both the flag’s lower boundary and the channel’s midline.

FireHoseReel | BNB Daily Analysis #8🔥 Welcome FireHoseReel !
Let’s dive into the current BNBUSDT Structure .
🔷 BNB Market Update & Trade Scenarios
After our initial trigger was activated, BNB moved higher and the long position was successfully entered. Price is now trading at a major resistance zone, and a confirmed breakout above this area could activate the next long trigger. If the position had been opened earlier with a lower-risk entry, this secondary trigger would now provide a strong opportunity to scale into the position with confirmation.
📊 Volume Insight
From a volume perspective, the breakout and acceptance above the 873 level were supported by a clear expansion in trading volume, confirming strong buyer participation. During the pullback phase, volume noticeably declined, which signals a healthy and controlled correction, not aggressive distribution. For continuation toward the 898 resistance, we now need to see a fresh and decisive increase in buying volume to validate sustained bullish momentum.
📌 Below are the key scenarios based on the current BNB market structure, which can be used alongside your own trading strategy. 👇🏻
🟢 Long Scenario
A clean breakout above the 898 resistance, confirmed by a strong bullish candle close and rising buy volume, could offer a high-quality long setup.
The stop-loss can be safely placed below the most recent local low to maintain a favorable risk-to-reward profile.
🔴 Short Scenario
If price forms a lower high followed by a lower low, or prints a bearish structure such as a failure swing or non-failure swing, with volume confirmation, a valid short setup may emerge—especially since the higher-timeframe market cycle still carries bearish pressure.
🛞 Risk Management & Disclaimer
Please remember to always use proper risk management and position sizing. Nothing in this analysis is financial advice. The market can change quickly, so always trade based on your own strategy, research, and risk tolerance. You are fully responsible for your own trades.
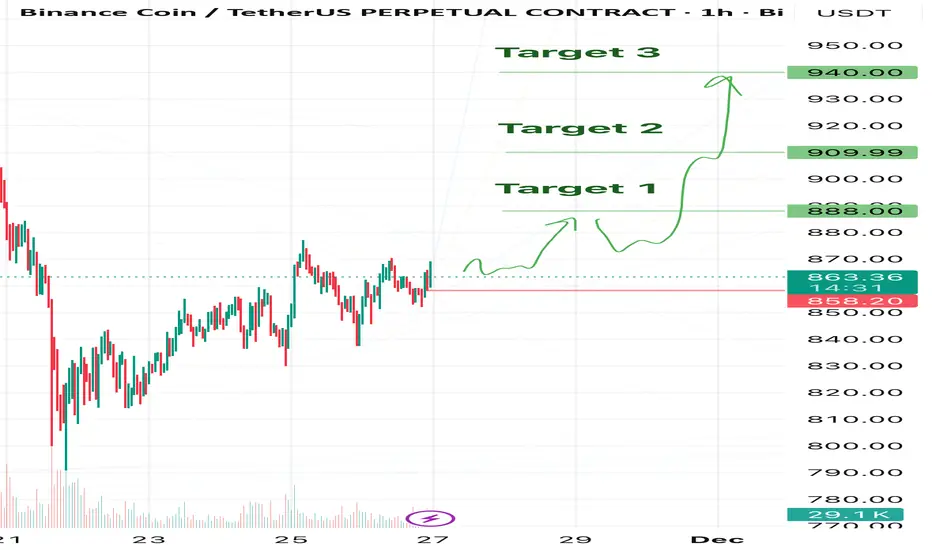
BNB - Optimistic outlookIn my view, BNB looks more than optimistic.
I believe we can see this coin at 900 and higher in the foreseeable future.
But we might currently be in a correction (possibly an ABC) after the previous drop, so we keep our hand on the pulse. As always — mandatory stops, no exceptions!
My current targets:
🎯 Target 1 — $888
🎯 Target 2 — $910
🎯 Target 3 — $940
❌Invalidation level: $858.2
A clear break and close below this zone cancels the bullish scenario for me.
Long bias remains as long as we hold above 858.2.
Trade safe and see you at the targets! 🚀
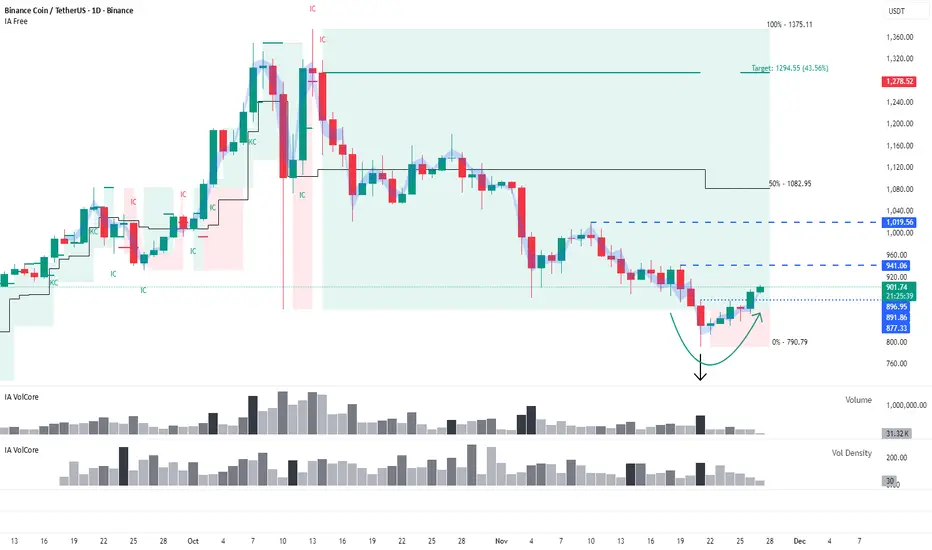
BNB: Long setups remain a priorityBuyers may still show strength despite the lack of interaction with a key level.
This analysis is based on the Initiative Analysis (IA) method.
Hello traders and investors!
On the daily timeframe, the market is in a sideways range, and a false-break pattern of the lower boundary has formed.
We see a seller’s attack on volume at the level, followed by a bullish absorption of the attack candle.
There is one detail: during the formation of this pattern, the price stopped roughly 11 dollars short of the 50% level of the monthly trading range.
Even with this nuance, the long scenario remains valid.
The first target is 941.
Wishing you profitable trades!
FireHoseReel | BNB Daily Analysis #7🔥 Welcome FireHoseReel !
Let’s break down the current BNB structure and important triggers.
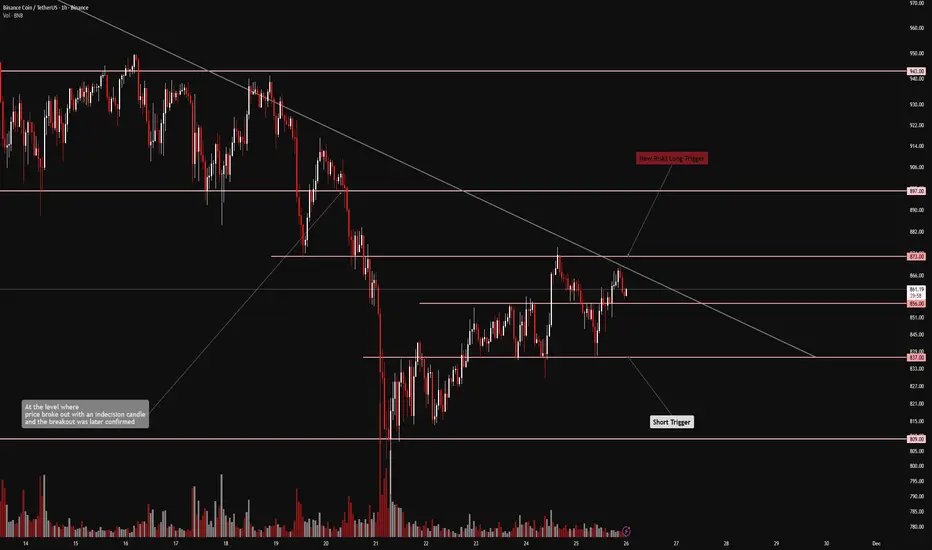
BNB – Short-Term Market Structure Update
Since yesterday, BNB formed an almost equal low around $837 and bounced upward. However, on the 1H timeframe, it printed a lower high compared to the previous peak and failed to break the $873 resistance.
A break above the high activates our long trigger, while a break below the low activates the short trigger.
📊 Volume Analysis
Pay close attention to volume to understand internal market behavior.
After the heavy market drop, BNB formed a critical higher-timeframe support near $809, followed by a sharp drop in volume.
The first strong volume expansion, combined with trigger activation, will act as confirmation either for opening new positions or for holding existing ones.
🔁 BNB/BTC Perspective From the BNB/BTC pair, it appears price is possibly forming a fake breakout at the top of its trading range.
If this fakeout plays out, BNB’s relative strength against Bitcoin may weaken, allowing:
• BTC dominance to rise
• USDT dominance to increase
• And BNB to activate its short trigger
On the flip side, if BTC dominance and USDT dominance both drop, BNB can move upward, activating the BNB/USDT long trigger.
This potential fakeout is also accompanied by a volume divergence, which increases its technical significance.
📌 Trading Scenarios
The active scenarios for BNB are outlined below and can be used depending on how price reacts.
🔼 Long Scenario
• A breakout above the multi-timeframe high at $873
• Must be accompanied by a clear increase in volume
This provides a risky long setup toward the next resistance.
If that resistance shows signs of breaking, we can add to the position, since the main long trigger sits at $897.
🔽 Short Scenario
• A breakdown below the newly formed support at $837
• Must be confirmed by a strong increase in sell volume
• Only with volume confirmation does this become a valid short trigger.
🛞 Risk Management & Disclaimer
Please remember to always use proper risk management and position sizing. Nothing in this analysis is financial advice. The market can change quickly, so always trade based on your own strategy, research, and risk tolerance. You are fully responsible for your own trades.
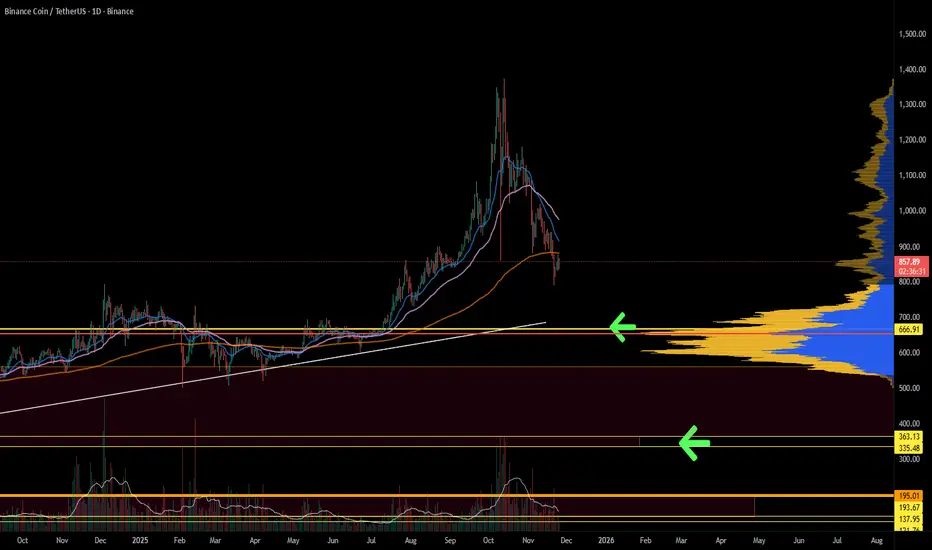
Binance Chain is falling and may find support soon. BNB just bounced off the 200D MA but momentum is still weak.
The key support is the high-volume node around 660 — lose that and price likely slides into the 360–330 demand zone.
Indicators are oversold, but no bullish confirmation yet.
MACD is still trending down + structure looks like a full reset of the prior run.
Bottom line: sitting on support, but bears still control until buyers show strength.
FireHoseReel | BNB Daily Analysis #5🔥 Welcome FireHoseReel !
Let’s dive into the analysis of BNB (Binance Coin).
👀 BNB – 1H Timeframe Analysis
On the 1-hour chart, BNB is currently moving inside a clear trading range.
If the top of the range breaks, we get a risky long trigger.
If the bottom breaks, we get a clean short trigger.
We now have to wait and see which direction the market chooses so we can position ourselves accordingly.
Since USDT.D is still high, I personally lean slightly more toward a bullish reaction from BNB.
📊 Volume Indicator Insight
Pay close attention to the volume indicator.
It clearly shows that BNB is range-bound, because volume has been declining inside this box.
A breakout from the range will represent reduced absorption + a new directional move.
So the first strong volume spike will likely give us a valid entry signal.
✔️ A Different Perspective – BNB/BTC Pair Checking the BNB/BTC pair helps a lot.
Just like before, it’s still moving inside its own box, but currently leaning slightly downward.
This means BNBUSDT is behaving similarly to BTCUSDT, and the triggers become much clearer when analyzing both pairs together.
Trading Scenarios
Related entry scenarios are written in the continuation of the analysis and can be used depending on how price reacts.
🔼 Risky Long Scenario
A long position becomes valid if:
• $855.61 resistance breaks, and
• A noticeable increase in buy volume confirms a clean breakout from the trading range.
🛞 Risk Management & Disclaimer
Please remember to always use proper risk management and position sizing. Nothing in this analysis is financial advice. The market can change quickly, so always trade based on your own strategy, research, and risk tolerance. You are fully responsible for your own trades.
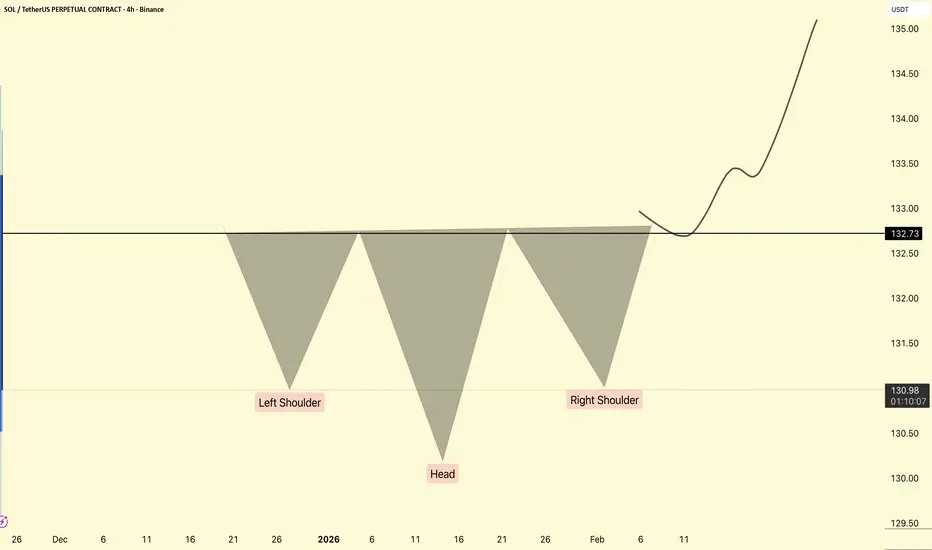
Inverse Head and Shoulders PatternThe inverse head and shoulders pattern is a technical analysis tool used to signal a potential trend reversal from a downtrend to an uptrend.
The inverse head and shoulders pattern is characterized by three consecutive troughs, with the middle trough (head) being the lowest and the two outer troughs (shoulders) being higher and nearly equal. This formation indicates that the downtrend is nearing its end, and a reversal to an uptrend may occur soon. Identifying this pattern can provide traders with a valuable signal to enter a new long position or exit a bearish trade, making it an essential part of technical analysis.
The inverse head and shoulders pattern is the opposite of the head and shoulders pattern. Technical traders widely follow both formations due to their distinct shapes and clear signals as trend reversal patterns.
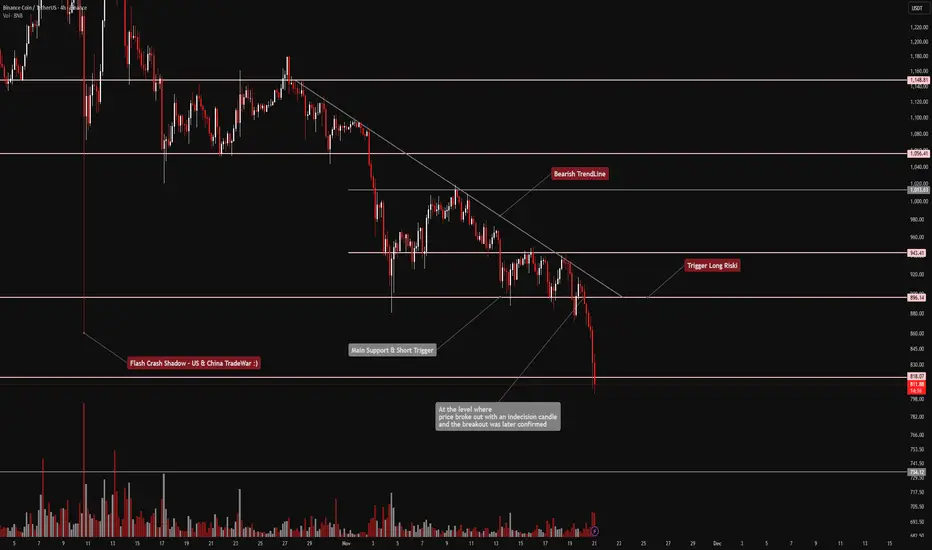
TradeCityPro | BNB Pressure Point: Trendline vs. Market Mood👋 Welcome to TradeCity Pro!
In this analysis, I want to review the BNB coin for you, one of the most popular and well-known cryptocurrency exchanges, whose native token has a $115.97 billion market cap and is currently ranked 5th on CoinMarketCap.
⏳ 4-Hour Timeframe
On the 4-hour timeframe, BNB is in a downtrend, and its latest bearish wave started after breaking below the $900 zone, continuing down to the $808 level.
✨ There is also a curved descending trendline on BNB’s chart, which has now become very steep, and the price has reached this trendline.
⭐ If this trendline breaks, the correction could deepen, allowing the price to move toward higher zones.
But if BNB gets rejected from this trendline, the downward movement will continue.
✔️ The next short trigger we have is the break of the $808 level.
This is a very important support zone, and if it breaks, the price could fall toward the $747 level.
📊 Buying volume has been very low during this corrective phase, which shows the strength of the sellers. Therefore, a rejection from the trendline or a break below $808 can confirm the start of a new bearish wave.
💥 From a momentum perspective, the RSI is also making a small upward correction similar to the price.
The 19.83 level is the key RSI support.
📝 Final Thoughts
Stay calm, trade wisely, and let's capture the market's best opportunities!
This analysis reflects our opinions and is not financial advice.
Share your thoughts in the comments, and don’t forget to share this analysis with your friends! ❤️

BNB📉 BNB/USDT Daily Analysis: Demand Zone Retest
The price of BNB/USDT is undergoing a significant correction, approaching a critical demand area after a strong rally.
🔍 Key Level: The primary support/demand zone (SMC) is identified between $730 and $790. This area is expected to hold strong and trigger a bounce.
🎯 Entry Plan: Look for long entries within the demand zone, specifically around $760 - $780.
⬆️ Take Profit (TP): The initial short-term targets are set at:
$1,039.99
$1,081.43
$1,108.52
🛑 Invalidation: The trade setup is invalidated if the price decisively breaks and closes below the $730 demand zone, signaling a deeper bearish move.
Strategy: Buy the dip in the highlighted demand zone for a potential rally back towards the $1,000+ resistance levels.

FireHoseReel | BNB Daily Analysis #4🔥 Welcome FireHoseReel !
Let’s dive into the analysis of BNB (Binance Coin).
👀 BNB – 1H Timeframe
BNB is currently breaking through its multi-timeframe resistance around $842.
If price forms a higher low above this zone, we can take it as a valid confirmation for bullish continuation.
Keep in mind: the long trigger sits at $880, which makes this setup a bit risky.
📊 Volume Analysis
The volume indicator is showing rising multi-timeframe buy volume, which is different from previous behavior on the left side of the chart.
This suggests a healthy convergence of buying pressure, showing that sellers are weakening, market fear is fading, and investors are slowly stepping back in to accumulate at these levels.
✔️ BNB/BTC Pair Perspective To look at things differently, we also check the BNB/BTC pair, which helps us understand the structure more deeply.
The pair is still in the same condition as yesterday, with one difference:
The multi-timeframe resistance at 0.0991 could become a risky long trigger.
A breakout above this zone may push momentum into the BNB/USDT pair as well.
✍️ Let’s break down the trading scenarios for BNB on the 1H timeframe.
🔼 Long Scenario:
We need:
• Strong buyer support and increased participation
• Continued multi-timeframe volume convergence
• Breakout of key resistance zones on both BNB/USDT and BNB/BTC
If these conditions align, we can take a low-risk (0.5%) long entry on the breakout.
If needed, we can also add to the position on higher resistance breakouts.
🔽 Short Scenario:
A breakdown of the key support levels on the chart + clear selling pressure can give us a valid short or exit signal.
This breakdown may also require a break of USDT dominance resistance, which would strengthen the bearish move.
🛞 Risk Management & Disclaimer
Please remember to always use proper risk management and position sizing. Nothing in this analysis is financial advice. The market can change quickly, so always trade based on your own strategy, research, and risk tolerance. You are fully responsible for your own trades.

FireHoseReel | BNB Daily Analysis #3🔥 Welcome FireHoseReel !
Let’s dive into the analysis of BNB (Binance Coin).
👀 BNB – 1H Timeframe
On the 1-hour chart, BNB has formed a solid support around $808.17, right after the drop we mentioned in previous analyses.
Price also has a local resistance at $842.26, and a breakout on either side can give us confirmation for the next move.
However, going long from this zone is not ideal. A long setup would be more reasonable at higher levels during a pullback of this bearish leg — and for that, we need USDT dominance to reject downward.
📊 Volume Analysis
Looking at volume, one key detail stands out:
The multi-timeframe correction of this bearish move has come with decreasing buy volume.
If price moves back down and breaks the support again, we can look for a fresh short position.
✔️ BNB/BTC Pair Analysis Since we analyze things differently, let’s also check the BNB/BTC pair.
This pair is currently sitting on its own support and moving slightly upward.
But what matters is this: BNB/BTC seems to be forming a potential bearish pattern on this timeframe. If the structure completes, I’ll include it in the next analysis update for you.
✍️ Now let’s check the trading scenarios for BNB on the 1H timeframe.
🔽 Short Scenario
A short setup becomes valid if:
• BNB/BTC breaks below 0.009691,
• Confluence with BNB price breaking below $808.71,
• Increased sell volume,
• A clean candle close under the defined support zones.
This combination gives us a strong short trigger.
🔼 Long Scenario
A long setup requires:
• Breakout above $896,
• A few retests (rejections) into this zone,
• Followed by a confirmed breakout with increased buy volume.
This long scenario is still far from current price, and once BNB reaches that zone, I’ll post the best updated scenario for you.
🛞 Risk Management & Disclaimer
Please remember to always use proper risk management and position sizing. Nothing in this analysis is financial advice. The market can change quickly, so always trade based on your own strategy, research, and risk tolerance. You are fully responsible for your own trades.

FireHoseReel | BNB Daily Analysis #2😄 Hey! How’s everything? Hope you’re doing great!
🍾 Welcome to FireHoseReel — make sure to follow and enjoy the analysis along the way.
If you ever want a custom chart breakdown, just leave a comment and I’ve got you.
😎 Now let’s jump into the analysis of my favorite coin: BNB .
👀 BNB – 4H Timeframe
BNB recently gave us a short trigger on the 4-hour chart after breaking its key support at $896. Price dropped right toward our first target at $818, hit it cleanly, and is now stuck in a “mid-zone” with no clear direction.
Even on a multi-timeframe view, we currently don’t have any valid entry trigger, so we need to wait for new structure formation before planning the next move.
📊 Volume Analysis
Our volume indicator played a major role here:
Once the support broke and the short trigger activated — exactly as mentioned in yesterday’s analysis — sell pressure increased sharply.
Whales also started selling their BNB as soon as the support failed, and many traders used this opportunity to enter short positions.
Volume is still showing bearish pressure, and the last two 4H candles had a strong increase in selling activity, turning into clear downward momentum.
✔️ Now let’s analyze something different — BNB/BTC pair
On the 4H timeframe, this pair is still moving inside its trading range and has managed to maintain its relative strength against BTC.
However:
• A breakout above the range high at 0.010162 could trigger a strong bullish move
• A breakdown below the range low at 0.009800 could lead to a deeper correction in the BNB/USDT pair and accelerate the bearish momentum there
For now, the pair holds a bullish bias, but we need confirmation through an actual breakout.
✍️ Current Scenarios
We don’t have a new setup today, as yesterday’s short position already played out and is still valid.
For a new entry — long or short — we need BNB to build a fresh market structure and give us a clean trigger.
Until then, patience is the best strategy.
🛞 Risk Management & Disclaimer
Please remember to always use proper risk management and position sizing. Nothing in this analysis is financial advice. The market can change quickly, so always trade based on your own strategy, research, and risk tolerance. You are fully responsible for your own trades.
BNB/USD Main Trend. 11 18 2025Logarithm. Time frame: 1 week.
🔵Main trend: lower zone of the ascending channel As previously shown on HBAR.
🟡🟣Secondary and local trends
There's a pullback to the breakout zone, that is, to the mirror level of the former resistance of the large bowl (currently strong support), meaning the price is retesting the key zone, which are the historical highs of the previous 2021 cycle. This is the same as the 72,000 zone for BTC in the past.
🟣🔄 A breakout of the local designated trend line (purple) is a local trend reversal. But, in general, it's important to understand that this is a retest of the previous breakout zone.
🟢🔄 Confirmation and holding of the price above this zone is astronomical, and any news is just fiction to justify a move into the next zone, already a distribution.
🔴🔄 Failure to hold this zone means a temporary immersion in the previous consolidation.
According to the general market trend (market phase) and the asset's liquidity (money in the project), a chart pattern is formed.
______________________________________________________________________
⚠️ Overall, I think Binance will lose "$ liquidity," that is, users, due to unfair speculative play (controlled by "Big Brother") and a prolonged lack of exchange functionality updates. Perhaps this won't happen immediately, but gradually. But I'm sure many would really prefer not to see this happen instantly. It's unlikely that the exchange itself will survive long-term competition from new exchanges with fresh functionality and "users who aren't offended."
1️⃣ It's worth remembering that the most liquid and popular exchanges in the 2017 cycle were Bittrex and Poloniex. Where are they now? Bittrex is a scam. Poloniex has completely lost liquidity.
2️⃣ In the 2021 cycle of highs, FTX and Binance. The former is a scam. The latter is still around.
0️⃣ The main villain is a scam (everyone understands what, who, and why), which always scams everything monetary for its own interests and monopolizes the "fresh mushrooms" of the market. There is one, which is equivalent to the main "market maker." The one who "created" and "destroyed" dinosaurs from the very beginning, including the MtGox exchange back in 2013, squeezing out "all the available circulating BTC" at the time. This has been his playing field since the very beginning of the crypto bubble.
You're on someone else's playing field, so remember that and accept their rules. You're playing by the rules of those who set the traps for you, bypassing them. These rules have little effect on the masters of the speculative game. Accept the game and the risks, or leave...
3️⃣👀What will happen this time? Which liquid exchange will be "killed" to destroy the dollar in a bear market and trigger a super-negative environment? One can only guess. There are several candidates (as well as highly liquid hyped cryptocurrencies) that could influence the overall trend and shape a certain, extremely pessimistic opinion among the majority. Don't guess, you might miss the mark.
🧠 Therefore, when trading and holding cryptocurrencies and USD, diversify your storage and trading locations.
1️⃣ Cold or hardware wallets (a portion of your funds, if you're a holder, is larger; if you're a trader, it's smaller).
2️⃣ + Liquid exchanges (3-4, two isn't enough, as if one goes to the "other world"), you'll lose 50% of your trading funds, and that's a lot. To recover, you need to increase your capital not by 50%, but by 100%. For hamsters, this is "simple," but for traders, it's not.
⚠️ A paragraph off-topic for trading? A reminder of the most important thing, the safety of your money, is not superfluous. What's the point of earning if you'll lose everything? This is not superfluous for smart people who work and earn, rather than paying the market for their emotions and chatting in chats about how rich and broke they are.
Risk must always be justified and controlled by you. This is the foundation of foundations. If this isn't the case, then you're building a speculative house on a clay foundation, trying only to guess the price. Sooner or later it will collapse, and the later it happens, the more painful it will be.

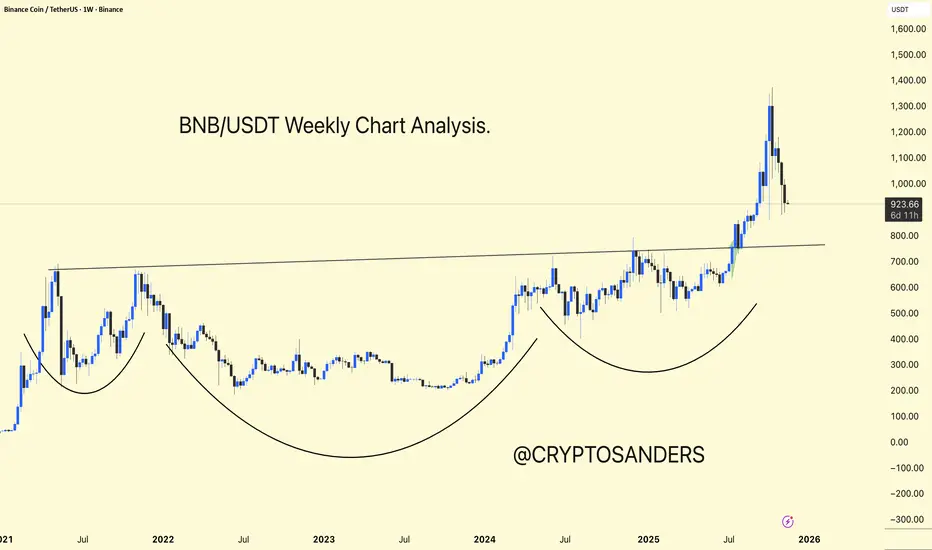
BNBUSDT Weekly Chart – Full AnalysisBNBUSDT Weekly Chart – Full Analysis
BNB is displaying a multi-year Inverse Head and Shoulders structure on the weekly chart, which is a bullish continuation pattern that indicates accumulation followed by a breakout.
Key Breakout: Horizontal resistance near $800 serves as a neckline for the pattern. BNB broke above this level with strong volume, confirming the bullish breakout and initiating a sharp uptrend.
Current Activity: After reaching above $1,300, BNB is currently retracing and testing the breakout area as support ($800–$900). This is a standard retest after a significant uptrend.
Bullish Scenario: If BNB holds $800–$900, a strong upward trend toward new all-time highs is likely, with targets potentially reaching $1,500 and above, measured using cup depth.
Bearish Risk: Losing the $800 neckline would invalidate the current breakout and could lead to a deeper retracement before another upward move.
BNB is in a strong long-term uptrend. After successfully breaking out of a massive cup-and-handle pattern, it is retesting support—a natural and healthy technical move. Holding above $800–$900 keeps BNB in a bullish setup, with further upside potential.
DYOR | NFA
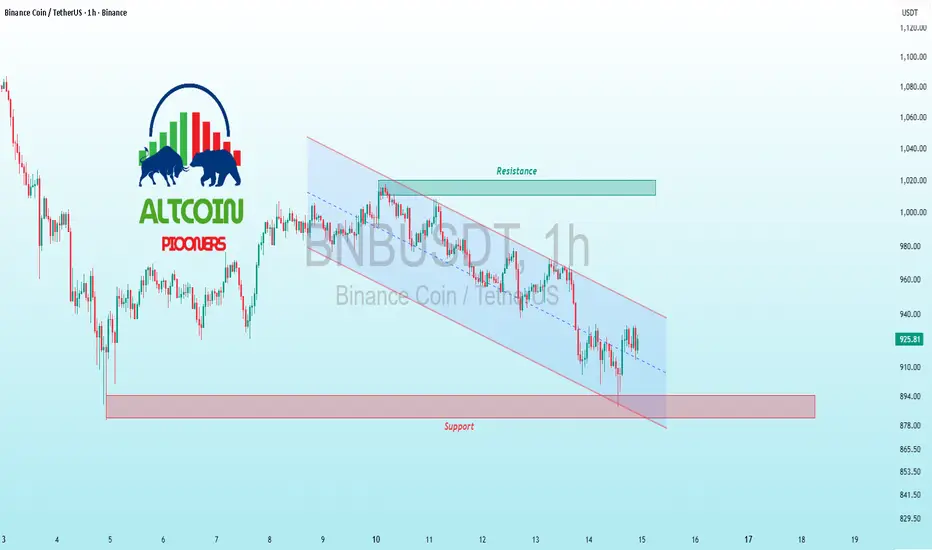
$BNB Trendline Tug-of-War – Bulls Defend or Bears Feast?BINANCE:BNBUSDT CRYPTOCAP:BNB Trendline Tug-of-War – Bulls Defend or Bears Feast?
Altcoin Pioneers! 🐂 BNB/USDT 1H is locked in a descending channel battle, price dipping to test support at ~895 after bouncing off the orange trendline resistance near 910. Binance ecosystem strength holding the line, but that red candle close warns of fading momentum amid broader crypto caution.
Hold support? Decent shot – volume drying up on downside, RSI at 42 eyeing bullish divergence for a snapback. Breakout above resistance? Bullish if >905 clears on BNB Chain news, targeting 920. Deeper dip risk? Real threat – snap below eyes 880 (50 EMA), chain reaction selloff.
Target: Reclaim 905 on hold, drop to 885 on breach. Monitoring: EMA ribbon compression, CCI for overextension, and BNB/BTC ratio for decoupling. Chain up! 🔗📉
#BNB #AltcoinAnalysis #TradingView

$BNB Testing Key Support Amid Bearish PressureBINANCE:BNBUSDT CRYPTOCAP:BNB Testing Key Support Amid Bearish Pressure
BNB is grinding lower in a short-term downtrend, now testing major support at ~$585.
Bullish bounce possible if it holds—eyes on a breakout above $615 resistance for a push to $630 target.
But watch for deeper dip risk to $550 if support cracks.
Key indicators: RSI dipping toward oversold (bullish divergence), MACD histogram flattening, and 50/200 EMA death cross signaling caution. 📉🚀
#BNB #CryptoTrading #AltcoinAnalysis
$BNB Channel Breakdown – Support Lifeline?BINANCE:BNBUSDT CRYPTOCAP:BNB Channel Breakdown – Support Lifeline?
Current trend: BNB's sliced through the descending channel, now grinding toward the 911 support after rejection from 1,020 highs—sellers aggressive, but volume drop signals potential trap 🛡️.
Hold support? Favorable yes; hammer wicks and prior lows could trigger a fierce bounce if volume flips green.
Breakout above resistance? Setup for 1,020 reclaim—could pump 5-7% to 1,050 on confirmation 🚀.
Dip risk? Heightened to 890 if cracks, riding BTC weakness.
Target: Rebound to 980 short-term; downside 880 buffer.
Indicators eyeing: RSI (28, deep oversold), Channel base test, and MACD divergence 📉.
#BNBTrading #CryptoSupport #AltcoinPioneers

usdt.d 4dHello
I am Mehdi with 4-hour analysis
Based on the analysis, we expect the cryptocurrency market to start a new upward trend
Reasons
1. We are at the ceiling of the daily timeframe channel
2. Accurate harmonic ratios
3. Price action pattern
4 MACD divergence
5 RSI divergence
Resistance level 5.7
Finally, thank you for supporting me by liking, sharing and commenting
