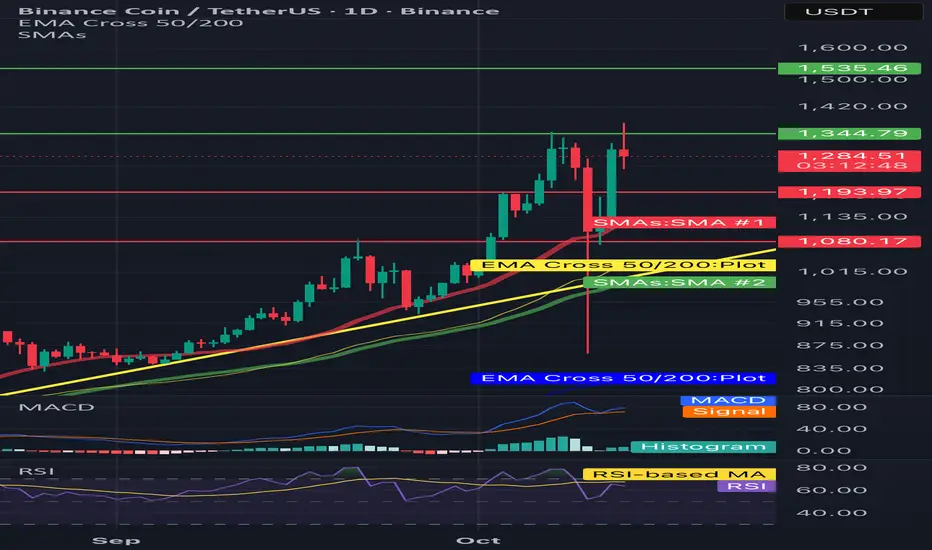
BNB/USDT 1D Chart Review🧭 Key technical levels
Resistances:
• 1,344–1,350 USDT – local resistance (last candle highs).
• 1,535 USDT – strong resistance from previous highs.
Support:
• 1,193–1,200 USDT – first strong support (the reaction of the candles is visible).
• 1,080 USDT – another important level, coincident with the yellow uptrend line and EMA50.
⸻
📊 Technical indicators
1.EMA/SMA:
• The red SMA and yellow EMA show that the medium-term trend is up (EMA 50 > EMA 200).
• The price is currently testing the zone between the SMA and EMA - if it stays above ~1,190-1,200, a rebound may occur.
2. MACD (bottom):
• The signal line (orange) crosses the MACD (blue) from above → bearish signal.
• The histogram is starting to flatten - possible end of correction if it lasts for a few days.
3.RSI:
• RSI around 50-55, neutral → no overbought or oversold yet.
• If the RSI rebounds from 50 upwards, it may mean the price rebounds from support.
⸻
📈 Scenarios
✅ Upward scenario (more likely if it maintains support)
• Maintaining above 1,190 USDT → reflection towards 1,344 and then 1,535.
• Confirmation: daily candle closed above 1,344 + increasing volume.
⚠️ Downside scenario
• Loss of the level of 1,190 USDT → correction to 1,080 USDT (EMA 50 test).
• If this support breaks, the next target is around USDT 950-1,000.
BNBUSDT
TradeCityPro | BNB Surges Beyond All-Time Highs👋 Welcome to TradeCity Pro!
In this analysis, I’m going to review BNB, the official token of Binance Exchange, which currently holds the #3 spot on CoinMarketCap with a market capitalization of $188 billion.
⌛️ 4-Hour Timeframe
On the 4-hour chart, after the broad market downturn, this coin managed to recover very well. Supported from the 1100 zone, BNB began to move upward again.
📊 A risky long trigger appeared on the lower timeframes around 1143, and if you entered based on that trigger, your position should now be sitting in good profit.
🎲 BNB has now broken through its all-time high after surpassing 1317, and the next corrective wave could potentially begin from here.
✔️ So far, the volume and momentum have both been strong, and there are no signs of weakness in the trend yet—meaning the upward movement can still continue.
✨ However, if this move turns out to be a fake breakout and the price stabilizes below 1317, BNB could enter a longer corrective phase. In that case, with confirmation of the fake breakout below 1317, a short position could also be considered.
📝 Final Thoughts
Stay calm, trade wisely, and let's capture the market's best opportunities!
This analysis reflects our opinions and is not financial advice.
Share your thoughts in the comments, and don’t forget to share this analysis with your friends! ❤️

BNB ANALYSThe analysis is on daily time frame and will give you a long term view
If these analyses help you to make better profits then share this analysis with your friends
And post your questions below this analysis

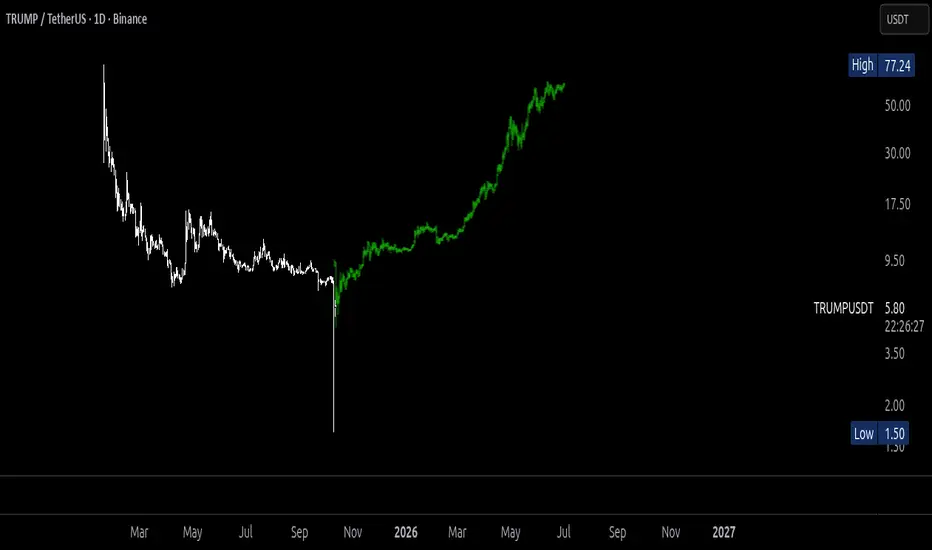
OFFICIAL TRUMP TO 700! ITS GONNA EXPLODE SOON!After the massive drop in cryptocurrencies in general, it seems similar to what happened during the COVID era. I expect the market to react explosively, and TRUMPUSDT should reach or approach BNB's level, reaching $700+.
JUST BUY AND HOLD!
Selling prices... 80, 150, 300, 600, 700.
Perfect Sync: V Reversal Meets Bull Flag
Two clean and classic technical structures:
✅ V-Reversal Formation
✅ Bull Flag – still active and building pressure
After a sharp reversal, the price entered a bullish continuation phase.
Currently moving within the flag structure toward its upper edge.
If we see a breakout to the upside, the move could match the flagpole length, which aligns well with the target from the V-reversal pattern.
📍 Bullish scenario remains valid as long as we stay within structure.
📉 Breakdown below $570 invalidates this setup.
🧠 Important Reminder:
Enter only after a confirmed breakout.
✅ Apply strict risk management
✅ Never risk more than 1% of your capital on a single position.
Everything’s clear. No noise. Just wait for confirmation — let the market come to you.

BNB; ATHHello friends
Given the recent growth we have had, the price has formed a double top pattern and is in the specified support areas, we can expect the price to be supported until the specified targets.
*Trade safely with us*

Can BNB hit 12% upside and reach $1,455 soon?Hello✌️
Let’s analyze Binance Coin’s price action both technically and fundamentally 📈.
🔍Fundamental analysis:
BNB Chain is stepping up faster blocks, lower supply, and new support for DeFi, AI, and RWA builders. These moves could make BNB more useful and rarer over time. 🚀
📊Technical analysis:
BINANCE:BNBUSDT is showing robust fundamentals and exceptional trading volume, supporting strength beyond pure technical. If key support levels hold, a further 12% upside toward $1,455 is plausible. 📈🚀
📈Using My Analysis to Open Your Position:
You can use my fundamental and technical insights along with the chart. The red and green arrows on the left help you set entry, take-profit, and stop-loss levels, serving as clear signals for your trades.⚡️ Also, please review the TradingView disclaimer carefully.🛡
✨We put love into every post!
Your support inspires us 💛 Drop a comment we’d love to hear from you! Thanks, Mad Whale

Binance Coin Positioned For 16% Upside Toward $1,280 TargetHello✌️
Let’s analyze Binance Coin’s price action both technically and fundamentally 📈.
🔍Fundamental analysis:
BNB burns have cut supply ~30% since 2017, while big holders like BNB Network Company push demand. Less supply and concentrated buying could boost price, as past burns often led to big rallies.
📊Technical analysis:
BINANCE:BNBUSDT has precisely reached its previous target and is trading within a rising channel, now approaching the upper boundary; a breakout could trigger a 16% rally toward $1,280.
📈Using My Analysis to Open Your Position:
You can use my fundamental and technical insights along with the chart. The red and green arrows on the left help you set entry, take-profit, and stop-loss levels, serving as clear signals for your trades.⚡️ Also, please review the TradingView disclaimer carefully.🛡
✨We put love into every post!
Your support inspires us 💛 Drop a comment we’d love to hear from you! Thanks, Mad Whale

Bnb/Usdt - Support Bounce And Weak High Target Current price shows a bullish trading setup for Binance Coin (BNB/USDT) on the 15-minute timeframe. The price forms a CHoCH (Change of Character) and crosses above the EMAs, signaling a possible trend reversal. The suggested entry is at the point where the CHoCH and EMA intersect, with a target price set at 1340. The setup is supported by a bounce from a strong support zone, aiming for a move toward the weak high area.

Long CAKEUSDT (D1). x3-x5 probablyLong CAKEUSDT. x3-x5 probably
entry - current level
TP1 - 10
SL - close below DMA200 (around 2.3 with confirmation on daily TF)
FA.
BSC DEX from last cycle.
BSC narrative.
TA.
1) High-volume buys in feb-march 2025 on a second retest of the lows (1.5 zone).
2) 200DMA - strong support for 3-4 months.
3) Just look at BNB/USDT chart and you'll get it :)
No need to overcomplicate.
p.s. NFA, DYOR

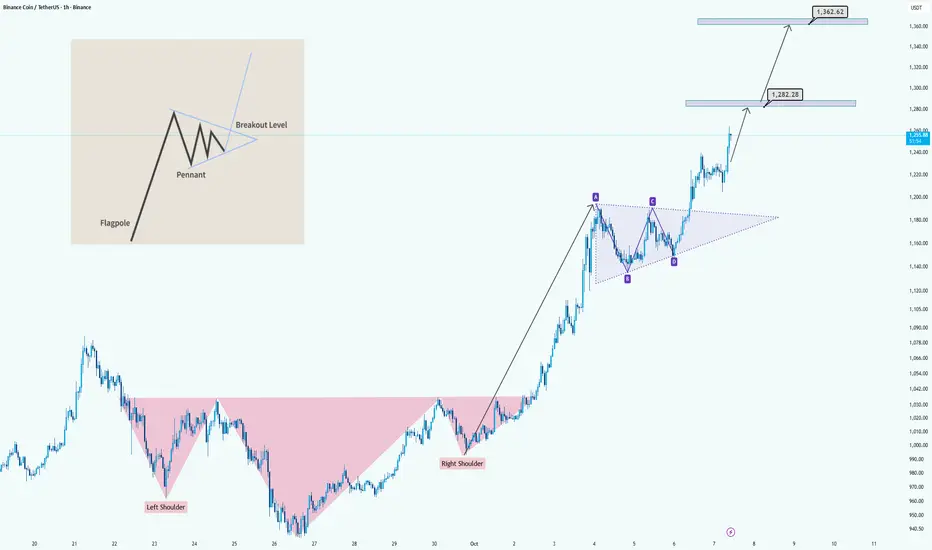
BNB/USDT: Bullish Breakout from H&S and Pennant FormationHi guys!
The chart clearly shows a bullish structure forming after a strong upward move. Initially, the price completed an Inverse Head and Shoulders pattern , signaling a potential trend reversal from bearish to bullish. After the breakout above the neckline, the market continued to climb and started consolidating into a bullish pennant pattern , a continuation setup that typically follows a sharp rally (flagpole).
The pennant breakout confirms renewed bullish momentum, suggesting the next leg higher is underway. Based on the flagpole projection, the measured targets are around $1,282 for the first resistance zone and $1,362 as the extended upside target.
In summary:
Patterns identified: Inverse Head and Shoulders + Bullish Pennant
Trend direction: Bullish continuation
Targets: $1,282 and $1,362
Outlook: Positive as long as price holds above the pennant breakout level
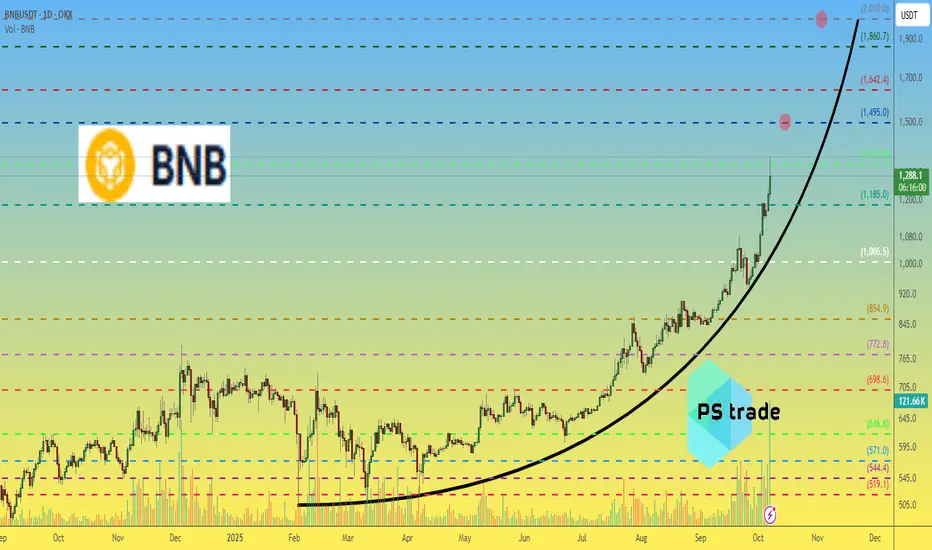
BNB price analysis🔥 CZ really knows how to launch candles to the sky — and this parabolic move feels like a true “comeback celebration”! 💥
💧 Even liquidity from CRYPTOCAP:ETH is now flowing into CRYPTOCAP:BNB — everyone’s trying to catch the wave.
Honestly, we wouldn’t be surprised if the goal is to “push” OKX:BNBUSDT to a clean $1500, that’s 2× from the previous ATH 🚀
But let’s be real — you don’t need to be a pro trader to see it:
the further price flies away from an already dangerous parabolic growth, the riskier new entries become ⚠️
😌 Ah… remember when CRYPTOCAP:BNB was $0.5 or even $5?
📊 P.S:
Chart levels are reacting quite well — a decent reference point for orientation.
🤔 What do you think — will CRYPTOCAP:BNB hit $1500 or even $2000, or is this already too much euphoria?
______________
◆ Follow us ❤️ for daily crypto insights & updates!
🚀 Don’t miss out on important market moves
🧠 DYOR | This is not financial advice, just thinking out loud
BNB Update📊 BNB Update
BNB is retracing now 🔄
If it keeps retracing to the green zone level 🟢, there’s potential to enter a long position — with confirmation ✅

solana x binance coin Solana follow it Binance Coin on its journey to $1k
CRYPTOCAP:SOL vs. CRYPTOCAP:BNB

BNBUSDT — Bullish consolidation ahead of resumed uptrendThe bullish consolidation in BNBUSDT that I’ve been watching has begun to resolve in the market’s favor. Price action is coiling after two consecutive white spinning-top candles, a pattern that signals indecision but also a readiness to resume the prior trend when confirmed. The move has occurred on heavier volume concentrated in the current price area, and the pair sits roughly halfway between two key Fibonacci retracement levels — a location that commonly precedes a corrective bounce rather than a full trend reversal. Trend Strength sits just above zero, suggesting a fragile bullish bias rather than conviction.
Viewed on a slightly wider timeframe, BNBUSDT is grinding inside a shallow range that resembles a consolidation brick; the path of least resistance still leans toward the upside provided the short-term structure holds. Conventionally, the presence of consecutive indecisive candles on increased volume near mid-Fibonacci territory combined with a mildly positive momentum indicator favors a corrective rebound rather than an extended sell-off.
Key short-term levels to monitor on the way up are the 38.2% Fibonacci retracement as the likeliest target for the initial bounce, with a secondary cap at the 50% retracement if buyers show enough follow-through. Beyond those, a return toward prior highs remains plausible, though that area will present a zone of elevated resistance and will need clear volume-backed breakout confirmation to be trusted.
RSI and other momentum readings are consistent with a measured recovery rather than an impulsive surge, so expect the move to unfold over the coming 2–3 weeks. If the market fails to sustain above the 38.2% level and momentum turns down, the alternate scenario would be a continuation of the consolidation or a deeper retracement toward the lower Fibonacci boundary.
Short summary:
Setup : consolidation with two white spinning-top candles, heavier volume locally, price midway between two Fibonacci levels, Trend Strength slightly > 0.
Base case : corrective bounce to 38.2% (primary) — up to 50% (maximum) — then continuation higher toward prior highs (resistance zone).
Timeframe : ~2–3 weeks.

ASTERUSDT - Extreme bullish ahead!BNB tokens are on fire right now 🔥.
If you ask me for a personal pick, I’d say #ASTER.
It’s currently forming a triangle pattern, and honestly, if it breaks it, you might miss the entry — so better buy now.
Short-term target: at least $3.5.
Best regards:
Ceciliones🎯

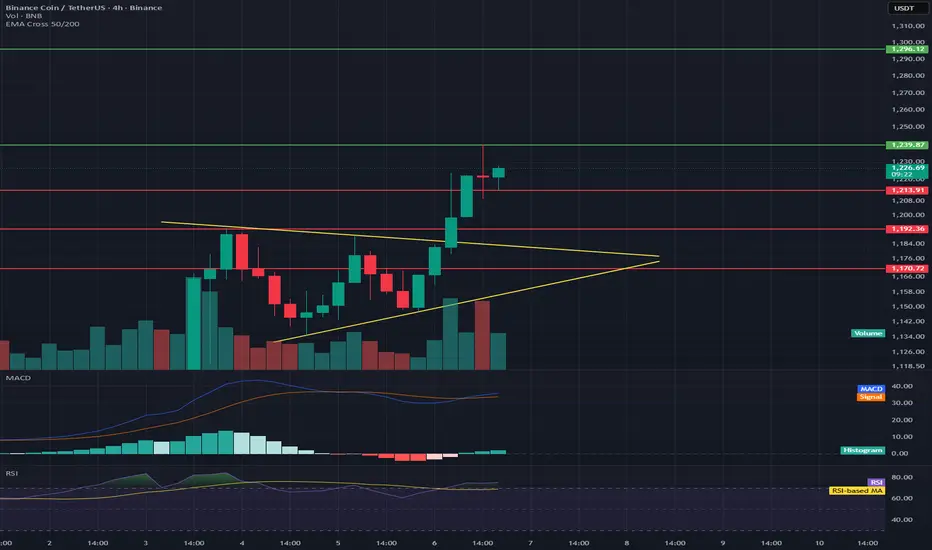
BNB/USDT 4H Chart Review📊 Market Structure
The chart shows a symmetrical triangle (yellow lines) from which a breakout occurred upwards—a classic signal of a continuing uptrend.
The price has broken above resistance at ~$1,210, which now acts as local support.
Current price: ~$1,226, following a dynamic breakout from the triangle.
📈 Key Levels
Support:
$1,210 — Retest after the breakout (important defensive level for bulls)
$1,193 — Previous local support in the triangle
$1,170 — Stronger support and lower boundary of the previous consolidation
Resistance:
$1,239 — Local resistance that has already been tested
$1,260–$1,265 — Next target upon breakout (equal movement or measuring the height of the triangle)
$1,300 — Psychological and technical resistance level
📊 Volume
The breakout was confirmed by a significant increase in volume, lending it credibility.
No sharp drop in volume after the breakout — the market remains in demand.
⚙️ MACD
The MACD is above the signal line and rising, confirming a bullish impulse.
The histogram is positive, but not excessively broad → momentum is healthy, but not overheated.
💪 RSI
RSI: ~75, which is slightly in the overbought zone.
It's worth watching for a short-term correction or retest of the $1,210 level before the uptrend becomes more established.
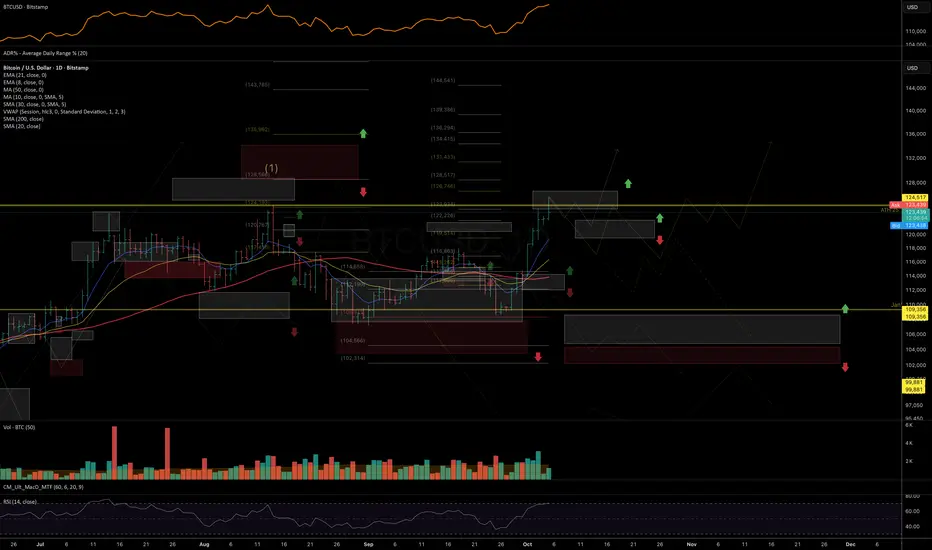
Weekly Crypto Market Outlook: Trend Structures and Expectations The market continues to follow a macro-pattern similar to the previous bull cycles that unfolded in Q4 of 2013, 2017, 2020, and 2021. I discussed this structure in detail in my August 18 update:
Specifically: a summer rally, several weeks of September correction and consolidation, followed by the beginning of a new upside leg in early October.
Updated BTC chart:
Another key development is the stablecoin market capitalization approaching a major technical zone. A confirmed breakout above it could signal a strong liquidity rotation into crypto assets — potentially marking the start of a new wave of growth across the crypto space, similar to the dynamics seen in 2023 and 2024.
Inverse correlation of BTC and stablecoin market cap:
Perhaps the most compelling factor is Bitcoin’s relationship with gold. Despite massive institutional adoption through ETFs, the BTC/GOLD ratio has remained stagnant since early 2021. This suggests that Bitcoin remains significantly undervalued relative to gold, leaving substantial room for appreciation as the digital asset continues its mainstream integration.
BTC/GOLD chart:
These factors — combined with the fact that most altcoins have already broken above their local resistance zones mentioned in the previous review — point to a potential recovery of upside momentum across the crypto market and higher targets into Q4.
As long as prices hold above their local and mid-term support zones, I expect continuation of the rally toward the next resistance levels. Breaking these support zones, will push odds in favor of more prolonged consolidation. But as long as BTC is not closing bellow its 50DMA for more than two weeks, macro bull cycles remains intact.
Below are the key technical levels for the main assets this week:
BITSTAMP:BTCUSD
Chart:
Short-term support: 122–119.5K
Mid-term support: 117–115K
Resistance: 131–135K
BITSTAMP:ETHUSD
Chart:
Support: 4400–4375
Resistance: 4870–5070
BINANCE:BNBUSD
Chart:
Support: 1142–1089
Resistance: 1225–1275
BINANCE:XRPUSDT
Chart:
Support: 2.92–2.88
Resistance: 3.20–3.35
CRYPTO:HYPEHUSD
Chart:
Support: 48.5–47.35–46
Resistance: 55.5–60
BINANCE:SOLUSDT
Chart:
Short-term support: 223–219
Mid-term support: 212–207
Resistance: 247–260
Thank you for reading - wishing you a great Sunday and a strong start to the new trading week.
BNB is definitely on its way to $1000.BNB has been consolidating for around 250 days , which is a solid amount of time to build momentum for a breakout. It's almost certain that BNB will hit $1000 soon .
However, this prediction becomes invalid if the price breaks down below $500 with significant volume.
A good price range for accumulation is between $500–$650.
CRYPTO:BNBUSD

$BNB SURPRISED $1,111 INCREDIBLE PRICE DONE ($999-$1,111)CRYPTOCAP:BNB SURPRISED $1,111 INCREDIBLE PRICE DONE ($999-$1,111)
Previous Incredible Price 2025
$777 $888 $999 $1,111
Future Incredible Price 2028
$2,222 $3,333 $4,444
#Write2Earn #BinanceSquareFamily #Binance #BNB #SUBROOFFICIAL
Disclaimer: This article is for informational purposes only and does not constitute financial advice. Always conduct your own research before making any investment decisions. Digital asset prices are subject to high market risk and price volatility. The value of your investment may go down or up, and you may not get back the amount invested. You are solely responsible for your investment decisions and Binance is not available for any losses you may incur. Past performance is not a reliable predictor of future performance. You should only invest in products you are familiar with and where you understand the risks. You should carefully consider your investment experience, financial situation, investment objectives and risk tolerance and consult an independent financial adviser prior to making any investment.

BNB Eyes 9% Upside, Targeting 1110 USD Next RallyHello✌️
Let’s analyze BNB’s price action both technically and fundamentally 📈.
🔍Fundamental analysis:
BNB keeps shrinking supply with its auto-burn, while daily activity and DeFi use stay strong. If demand holds, it’s bullish long-term but slower adoption could cut the effect.
📊Technical analysis:
BNB is trading within a strong ascending channel, hitting new all-time highs with robust volume 🚀. Holding this zone could support at least a 9% upside, targeting 1110 USD 📈.
📈Using My Analysis to Open Your Position:
You can use my fundamental and technical insights along with the chart. The red and green arrows on the left help you set entry, take-profit, and stop-loss levels, serving as clear signals for your trades.⚡️ Also, please review the TradingView disclaimer carefully.🛡
✨We put love into every post!
Your support inspires us 💛 Drop a comment we’d love to hear from you! Thanks, Mad Whale

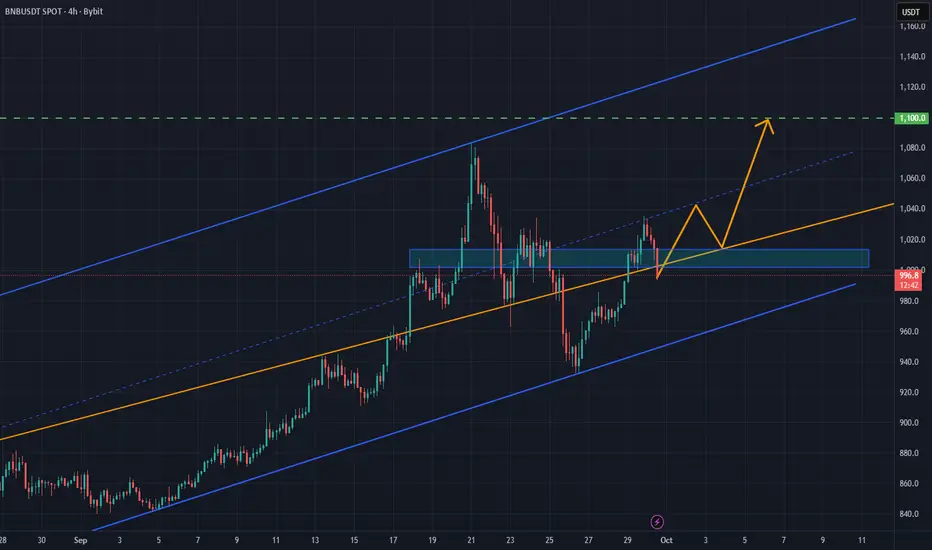
BNB/USDT 4h chart review1. Trend and structure
• The price struck the relegation (orange) line, which is a positive signal.
• Currently, the course oscillates around 1007 USDT after reflection from holes ~ 930.
2. Key levels
• Support: 995, 971, 930.
• Resistance: 1026, 1051, 1084.
3. MacD
• The histogram grows, but begins to slightly weaken.
• MacD line still above the signal → slightly bullish signal, but with braking signs.
4. RSI (4H)
• RSI around 55–60 → neutral/bullish, not yet burdened.
5. Simple interpretation
• As long as the course lasts above 995, the upward scenario is possible.
• Breaking above 1026 will open the road to 1051 and 1084.
• decrease below 995 → Risk of retests 971, and later 930.

BNB/USDT: Bullish Structure Intact Above Key Support ZoneBNB/USDT is trading within a well-defined upward channel following a corrective pullback from its all-time high near 1,080. The recent rebound from a higher low around 1,000 confirms the presence of structural support and sustained bullish momentum.
If buyers continue to defend the 1,000–1,010 zone, price could push toward the 1,100+ pullback area. As long as the channel trendline remains intact, the broader outlook supports a bullish continuation toward higher levels.