I'm shorting $BNB here, guys...📉 ... We just had our first touch at the 1.618 Fibonacci extension — around $1,006 — and I seriously doubt it’s going to break through cleanly and fly into price discovery. 🚫📈
📊 Weekly chart looks extremely extended, and this Fib level is a classic reversal zone.
No clear volume support above, and the rally looks overextended.
⚠️ Risk is asymmetric here — I’m betting on the first rejection.
If I’m wrong, I’ll cut quick.
But if I’m right, we might catch a nasty drop from the top. 💥
🔎 Let’s see how this plays out.
BNBUSDT

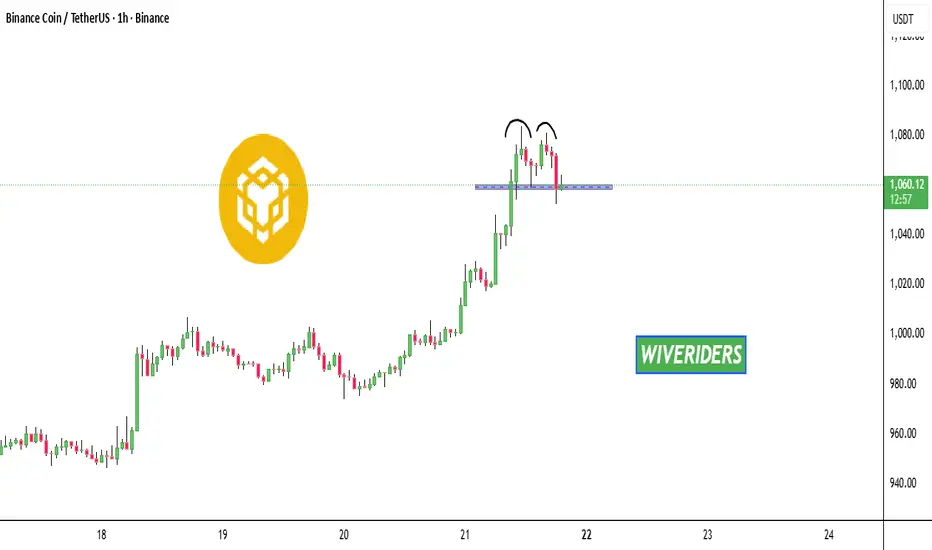
BNB is forming a bearish double top pattern📊 CRYPTOCAP:BNB Market Update
CRYPTOCAP:BNB is forming a bearish double top pattern 🔻 and is now testing the blue support zone 🔵. Watch closely — if support breaks, further downside could follow.
Crypto Market Weekly Review: Trend Structures and Key ExpectatioOverall trends continue to develop within the macro structures outlined in previous weekly reviews. Some assets (BNB, SOL, HYPE) are already in new uptrends, while others are only starting to form the first impulsive moves within broader bullish structures.
In the coming days, I expect local downside pressure to complete the ongoing September corrections, followed by a continuation of the uptrend toward target resistance zones. Another wave of Autumn consolidation is likely to follow afterward.
From a macro perspective, as long as prices hold above their key support zones, I continue to view the September lows as important macro higher-lows. Below these levels, most coins (possibly with the exception of ETH) are unlikely to fall and should instead continue forming higher lows ahead of a more sustainable rally into Q4.
⸻
BINANCE:BNBUSDT
Chart:
Support: 1000–930
Resistance: 1135–1150
⸻
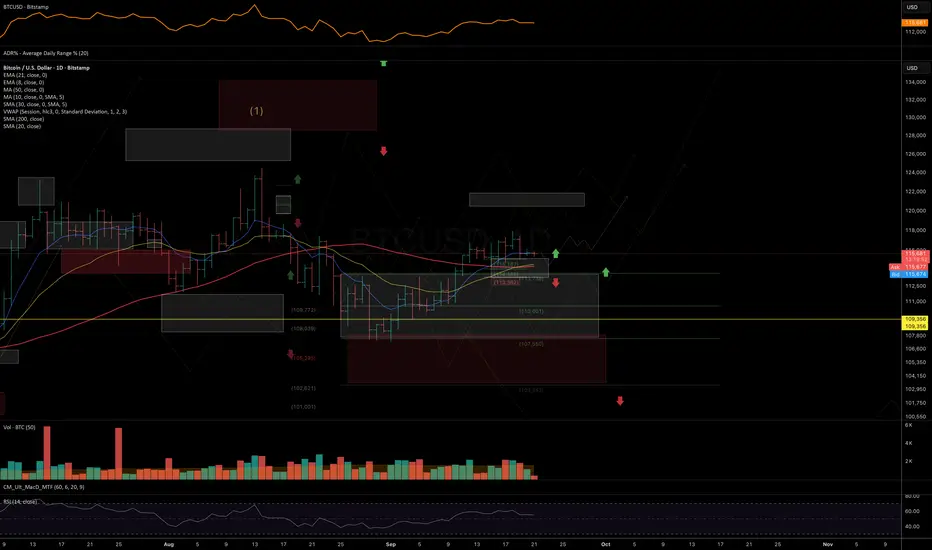
BINANCE:BTCUSDT
Chart:
Support: 115–113.3K
Resistance: 120–122K
⸻
BINANCE:XRPUSDT
Chart:
Support: 2.97–2.91 / 2.85
Resistance: 3.30–3.40
⸻
BINANCE:ETHUSDT
Chart:
Support: 3380
Resistance: 5060–5235
⸻
BINANCE:SOLUSDT
Chart:
Support: 230–223
Resistance: 285–310
⸻
$HYPEHUSDT
Chart:
Support: 52.5–51
Resistance: 67–73
Feel free to comment which coins and assets you’re most interested in, and I’ll prepare a separate review on them.
Thank you for your attention, and wishing you a successful week ahead!
BNB CAN MAKE A NEW ATHi think BINANCE:BNBUSDT still bullish and can make a new ATH in the next Hours . i don't know how far it can reach but a new ATH is in plan!
best entry point can be in 4H FVG

BNB/USDT: Bullish Climb to 965?As the previous analysis worked exactly as predicted, BINANCE:BNBUSDT is gearing up for a bullish move on the 4-hour chart , with an entry zone between 859-868 near a key support and trendline.
First target at 930 marks initial resistance, while the second at 965 signals a potential breakout. Set a stop loss on a daily close below 840 to manage risk effectively. 🌟
A break above 875 with solid volume could trigger this climb, driven by BNB ecosystem news and market momentum. Watch BTC trends! 💡 Ready for this rise? Drop your take below! 👇
📝 Trade Plan:
✅ Entry Zone: 859 – 868 (support + trendline area)
❌ Stop Loss: Daily close below 840 to manage risk
🎯 Target 1: 930 (initial resistance)
🎯 Target 2: 965 (potential breakout zone)
Ready for this rise? Drop your take below! 👇

BNB THE $1000 ATH on wayBNB did a new ATH and can complete it over $1000 in the coming time, which makes BNB a strong coin movement.

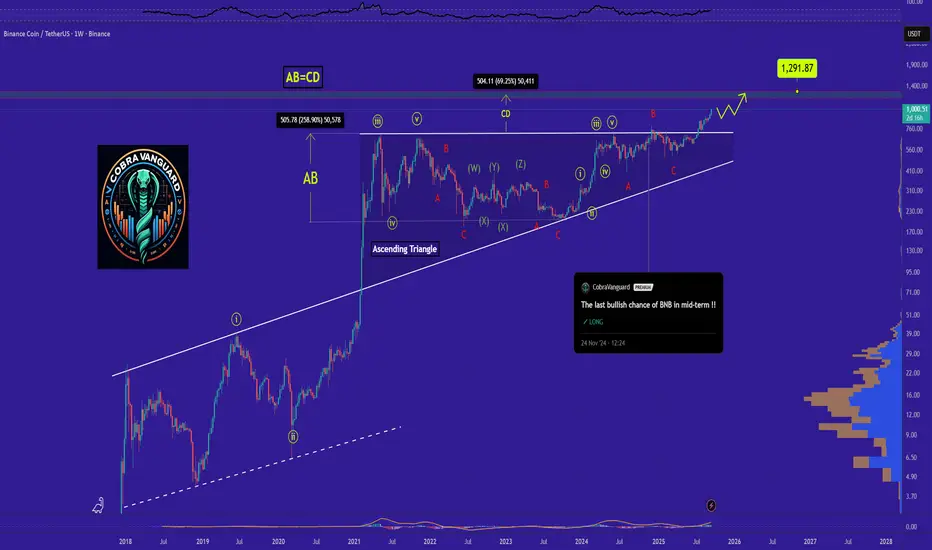
BNB is bullish now and many Traders don't see it !!As I said, BNB broke the triangle, it reached to $1000 , and you still think I'm joking!!
The price is currently supported well, which can increase the price.
Stay Awesome , CobraVanguard
previuos analysis
$BNB FINALLY $1K DONE. Q4, 2024 I was Predict (Now$999 - $1,111)Always Control your Money management and try to long term investment for big rewards.
#Write2Earn #BinanceSquareFamily #Binance #BTC☀ #SUBROOFFICIAL
Disclaimer: This article is for informational purposes only and does not constitute financial advice. Always conduct your own research before making any investment decisions. Digital asset prices are subject to high market risk and price volatility. The value of your investment may go down or up, and you may not get back the amount invested. You are solely responsible for your investment decisions and Binance is not available for any losses you may incur. Past performance is not a reliable predictor of future performance. You should only invest in products you are familiar with and where you understand the risks. You should carefully consider your investment experience, financial situation, investment objectives and risk tolerance and consult an independent financial adviser prior to making any investment.

Technical analysis for BNB/USDT1. Overall Trend (Price Action & Market Structure)
• Long-term trend: Strong bullish trend — since March 2025, price broke out of a long consolidation zone (~550–680 USDT) and is now hitting new highs.
• Mid-term trend: After breaking out from the accumulation range, price is forming a sequence of Higher Highs (HH) and Higher Lows (HL).
• Key supports: ~786 USDT (breakout zone + 0.786 Fib), 720 USDT (previous local top).
• Key resistances: Current resistance zone ~860–880 USDT. Next target: ~975–980 USDT (1.618 Fib).
⸻
2. Fibonacci Analysis
From the drawn retracement:
• Price has broken above 0.786 and is now trading beyond the 1.0 Fib.
• Fibonacci extensions:
• 1.272: ~920 USDT
• 1.618: ~975–980 USDT → likely target if momentum stays intact.
• Current price action suggests the market could aim for 1.618 within the coming weeks if no major correction occurs.
⸻
3. Volume
• Breakout from consolidation was supported by increasing volume — confirming strong buying interest.
• Recent bullish candles have moderate volume — not yet euphoric, but demand is clearly exceeding supply.
• If near 880–900 USDT we see large-volume candles with long upper wicks, this could signal distribution.
⸻
4. RSI (Momentum)
• Daily RSI is around ~72 → market is entering overbought territory.
• Two possible scenarios:
• Continuation: RSI can remain overbought during strong trends (overbought can stay overbought).
• Correction: RSI dropping below 70 with bearish divergence forming against price.
⸻
5. Chart Patterns
• Breakout from a wide rectangle range (550–680 USDT).
• Current move resembles a mark-up phase with a possible mini-flag on H4.
• No clear signs of Wyckoff-style distribution yet.
⸻
6. EMAs / SMAs
(Not visible on your chart, but based on typical setups in such a trend):
• EMA20 and EMA50 on D1 are strongly spread apart — confirming bullish momentum.
• Price is far above EMA200 → long-term trend remains healthy.
⸻
7. Scenarios
Bullish:
• Holding above 820–830 USDT → attack on 920 USDT, then 975–980 USDT (1.618 Fib).
• RSI may stay >70 for several days, historically giving BNB an extra few % of gains.
Bearish:
• Drop below 820 USDT → retest of 786 USDT support.
• Break of 786 → deeper correction towards 720 USDT (breakout retest).
⸻
8. Summary
• Trend: Strong bullish trend, momentum still favors buyers.
• Key levels:
• Support: 786 → 720 USDT
• Resistance: 880 → 920 → 975–980 USDT
• Risks: Possible pullback at RSI >70, especially if volume spikes and large upper wicks appear.

BNB: BREAKING OUT AND TESTING WEEKLY RESISTANCEBinance Coin BNB/USDT is exhibiting 2 interesting patterns at the moment on weekly timeframe
1. A Breakout and re-test of the weekly resistance (since ATH in May 21 to ATH in Jun 24).
2. Although not a perfect cup and handle pattern, yet if considered one, it shows a thrilling target @ $1000 (which is achievable in upcoming bull run)
Best of Luck!!

BNB WEEKLYHello friends🙌
🔊We are here with BNB analysis:
A long-term analysis that can be viewed as an investment, but in the long term, with patience and capital management...
You can see that after weeks of price suffering, a good upward move has now been formed by buyers, which has also caused a new ceiling to be set. Considering the market decline and the decline of most currencies, you can see that BNB is well supported and its price has suffered.
⚠Now, with the arrival of buyers, you can enter a long-term buy trade with capital management.
🔥Follow us for more signals🔥
*Trade safely with us*

BNB/USDT Short-Term🔎 Current situation:
• Price: ~ 896.9 USDT.
• Trend: You can see an upward trend short -term, but now the price consolidates just below the resistance.
• Support:
• 892.8 (SMA - short -term).
• 885.5 (key horizontal support).
• resistance:
• 899.5 (local resistance, SMA #1).
• 907.9 (strong resistance - previous peak).
⸻
📊 Indicators:
• SMA: The price balances between the short (892.8) and the long average (green ~ 896). This gives a picture of the "balance point".
• MacD: The lines are close to each other, the histogram decreases → neutral signal, possible transition towards sales, if the signal line goes up above MacD.
• RSI: ~ 50–55 → neutral zone, nor purchase nor sales.
⸻
📈 short -term scenarios (1-6h):
1. Bull (more likely if it stays above 892.8):
• Breaking 899.5 → Attack on 907.9.
• If the volume increases, up to 912+ may occur.
2. Bear (if it goes below 892.8):
• decrease towards 885.5 (key level of support).
• Punction 885.5 → Movement down to 878–880.

BNBUSDT 1H coin holding the channelBinance Coin keeps moving inside its upward channel, once again confirming support at the lower boundary. EMAs are aligned below price, creating a local cushion, while the volume profile highlights accumulation around 860–870.
As long as price holds above 838, the structure stays bullish with the next upside target around 920–940.
Fundamentally BNB still carries the weight of the largest exchange behind it, which adds long-term confidence for buyers.
Right now BNB looks like a train on its rails
the direction is clear, only the speed of the ride remains in question.

BNB/USDT: Bullish Momentum Sustains Within Upward ChannelThe BNB/USDT market continues to trade within a strong ascending channel, having rebounded from the 865 support zone, which reaffirmed bullish momentum. The price action displays a clear pattern of higher lows and a steady rise along the upward trendline, signaling firm buyer control.
Currently, the price is aiming for the 932 level, with a possible extension toward the 970 resistance zone if momentum remains intact. While a mid-channel rejection could lead to short-term consolidation, the overall structure supports the likelihood of a continuation rather than a reversal.
As long as the channel holds, the bulls are well-positioned to challenge the overhead resistance zones, keeping the uptrend scenario firmly in play.

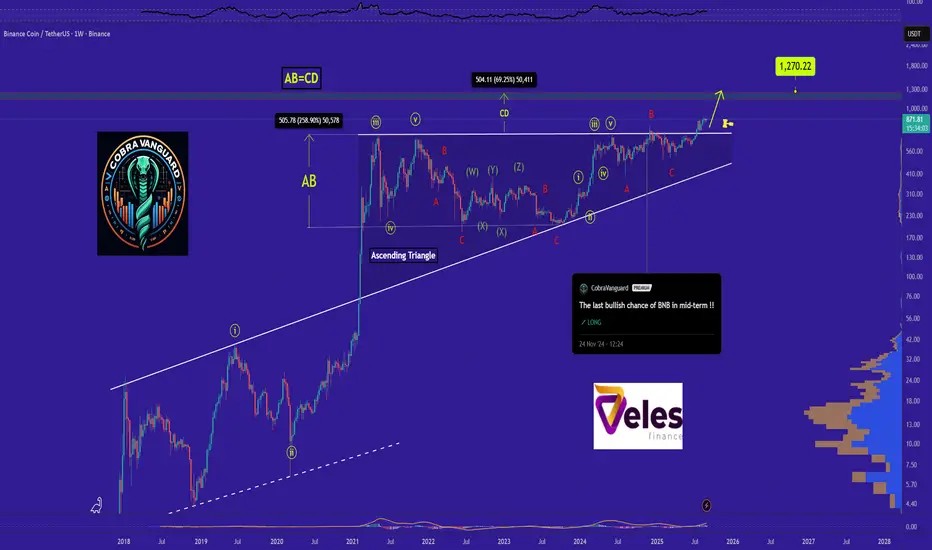
BNB is bullish now and many Traders don't see it !!As I said, BNB broke the triangle, it could surge to $1000 , and you still think I'm joking!!
The price is currently supported well, which can increase the price.
Stay Awesome , CobraVanguard
Previous analysis
BNB: Downward TrendOn August 24, the BNB market turned into a downward move on the 1-hour chart from the $871 level. Since then, price has steadily moved through profit-taking zones and reached a low of $832, giving a difference of nearly $40 per coin. The trade has already passed four targets and remains active, keeping potential for further continuation.
The main value here lies in management. The algorithm step by step highlighted profit-taking zones and helped relieve emotional pressure. This approach allows traders to hold positions longer and capture more from the move without giving in to fear or greed.
For beginners, it works like a navigator: simplifying chart reading and showing where it’s safer to take profit and where holding makes sense. The market will always be unpredictable, but when the process is structured, trading stops being a chaotic gamble and turns into a system where discipline makes the difference.

BNB/USDT 4H chart1. Trend
• There is a clear yellow inheritance trend on the chart - the price has been moving under it for a long time.
• Currently, the course is testing this line - that is, we are at which it is possible to either break up the mountain or another reflection down.
⸻
2. Key levels
• Resistance resistance:
• 856 USDT (SMA - green line, short -term resistance).
• 865 USDT (last local peak, additional psychological resistance).
• Support (Support):
• 849 USDT (red SMA #1).
• 843 USDT (horizontal support).
• 835 USDT (stronger support, marked in red).
⸻
3. Indicators
• SMA - the price is between short -term (red) and medium -term (green) average walking. This is a consolidation signal.
• MacD - the blue line pierces the orange from the bottom, the histogram begins to shine green → a sign of potential growth.
• RSI - around 45–50 → neutral, shows neither a sale nor buying out. It indicates the possibility of both directions.
⸻
4. Possible scenarios
• bullish (upward):
• If the price stands out above 856–865 USDT and persists, a possible level of 880 USDT levels.
• Confirmation will be further strengthening MacD and RSI going towards 60+.
• Bear (inheritance):
• If the course is rejected from the trend line, the decline may go down to 843 USDT first, and in case of puncture - up to 835 USDT.
• RSI Congress below 40 and MacD reversing down will confirm their weakness.
⸻
✅ Summary:
BNB is now in the decision zone - it tests the downward trend line and key resistance at 856–865 USDT. MacD suggests that bulls are trying to take the initiative, but RSI is still neutral. If the mountain is broken, the movement can be dynamic. If rejection - descent to 835 USDT very real.

BNB weeklyBNB is in an uptrend on the weekly timeframe and has broken above the key $700 resistance.
However, a bearish divergence on the MACD signals a potential correction.
Key support: $700 – Next resistance: $1,100.
Overall trend remains bullish, but a pullback may occur before further upside.

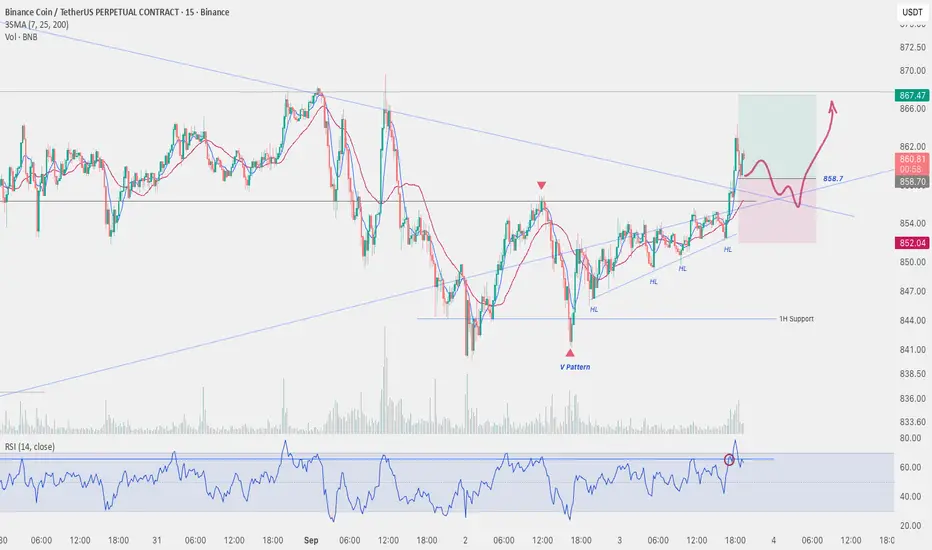
Sep 3, 2025 - BNBUSDT Long Position ReviewFor my last position today, I opened a long trade on BNB . After the price touched and reacted to the daily ascending trendline, I set my entry trigger above the first 1H resistance at 856 . Similar to other coins, the V-pattern that formed before the breakout gave me additional confidence in the bullish move.
Once the strong 1H candle closed above resistance, I placed a buy stop order above its wick at 858.7 for extra confirmation, which eventually triggered my entry.
I must admit, this trade was a bit emotional — it would have been better to wait for a confirmed medium wave cycle bullish structure before entering. On top of that, the BNB/BTC chart doesn’t look very bullish, which suggests I might have found a better setup on other coins. The main reason I rushed was the opportunity to use relatively high leverage on this setup.
📌 Stop-Loss Strategy
The main strength of this trade is the well-positioned stop-loss. Even if price decides to retest the broken descending trendline with a pullback, my stop would not be triggered prematurely.
⚠️ Overall, this is a risky position that is currently open. If I notice weakening bullish signals, I’ll likely exit early.
BNBUSDT Highwave-Cycle on 4H Timeframe:
BNB/BTC Chart:
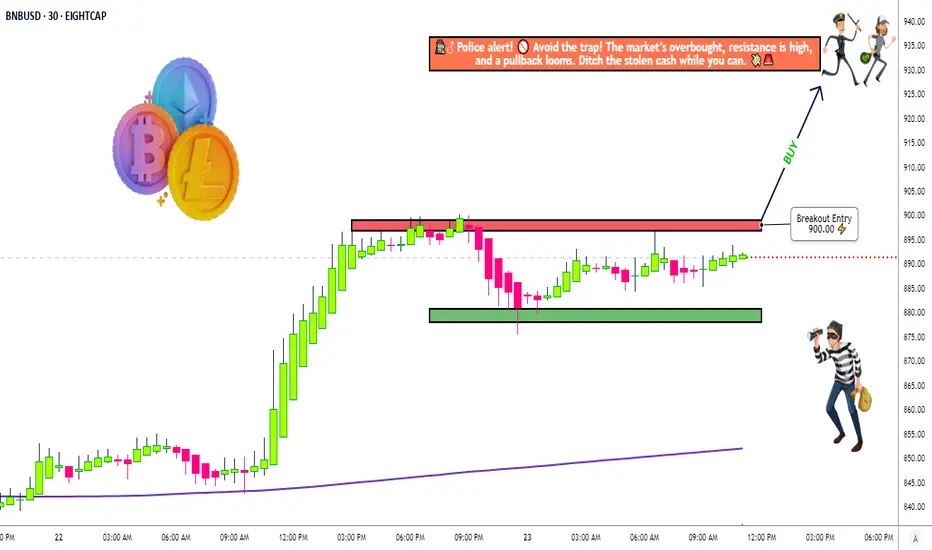
Binance Coin Robbery Setup – Bullish Layers or Police Trap?🚨💰 BNB/USD Crypto Market Grand Heist Plan 🎭🚨
🕵️♂️ Dear Thief OG’s & Market Robbers,
The vault door is open in BNB/USD “Binance Coin vs U.S Dollar” Crypto Market — today’s Day Trade Heist is about to begin! 🔥
📜 Master Plan
Direction: 📈 Bullish Robbery Mode Activated
Entry 🎯: Thief never knocks once — we layer entries at:
900.00 💵
890.00 💵
880.00 💵
👉 You can add more layers depending on how big your bag needs to be!
Stop Loss 🛑:
Thief SL is hidden at 870.00 — escape hatch ready!
⚠️ Adjust your SL based on your own strategy & risk appetite.
Target 🎯:
Police barricade spotted! 👮♂️💥
Our grand escape with the loot is at 930.00 — grab it before they catch you! 🚔💨
💡 Thief’s Strategy
We don’t enter all-in — we slice the entry with multiple limit orders (layering strategy style), just like cracking a safe piece by piece.
Patience, discipline, and precise timing = a clean heist. ⏱️🔓
⚠️ Trading Alert: Stay sharp — news releases & sudden volatility can trigger alarms. Always manage your positions and keep your stops in check!
💖 If this heist plan fuels your robbery spirit, hit the Boost Button 💥 and strengthen the Thief Army.
Together we rob the market daily with style, precision & profit. 🏆💪🤑
BNB to $1700BNB moves faster now, with a resistance line at 61% of the Fibonacci channel, around $1700, potentially the peak.

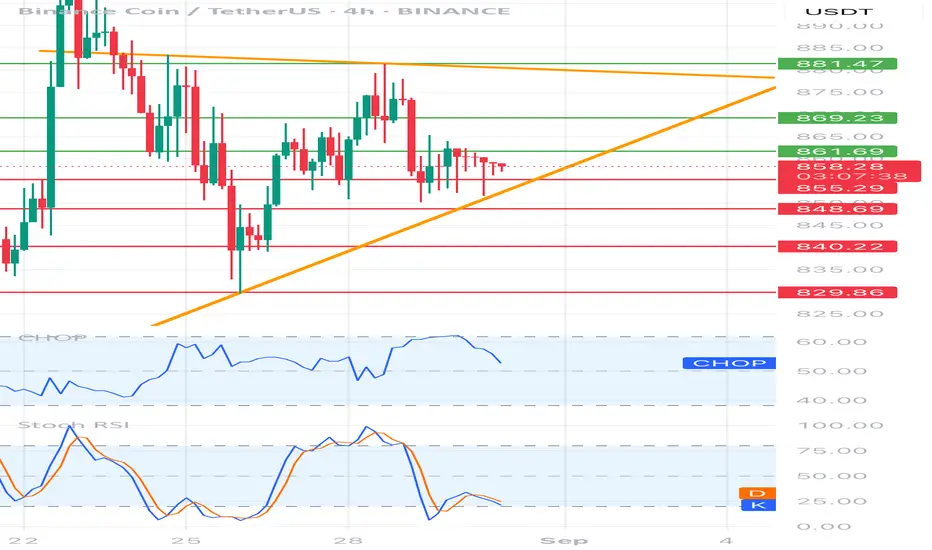
BNBUSDT 4H Chart 1. Price structure
• Current price: ~ 858 USDT
• The price moves in the clinic in a lowering (yellow lines). Upper inheritance trend (~ 881) + lower growth line (~ 848).
• We see consolidation - the market is "squeezed" between supports and resistance.
2. Horizers of support and resistance
• Support:
• 855 (local, this is where the price stopped)
• 848 (Important - lower wedge + demand level)
• 840 and 829 (key with a larger decline).
• resistance:
• 861 (first test, short -term)
• 869 (stronger resistance, earlier reflections)
• 881 (upper wedge line, strategic resistance).
3. Oscillators
• RSI (Chop) - around 50, i.e. neutral → no clear advantage of bulls/bears.
• STOCHASTIC RSI - is located at the bottom of the zone (approx. 20-25), which suggests the possibility of reflecting up (bull signal, but only after the candle confirmation).
4. Scenarios
Bullish (reflection up):
• If the price persists over 855–848 → possible reflection to 861 and 869.
• Breaking above 869 → opens the road to 881 (Test of the upper line of Klina).
• Only closure of the 4h candle above 881 → a signal of a kick from the wedge and a stronger upward movement.
Bearish (continuation of the inheritance):
• If the price drops below 848 and closes the candle at this level → strong inheritance signal, tarpapers: 840 and 829.
• 829 is key support - its bursting down can deepen the declines.
⸻
📊 Summary
BNB is now in the Departing Clinic, in the uncertainty zone:
• Maintenance 848–855 = chance of reflection.
• Punction down 848 = signal to a stronger decrease.
• Only breaking above 881 = signal of stronger growth movement.
BNB Retracement Ahead?CRYPTOCAP:BNB wave 5 looks complete at the weekly R1 pivot. RSI continues to print weekly bearish divergence from the wave 3 high.
Wave IV was a difficult count but appears to be a triangle which is a final pattern before the terminal move. Wave 2 retracement target usually ends at the bottom of wave 4 so $90 in this case which also finds confluence with 0.382 Fibonacci retracement and a swing below the weekly pivot, a good long signal.
Analysis is invalidated if we continue into price discovery.
Safe trading
