BNB/USDT at Critical Zone – Trend Continuation or Correction?On the 4-day timeframe, BNB/USDT is currently undergoing a healthy correction following a strong bullish impulse that previously formed a blow-off top near the 1,375 level. Price is now retracing into a critical technical area that will likely determine the next major directional move.
---
Pattern & Market Structure Explanation
1. Strong Impulsive Rally
BNB experienced a sharp, near-parabolic rally, signaling strong bullish momentum and a phase of market euphoria.
2. Blow-Off Top Formation
The peak around 1,375 was followed by aggressive selling pressure, indicating distribution from smart money.
3. Corrective Structure (ABC / Descending Pullback)
The current decline appears corrective rather than a full bearish reversal, characterized by controlled lower highs and orderly price action.
4. Major Demand Zone / Previous Resistance Flip
The yellow zone at 765–720 represents:
A historical consolidation area
A former strong resistance level
A potential support-resistance flip (SR Flip) and high-probability demand zone
---
Key Levels to Watch
Resistance Levels:
892
989
1,135
1,300
1,375 (ATH / Major Supply)
Support Levels:
765 – 720 (Major Demand Zone)
Below 720 → risk of deeper correction
---
Bullish Scenario
Price holds and reacts bullishly within the 765–720 demand zone
Bullish confirmation may include:
Strong rejection
Long lower wicks
Break of minor bearish structure
Upside targets:
892 → 989 → 1,135
If momentum strengthens, a retest of 1,300 – 1,375 becomes highly probable
This scenario confirms the move as a pullback within a larger bullish trend
---
Bearish Scenario
A strong 4D close below 720
Demand zone fails to absorb selling pressure
Price may continue correcting toward lower historical support levels
Market structure shifts into a medium-term bearish continuation
Bearish bias is confirmed if subsequent rallies fail to form a higher low
---
Conclusion
BNB is currently trading at a critical decision zone. The 765–720 area is the key battlefield between buyers and sellers. Price reaction here will determine whether BNB resumes its macro bullish trend or enters a deeper corrective phase. Patience and confirmation are essential before taking any position.
---
#BNBUSDT #BNB #CryptoAnalysis #Altcoin #TechnicalAnalysis #MarketStructure #SupportResistance #DemandZone #SwingTrading #CryptoMarket
Bnbusdtanalysis

BNB About to Crash Hard or Just Faking You Out?Yello Paradisers, is BNB setting up for a major dump, or is this just another trap for impatient traders? This next move could catch a lot of people off guard if they're not paying attention to key levels.
💎BNBUSDT is currently looking bearish, as it's reacting strongly from a key resistance zone. This level is further reinforced by the 200 EMA, making it a significant area of confluence. On top of that, price has recently broken down from an ascending channel, which adds further confirmation to the potential shift in trend direction. When these signals line up like this, the probability of a bearish move increases substantially.
💎Now, ideally, we want to see a pullback into the resistance zone. That would give us a much better risk-to-reward entry for a potential short. However, entering blindly is never the move — we need clear confirmation. Specifically, we’ll be watching for a strong bearish candlestick pattern to form right at the resistance zone. If we get that, we can then expect a move toward the next liquidity zones and support levels below.
💎That said, we must stay objective. If BNB manages to break above the invalidation level and closes a candle beyond that point, it will completely invalidate the current bearish outlook. In that scenario, it's better to stay out and wait patiently for stronger price action to develop. There’s no need to force trades when the setup isn't perfect.
🎖Strive for consistency, not quick profits. Treat the market as a businessman, not as a gambler.
MyCryptoParadise
iFeel the success🌴

BNB/USDT Setup – Will the Moving Average Confirm the Bull Move?💎 BNB/USDT – "BINANCE COIN VS TETHER" 💰
Crypto Market Opportunity Blueprint (Swing Trade)
📈 Plan: BULLISH
After a period of compression within a triangular structure, BNB is preparing for a potential breakout. The breakout above the triangular moving average could trigger a new bullish wave — offering a solid opportunity for swing traders!
💥 Entry:
✅ Any price level after confirmed breakout above the triangular moving average.
Patience = profits. Wait for confirmation to avoid fake moves.
🛑 Stop Loss:
This is the “Thief SL” @ 920.0 💀
⚠️ Note: Dear Ladies & Gentlemen (Thief OG’s) — adjust SL based on your strategy & risk appetite. Place it only after breakout confirmation, not before!
🎯 Target:
The moving average acts as a strong resistance zone, combined with overbought signals and potential trap activity.
Our target: @ 1120.0 💰
💬 Take profits smartly — your capital, your rules.
🧭 Related Pairs to Watch (Correlation Insight)
🔹 BINANCE:BTCUSDT – Bitcoin’s momentum drives most altcoin sentiment. A BTC breakout usually strengthens BNB bullish continuation.
🔹 BINANCE:ETHUSDT – Ethereum & Binance Coin often move in tandem within similar risk cycles; ETH strength confirms market-wide bullish tone.
🔹 BINANCE:SOLUSDT – Competes in smart-contract dominance; if SOL rallies, BNB tends to mirror short-term volatility shifts.
🔹 BINANCE:BNBBTC – Tracks BNB’s relative strength against BTC. Watch for BNB outperforming BTC — a hidden signal of accumulation by whales.
⚡ Key Points
Volume confirmation is crucial ⚙️
Wait for candle close above MA 🕒
Manage risk; don’t blindly copy setups 🚫
Follow the trend, not emotions 💭
🧠 Final Note:
This is not financial advice. Trade wisely, respect your plan, and remember — smart exits matter more than perfect entries.
🚀 Stay patient, stay sharp — Thief OG’s never chase, they calculate.

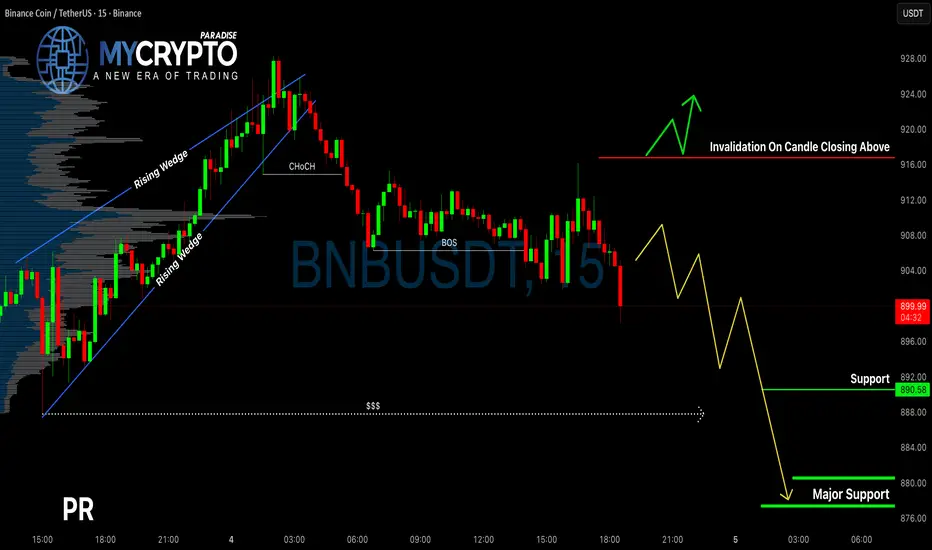
BNB Just Triggered a Breakdown, Are You Ready for the Next Move?Yello, Paradisers! Have you noticed how BNB quietly broke down from its rising wedge while most traders are still waiting for direction? This could be the early signal of a much deeper move—if you're not prepared, you might miss the whole thing.
💎BNBUSDT has officially broken down from a rising wedge formation—a pattern that typically signals a bearish reversal. What makes this even more significant is the clear bearish Change of Character (CHoCH) on the chart, which adds further confirmation that the trend may be shifting downward.
💎We’ve already seen a bearish Break of Structure (BoS), suggesting that downside momentum is building. However, instead of jumping in now, the higher-probability setup would be to wait for a pullback. Ideally, we want to see the price return to a more premium level, where we can then look for confirmation through a bearish candlestick pattern. That would give us a much better risk-to-reward entry point. Once confirmed, we’ll be targeting the next zones of liquidity and support lower on the chart.
💎That said, we always need to plan for the invalidation scenario. If price breaks above our invalidation level and closes a full candle above it, the current bearish thesis would no longer be valid. In that case, it’s best to step aside and wait for more reliable price action before taking any positions. Patience will protect your capital more than any indicator.
🎖Strive for consistency, not quick profits. Treat the market as a businessman, not as a gambler. The next few moves will separate those who follow their plan from those who trade emotionally. Stay sharp, Paradisers.
MyCryptoParadise
iFeel the success🌴
BNB/USD Market Levels: Multi-Buy Plan, Risk & Reward Defined📈 BNB/USD "Binance vs U.S Dollar" – Crypto Market Wealth Strategy Map (Swing/Day Trade)
🔥 Plan: Bullish bias confirmed with Hull MA pullback + Heikin Ashi bullish reversal candle spotted.
🎯 Entry (Thief Layering Style):
This strategy uses multiple limit orders (layer entries) instead of a single entry point. Example layers:
Buy Limit @ 980.0
Buy Limit @ 990.0
Buy Limit @ 1000.0
Buy Limit @ 1010.0
(You can expand layers higher/lower depending on your style).
🛑 Stop Loss (SL): Suggested at 960.0.
⚠️ Note to all Thief OG’s: This is my own risk level. You are free to adjust according to your money management.
💰 Target (TP):
Main target @ 1070.0 🚀
Strong resistance “Police Barricade” zone around 1100.0 (possible overbought trap).
⚠️ Note: Escape with profits before the trap. Again, it’s your call — you take the money when you make the money.
🔗 Related Pairs to Watch (Correlation Radar):
BITSTAMP:BTCUSD → BNB usually follows BTC momentum closely.
BITSTAMP:ETHUSD → ETH strength often fuels altcoin flows (including BNB).
COINBASE:SOLUSD → Competes with BNB in ecosystem growth; check relative performance.
BINANCE:BNBBTC → Strong ratio helps confirm if BNB is outperforming Bitcoin.
✨ “If you find value in my analysis, a 👍 and 🚀 boost is much appreciated — it helps me share more setups with the community!”
⚠️ Disclaimer: This is a Thief-style trading strategy, shared for educational & fun purposes only. Not financial advice. Trade at your own risk.
#BNBUSD #CryptoTrading #SwingTrade #DayTrade #LayeringStrategy #HullMA #HeikinAshi #Altcoins #BTC #ETH #SOL

BNB/USDT: Bullish Climb to 965?As the previous analysis worked exactly as predicted, BINANCE:BNBUSDT is gearing up for a bullish move on the 4-hour chart , with an entry zone between 859-868 near a key support and trendline.
First target at 930 marks initial resistance, while the second at 965 signals a potential breakout. Set a stop loss on a daily close below 840 to manage risk effectively. 🌟
A break above 875 with solid volume could trigger this climb, driven by BNB ecosystem news and market momentum. Watch BTC trends! 💡 Ready for this rise? Drop your take below! 👇
📝 Trade Plan:
✅ Entry Zone: 859 – 868 (support + trendline area)
❌ Stop Loss: Daily close below 840 to manage risk
🎯 Target 1: 930 (initial resistance)
🎯 Target 2: 965 (potential breakout zone)
Ready for this rise? Drop your take below! 👇

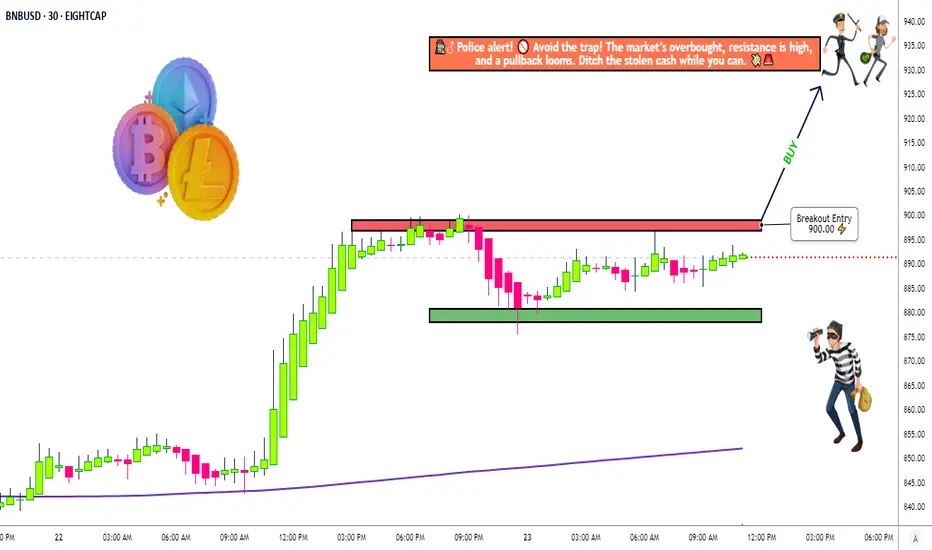
Binance Coin Robbery Setup – Bullish Layers or Police Trap?🚨💰 BNB/USD Crypto Market Grand Heist Plan 🎭🚨
🕵️♂️ Dear Thief OG’s & Market Robbers,
The vault door is open in BNB/USD “Binance Coin vs U.S Dollar” Crypto Market — today’s Day Trade Heist is about to begin! 🔥
📜 Master Plan
Direction: 📈 Bullish Robbery Mode Activated
Entry 🎯: Thief never knocks once — we layer entries at:
900.00 💵
890.00 💵
880.00 💵
👉 You can add more layers depending on how big your bag needs to be!
Stop Loss 🛑:
Thief SL is hidden at 870.00 — escape hatch ready!
⚠️ Adjust your SL based on your own strategy & risk appetite.
Target 🎯:
Police barricade spotted! 👮♂️💥
Our grand escape with the loot is at 930.00 — grab it before they catch you! 🚔💨
💡 Thief’s Strategy
We don’t enter all-in — we slice the entry with multiple limit orders (layering strategy style), just like cracking a safe piece by piece.
Patience, discipline, and precise timing = a clean heist. ⏱️🔓
⚠️ Trading Alert: Stay sharp — news releases & sudden volatility can trigger alarms. Always manage your positions and keep your stops in check!
💖 If this heist plan fuels your robbery spirit, hit the Boost Button 💥 and strengthen the Thief Army.
Together we rob the market daily with style, precision & profit. 🏆💪🤑
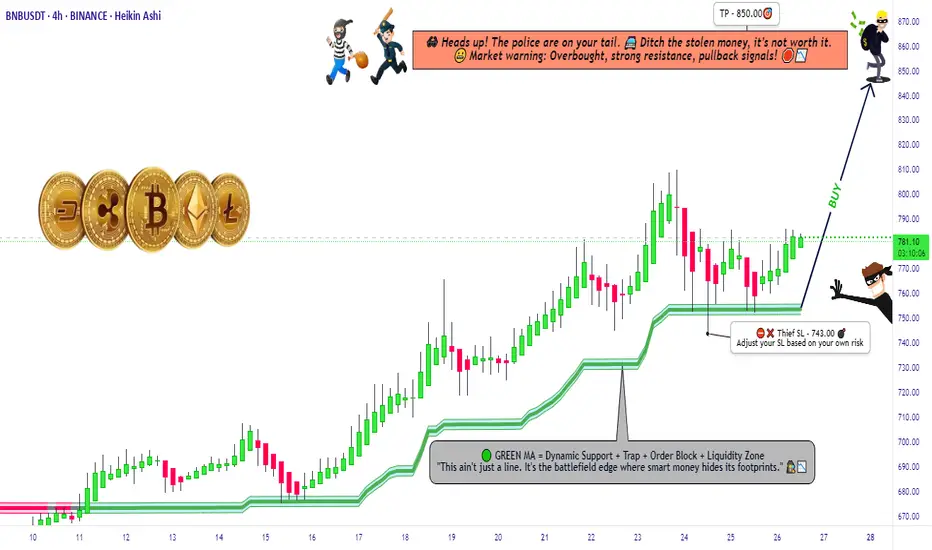
"BNB Primed for a Pump – Thief Trading Mode Activated!"🚨 BNB/USDT HEIST PLAN – SWIPE THE BULLISH LOOT BEFORE COPS ARRIVE! 🚨
🌟 Attention, Money Makers & Market Robbers! 🌟
(Hola! Oi! Bonjour! Hallo! Marhaba!)
The BNB/USDT vault is CRACKED OPEN—time to execute the ultimate heist! 🏦💰 Based on 🔥Thief Trading Style Analysis🔥, here’s your lucrative robbery blueprint for the Binance Coin vs. Tether market.
🔐 MASTER PLAN: LONG ENTRY HEIST (HIGH-RISK, HIGH-REWARD)
🎯 TARGET: 850.00 (or escape before the cops show up!)
🚨 POLICE TRAP ZONE: Overbought + Strong Resistance – Bears & cops are lurking!
💎 TAKE PROFIT EARLY & TREAT YOURSELF! (You’ve earned it, outlaw!)
⚔️ ENTRY STRATEGY: SWIPE FAST OR WAIT FOR THE PULLBACK!
🤑 VAULT IS OPEN! Enter any price if you’re bold (instant long).
🕵️♂️ SMART THIEVES: Use buy limit orders near 15M/30M swing lows/highs for a safer heist.
🛑 STOP-LOSS (ESCAPE ROUTE)
Thief SL: 743.00 (4H candle wick – adjust based on your risk tolerance!)
⚠️ WARNING: If the cops (bears) break in, DON’T HESITATE—RUN!
🎯 TARGETS & ESCAPE PATHS
Scalpers: Trail your SL & escape with quick loot! (Only long-side allowed!)
Swing Bandits: Hold strong but watch for police traps!
📡 MARKET INTEL (WHY THIS HEIST WILL WORK)
Bullish momentum in play! (But stay sharp—consolidation & reversals possible.)
Fundamentals, COT Reports, On-Chain Data, & Sentiment all hint at more upside!
🚨 TRADING ALERTS – DON’T GET CAUGHT!
📰 NEWS = VOLATILITY! Avoid new trades during major releases.
🔒 LOCK PROFITS! Use trailing stops to protect your stolen gains.
💥 BOOST THIS HEIST – STRENGTHEN THE SQUAD! 💥
🔥 Hit the LIKE & FOLLOW to support the robbery team!
🚀 More heists coming soon—STAY TUNED, OUTLAWS! 🚀
🎯 Trade Smart. Steal Big. Escape Faster. 🏴☠️
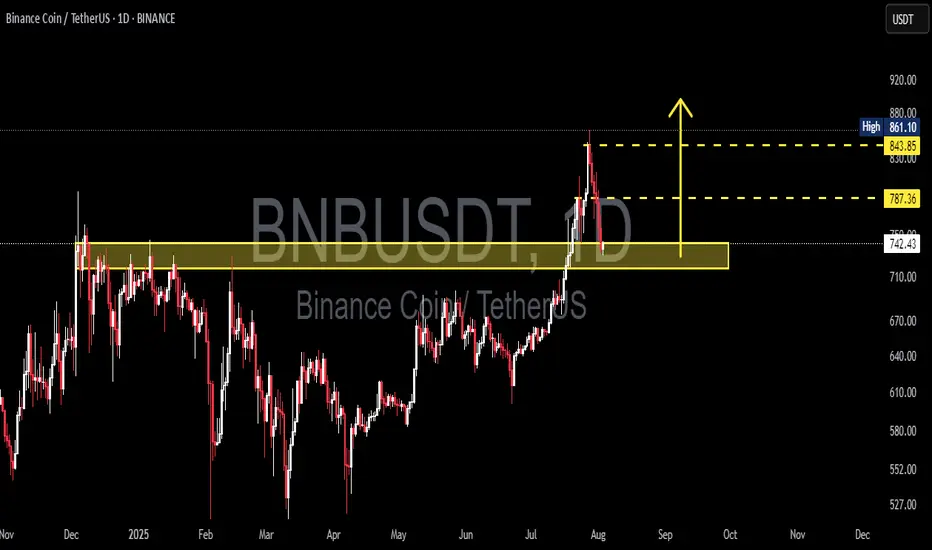
BNBUSDT Critical Retest in Progress📊 Comprehensive Analysis:
BNB/USDT has finally managed to break out of a major consolidation range that lasted over 6 months, with the key resistance zone between $730 and $750 acting as a strong ceiling since late 2024.
The breakout in late July 2025 was supported by a noticeable increase in volume, signaling strong accumulation and a possible shift from a ranging market to a bullish trend.
Now, the price is revisiting this previous resistance — a crucial retest zone that will likely determine whether this move is sustainable or a potential bull trap.
---
🔍 Key Price Levels Identified:
🟡 Retest Support Zone (Previous Resistance):
$730 – $750 → A critical area that must hold to maintain the bullish market structure.
🟡 Minor Resistance:
$787.36 → Recently rejected, this is the next short-term barrier that bulls must break.
🟡 Major Resistance (Swing High):
$843.85 → Key historical level before reaching the recent local high.
🔵 Recent Local High (Potential Double Top or Breakout):
$861.10 → A break above this level could open the doors to fresh highs.
---
✅ Bullish Scenario:
If BNB holds above the $742.36 level and prints a strong bullish reversal candle (e.g., pin bar or bullish engulfing), the retest can be considered successful.
Next upside targets:
🎯 $787.36 → Immediate resistance
🎯 $843.85 → Key swing high
🎯 $861.10 → Local high
🎯 $900 psychological level → If momentum and volume persist
Look for decreasing volume during retracement and surging volume on breakout to confirm bullish continuation.
---
❌ Bearish Scenario:
If the price fails to hold above $742.36 and breaks down below $730, this may confirm a false breakout (bull trap).
Downside targets could include:
⚠️ $710 – $690 → Minor demand zone
⚠️ $660 – $640 → Historical support within the previous range
A bearish confirmation would come from a lower high formation followed by a strong bearish breakdown candle with increasing volume.
---
📈 Chart Pattern & Price Structure:
The breakout indicates a bullish continuation pattern.
Potential formation of a Bullish Flag or an Ascending Channel, if support holds and consolidation continues above $740.
No major signs of distribution yet — the structure remains healthy and bullish.
---
🧠 Strategic Summary:
> The market has shown strong bullish intent, but it is now at a critical retest phase. Holding this zone could ignite the next leg up. Failure to do so, however, may signal a reversal or deeper correction.
For swing traders, the $730–$750 zone is a golden pocket for potential entries with tight risk management. For conservative traders, a confirmed breakout above $787–$843 offers a safer opportunity.
#BNBUSDT #BNBAnalysis #CryptoBreakout #Altcoins #TechnicalAnalysis #PriceAction #SupportResistance #BullishScenario #BearishScenario #CryptoTrading #BinanceCoin #SwingTrading
Is BNB About to Explode—or About to Collapse?Yello Paradisers! Could this be the beginning of the next BNB rally, or just another classic trap to liquidate early longs before the real move begins? Let’s dive into this high-probability setup before it’s too late.
💎BNBUSDT is currently showing good signs of bullish continuation. The price has successfully broken out of a descending channel and performed a precise retest of that structure—an early confirmation of strength. Following this, we’ve seen a strong reaction from a Fair Value Gap (FVG) and the 200 EMA, both of which align perfectly with the inducement taken just before the bounce. This confluence of technical signals significantly increases the probability of a sustained bullish move in the near term.
💎If price pulls back from current levels, it could offer us a more attractive risk-to-reward opportunity for long entries. Traders who are targeting higher RR ratios, such as 1:2 or beyond, may prefer to wait for a deeper pullback into our predefined support zone for a cleaner entry. This zone remains critical for maintaining our bullish bias.
💎However, if the price breaks down and we see a full candle close below that support zone, the entire bullish scenario becomes invalid. In such a case, it would be more prudent to stay on the sidelines and wait for a clearer and more favorable price action setup to emerge before jumping back in.
We are playing it safe right now. If you want to be consistently profitable, you need to be extremely patient and always wait only for the best, highest probability trading opportunities.
MyCryptoParadise
iFeel the success🌴

BNBUSDT sell/shortBy utilizing levels, historical patterns, , we can formulate a hypothesis that the market might follow a similar trajectory if bearish sentiment prevails.

BNB/USD "Binance Coin vs U.S Dollar" Crypto Market Heist Plan🌟Hi! Hola! Ola! Bonjour! Hallo! Marhaba!🌟
⚔Dear Money Makers & Thieves, 🤑 💰✈️
Based on 🔥Thief Trading style technical and fundamental analysis🔥, here is our master plan to heist the BNB/USD "Binance Coin vs U.S Dollar" Crypto market. Please adhere to the strategy I've outlined in the chart, which emphasizes long entry. Our aim is the high-risk Red Zone. Risky level, overbought market, consolidation, trend reversal, trap at the level where traders and bearish robbers are stronger. 🏆💸Book Profits wealthy and safe trade.💪🏆🎉
Entry 📈 : "The heist is on! Wait for the breakout (640) then make your move - Bullish profits await!"
however I advise to Place buy limit orders within a 15 or 30 minute timeframe most recent or swing, low or high level.
📌I strongly advise you to set an alert on your chart so you can see when the breakout entry occurs.
Stop Loss 🛑:
Thief SL placed at the recent/swing low or high level Using the 4H timeframe (570) swing trade basis.
SL is based on your risk of the trade, lot size and how many multiple orders you have to take.
🏴☠️Target 🎯: 750 (or) Escape Before the Target
🧲Scalpers, take note 👀 : only scalp on the Long side. If you have loot a lot of money, you can go straight away; if not, you can join swing traders and carry out the robbery plan. Use trailing SL to safeguard your money 💰.
BNB/USD "Binance Coin vs U.S Dollar" Crypto Market is currently experiencing a bullish trend,., driven by several key factors.
📰🗞️Get & Read the Fundamental, Macro Economics, COT Report, On-Chain Analysis, Sentimental Outlook, Future Trend Move:
Before start the heist plan read it.👉👉👉
📌Keep in mind that these factors can change rapidly, and it's essential to stay up-to-date with market developments and adjust your analysis accordingly.
⚠️Trading Alert : News Releases and Position Management 📰 🗞️ 🚫🚏
As a reminder, news releases can have a significant impact on market prices and volatility. To minimize potential losses and protect your running positions,
we recommend the following:
Avoid taking new trades during news releases
Use trailing stop-loss orders to protect your running positions and lock in profits
💖Supporting our robbery plan 💥Hit the Boost Button💥 will enable us to effortlessly make and steal money 💰💵. Boost the strength of our robbery team. Every day in this market make money with ease by using the Thief Trading Style.🏆💪🤝❤️🎉🚀
I'll see you soon with another heist plan, so stay tuned 🤑🐱👤🤗🤩

5 Key Coins: Is There Life After Bitcoin’s Correction?On the image, we can see that from December 2024 to the current moment (February 2025), the price of BYBIT:BTCUSDT.P has decreased from about 107,673 to 96,150 dollars. In other words, roughly speaking, this is about a 10–11% correction. For Bitcoin, given its historical volatility, this is a fairly acceptable movement.
🔥 What’s important to consider with such a price change:
If we look at the chart from October 2024 (or even earlier), we can understand whether there was a prolonged rise before this (which could have required a correction), or if we are seeing a deeper downward movement.
🔥 Support and Resistance Levels
On the provided screenshot, it is noticeable that the current price is slightly below the key volume level (POC). If the price settles below it, this can become an additional signal for a continued decline.
However, if BYBIT:BTCUSDT.P returns to the POC level and breaks it from below, it is often considered a sign of a possible reversal or at least a short-term bullish rebound.
🔥 Volume Profile Indicators
POC (Point of Control) around 100,000–101,000 dollars indicates that the largest trading volumes for the entire visible period are concentrated there.
This is a level around which the price may “hover,” since historically there is a large number of trades, meaning strong interests from both buyers and sellers.
🎯 Key idea: For most of the altcoins presented in the review, the further movement depends on whether BYBIT:BTCUSDT.P holds above the nearest support and whether it can overcome the nearest resistance (the POC zone on the chart).
Below is a structured analysis of five selected coins ( BYBIT:ADAUSDT.P , BYBIT:SOLUSDT.P , BYBIT:XRPUSDT.P , BYBIT:BNBUSDT.P , BYBIT:ETHUSDT.P ) taking into account the current behavior of #Bitcoin, since it often sets the tone for the entire market.
━━━━━━━━━━━━━━━━━━━━━━
📉 Cardano BYBIT:ADAUSDT.P
➡️ POC on the chart: 0.9684 USD (above the current price).
➡️ Chart structure: BYBIT:ADAUSDT.P recently tested the support level around 0.80–0.88 USD.
Scenarios:
🚀 Bullish (if BYBIT:BTCUSDT.P recovers): a possible rise to the 0.95–1.00 USD zone.
If this zone is broken and the price consolidates above 1.00 USD, further growth up to 1.10–1.20 USD can be expected.
🚀 Bearish (if BYBIT:BTCUSDT.P continues to fall): a retest of 0.80–0.85 USD and, if broken, a deeper correction down to 0.70–0.75 USD.
⚡ Trading idea:
For those considering purchases, it makes sense to wait either for confirmation of a reversal in BYBIT:BTCUSDT.P or for a breakout/consolidation above 0.95–1.00 USD.
Alternatively , place limit orders around 0.80–0.85 USD, provided that BYBIT:BTCUSDT.P does not go into an even deeper correction.
━━━━━━━━━━━━━━━━━━━━━━
📉 Solana BYBIT:SOLUSDT.P
POC on the chart: 190.53 USD (approximately coincides with the current level).
Chart structure: After falling from 280 USD, BYBIT:SOLUSDT.P dropped to the key 18–19 USD zone. Here lies the volume level (POC), which can act as a “magnet”—the price often “moves” around the POC, and if it falls below it, the POC becomes strong resistance.
Scenarios:
🚀 Bullish: with BYBIT:BTCUSDT.P rising and BYBIT:SOLUSDT.P confidently holding above 19–20 USD, a return to 22–23 USD is possible. A breakout above 23–25 USD would be a signal for further recovery (26–28 USD and beyond).
🚀 Bearish: if BYBIT:BTCUSDT.P continues to fall, BYBIT:SOLUSDT.P could drop below 18 USD and test the 15–16 USD zone, where buyers previously showed interest.
⚡ Trading idea:
Watch the behavior in the 18–20 USD zone. A breakout upward and consolidation amid a rising BYBIT:BTCUSDT.P may provide a quick target of 22–23 USD.
In a bearish scenario, it makes sense to see how the price reacts at 15–16 USD—a possible buyback zone for medium-term positions.
━━━━━━━━━━━━━━━━━━━━━━
📉 XRP BYBIT:XRPUSDT.P
POC: ~0.54–0.55 USD (above the current price).
Chart structure: BYBIT:XRPUSDT.P is in a fairly wide range: resistance at 0.45–0.50 USD and support around 0.35 USD. The volumes, judging by the profile, are concentrated above current quotes, which may indicate the need for an additional impulse for growth.
Scenarios:
🚀 Bullish: with positive market movement and BYBIT:BTCUSDT.P , BYBIT:XRPUSDT.P may test 0.45–0.50 USD. If it manages to consolidate above 0.50 USD, the path to 0.55–0.60 USD opens up.
🚀 Bearish: if the correction of BYBIT:BTCUSDT.P continues, BYBIT:XRPUSDT.P may drop back to 0.35 USD, and in case of a strong market sell-off—even to around 0.30 USD.
⚡ Trading idea:
For long-term positions, many focus on the resolution of legal issues (SEC vs Ripple), so the fundamental background plays a role.
Technically, the 0.35 USD zone is of interest for purchases, as well as a breakout of 0.45–0.50 USD for aggressive trading in anticipation of a faster rise.
━━━━━━━━━━━━━━━━━━━━━━
📉 Binance Coin BYBIT:BNBUSDT.P
POC: ~710 USD (noticeably above the current price).
Chart structure: BYBIT:BNBUSDT.P is generally supported by the Binance ecosystem, but it also declines with the global market downturn. The chart shows several horizontal levels in the 600–650 USD range that can act as trading zones.
Scenarios:
🚀 Bullish: if the market recovers, BNB can quickly return to 650–670 USD. A breakout and consolidation above 700 USD opens the way to 730 USD and beyond.
🚀 Bearish: if BYBIT:BTCUSDT.P falls, a pullback to around 580–600 USD is possible. In the case of a strong sell-off—an even deeper move toward 550 USD.
⚡ Trading idea:
BYBIT:BNBUSDT.P often shows relative “resilience” due to its high demand on the Binance exchange (trading pairs, staking, Launchpad, etc.).
Technically, 600 USD is an interesting key support level. For a short-term long, a breakout and consolidation above 650–670 USD is needed.
━━━━━━━━━━━━━━━━━━━━━━
📉 Ethereum BYBIT:ETHUSDT.P
POC: around 3,100 USD (above current levels).
Chart structure: BYBIT:ETHUSDT.P is in the 2,400–2,700 USD range. For a bullish scenario, it is important to get back above 2,800 USD, which would open the potential to 3,000–3,100 USD.
Scenarios:
🚀 Bullish: if BYBIT:BTCUSDT.P grows and the news background is positive (network development, DeFi, Layer2), BYBIT:ETHUSDT.P can quickly recover to 2,800–3,000 USD.
🚀 Bearish: if BYBIT:BTCUSDT.P moves negatively—correction to 2,400 USD, and in the case of a strong sell-off—a test of 2,200 USD.
⚡ Trading idea:
BYBIT:ETHUSDT.P is closely tied to the fundamentals of the DeFi and Layer2 ecosystem, so in addition to BYBIT:BTCUSDT.P dynamics, it is important to monitor network updates and overall market sentiment.
━━━━━━━━━━━━━━━━━━━━━━
📢 Correlation with BYBIT:BTCUSDT.P : All of the mentioned altcoins ( BYBIT:ADAUSDT.P , BYBIT:SOLUSDT.P , BYBIT:XRPUSDT.P , BYBIT:BNBUSDT.P , BYBIT:ETHUSDT.P ) continue to closely correlate with Bitcoin’s movement. If BYBIT:BTCUSDT.P manages to hold current support and break above the nearest resistance, there is a high likelihood that the alts will bounce in unison.
📢 Volume levels: All the coins have their POC above current prices, which often means that for a confident rise, the price needs to move back above the “point of control” in the volume profile. While the price remains below the POC, there is a risk of further stagnation or decline.
📢 Support zones:
📉 BYBIT:ADAUSDT.P 0.80–0.85 USD
📉 BYBIT:SOLUSDT.P 15–16 USD
📉 BYBIT:XRPUSDT.P 0.35 USD
📉 BYBIT:BNBUSDT.P 600 USD (then 580–550 USD)
📉 BYBIT:ETHUSDT.P 2,400 USD (then 2,200 USD)
📢 Points of interest for long positions:
Breakout and consolidation above the POC or key horizontal resistances.
Testing support zones (if there are reversal signals).
📢 Risk management:
Due to high volatility, it is important to set stop-losses and consider the possibility of false breakouts. If BYBIT:BTCUSDT.P experiences a stronger decline, it is not advisable to try to “ride out” a strong downtrend in altcoins without a clear plan.
📢 In the short term, the market is in a waiting mode—monitoring whether BYBIT:BTCUSDT.P can recover and hold above the nearest resistances.
In the medium term, fundamentals (project development, legal news for BYBIT:XRPUSDT.P , updates for BYBIT:ETHUSDT.P , etc.) will play a decisive role, but without positive movement from BYBIT:BTCUSDT.P , strong growth in alts usually does not occur.
Use these levels and scenarios as guidelines for your own strategy, complementing them with fundamental analysis and news.
Good luck, friends. Follow our forecasts, leave comments, let’s stay in touch!

BNBUSDT 1WBNB Update ~ 1W
#BNB Don't miss this trade,. Buy gradually on this support Block zone
#BNB If you still have Conviction on this coin. This support block would be a very good buying place for now,. It's only a matter of time for this coin to make a new high.

BNBUSDT 1WBNB ~ 1W
#BNB If you still have Conviction on this coin. This support block would be a very good buying place for now,. It's only a matter of time for this coin to make a new high.

BNBUSDT ready to BREAKOUTThe market has been in consolidation phase.
Overall the market is puhsing higher.
The current consolidation is a just a bus stop before breakout.

BNBUSDTBNB analysis
Weekly and 12-hour timeframe
I expect the price to move towards higher targets after the correction to the 12-hour supply area. If I lose the 12-hour demand area, I expect the price to return from the weekly demand area.

BNBUSD 1DBNB ~ Updated
#BNB The retest of the support line of this pattern has been successful.
Rocket Takes Off Soon


BNBUSDT long Potential trajectory towards 661.5, there is also a retest. In the meantime, a strong bullish candl

BNBUSD 1DBNB ~ Updated
#BNB Finally managed to break the resistance line of this pattern, A retest is expected from here, to continue the rise.

BNB Holders! FOLLOW ME~!What 's up?! My friends!
This is BNBUSDT chart.
After breaking the GREEN downtrend line, It is currently keeps it.
If it keeps the GREEN downtrend line, It will reach the RED uptrend line.
* It's also worth looking forward to the rise due to the FLAG pattern.

BNBUSDT Elliott Waves Analysis (Investment idea)Hello friends.
Please support my work by clicking the LIKE button👍(If you liked). Also i will appreciate for ur activity. Thank you!
Everything on the chart.
Closest target: 350 - 460 - 570
Main(investment) target zone: 850 - 1200$
Cancellation of setup - decreasing under 185.
RR: 1 to ~18
Stop loss must be necessarily, we have gap in 50-150$ zone, sooner or later we will get there.
risk is justified
Good luck everyone!
Follow me on TRADINGView, if you don't want to miss my next analysis or signals.
It's not financial advice.
Dont Forget, always make your own research before to trade my ideas!
Open to any questions and suggestions
