BNB Bulls Near Breakout: Reversal Pattern Emerges
Yello, Paradisers, is this the turning point for BNB? After the recent brutal drop, signs of a powerful reversal are emerging, and what we’re seeing now could trap late sellers in a dangerous spot.
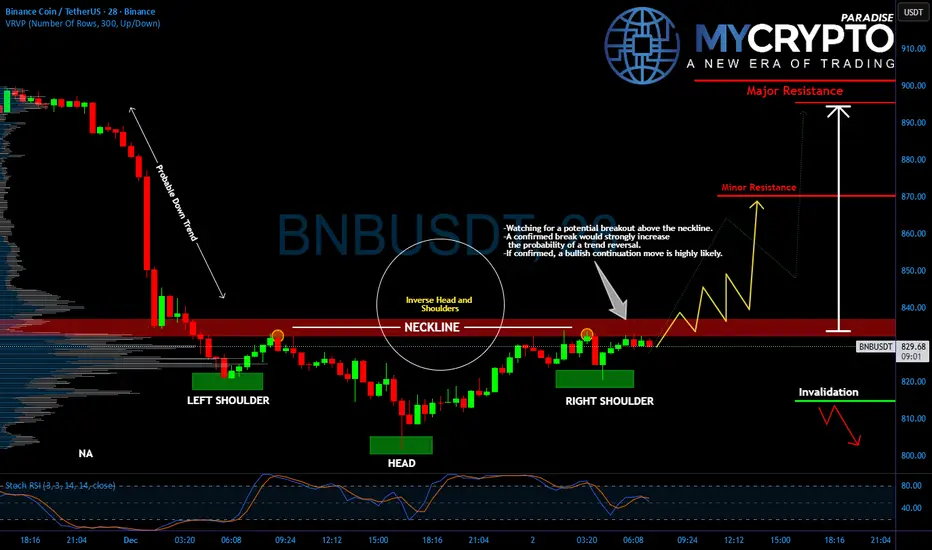
💎#BNBUSDT has formed a textbook inverse head and shoulders pattern, signaling a potential bullish reversal after a steep downtrend. The neckline around the $834–$836 level has become a critical zone to watch. Price is currently testing this area, and a confirmed breakout above it could trigger a strong continuation move.
💎This structure forms after a sharp downtrend and often acts as a springboard for upside momentum when confirmed. If #BNB manages to break and hold above the neckline with volume, the next target lies near $870, minor resistance, with the $890–$900 zone acting as major resistance.
💎However, if bulls fail to break out and the price gets rejected from the neckline again, we could see a retracement back toward the $810 invalidation level, which would weaken the reversal setup and put short-term downside back in play.
💎The Stochastic RSI is also approaching overbought territory, suggesting bulls need to act quickly before momentum fades. Volume confirmation remains key here.
Stay sharp, the setup is clean, but it’s also a classic trap zone.
MyCryptoParadise
iFeel the success🌴
Bnbusdtlong
BNB/USDT 1H AnalysisHi
After a prolonged downtrend, BNB has broken its descending trendline, signaling a shift from bearish to bullish momentum. The price formed a symmetrical triangle pattern, completing at point D, which coincides with the lower boundary of the rising channel. Since then, BNB has been trading inside a clearly defined ascending channel, respecting both support and resistance levels.
Recently, a bullish flag has formed, representing a consolidation after a strong upward impulse. A breakout from this flag suggests continuation towards the upper channel boundary near $940–950. Support lies around $880, aligning with both the flag’s lower boundary and the channel’s midline.

BNB - Optimistic outlookIn my view, BNB looks more than optimistic.
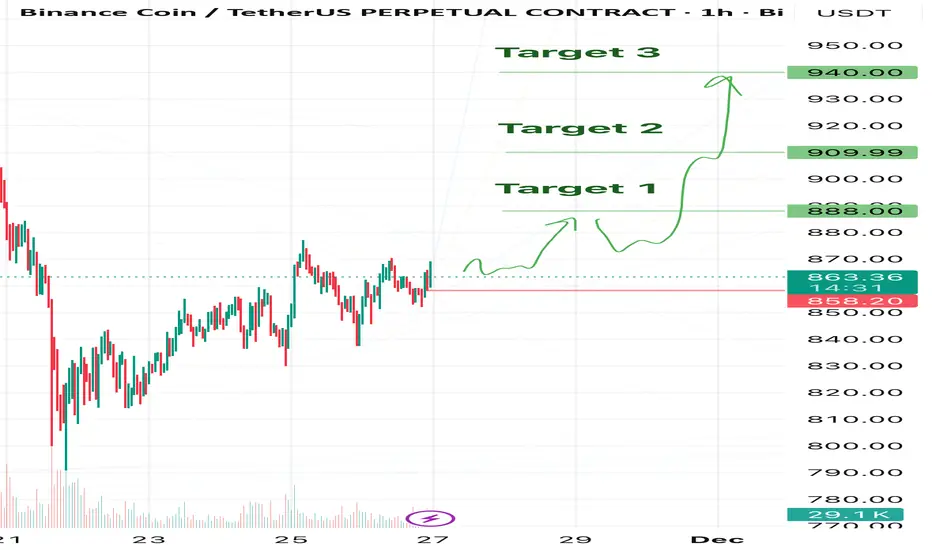
I believe we can see this coin at 900 and higher in the foreseeable future.
But we might currently be in a correction (possibly an ABC) after the previous drop, so we keep our hand on the pulse. As always — mandatory stops, no exceptions!
My current targets:
🎯 Target 1 — $888
🎯 Target 2 — $910
🎯 Target 3 — $940
❌Invalidation level: $858.2
A clear break and close below this zone cancels the bullish scenario for me.
Long bias remains as long as we hold above 858.2.
Trade safe and see you at the targets! 🚀
$BNB Eyes Rebound on U.S. Shutdown End and Rate Cuts PotentialBNB Chain’s native token, BNB, slipped below the $1,000 mark in the past 24 hours, dropping to lows near $974 amid a surge in trading volume nearly 88% above its daily average. The move signals short-term bearish sentiment as traders react to broader crypto market weakness.
However, macro fundamentals could soon favor a rebound. With the U.S. government shutdown reportedly nearing resolution and investors widely anticipating a Federal Reserve rate cut in December, liquidity conditions are expected to improve. Lower interest rates typically reduce the cost of capital, boosting investor appetite for risk assets like cryptocurrencies. As liquidity flows back into the market, altcoins such as BNB may see renewed buying pressure.
Technically, BNB broke out of a long-term ascending channel despite the recent sell-off. The $950–$970 zone is acting as a strong support area, acting as a retest to the break-out of the ascending channel. A sustained support of this level could set the stage for a rebound toward $1,375 previous high, the next major resistance and prior high. Conversely, a breakdown and a candle close below $900 could open the door to deeper losses near $900 or lower.
Analysts remain divided. “Short-term volatility doesn’t shake BNB’s fundamentals,” said Jake A. from AIC Labs. “As long as on-chain activity and ecosystem growth continue, the long-term picture remains intact.”
In summary, while BNB faces immediate technical resistance at $1,000, easing macro pressures and a confirmed support base could ignite the next rally toward $1,375 as traders position for a more dovish Fed.

BNB/USDT Setup – Will the Moving Average Confirm the Bull Move?💎 BNB/USDT – "BINANCE COIN VS TETHER" 💰
Crypto Market Opportunity Blueprint (Swing Trade)
📈 Plan: BULLISH
After a period of compression within a triangular structure, BNB is preparing for a potential breakout. The breakout above the triangular moving average could trigger a new bullish wave — offering a solid opportunity for swing traders!
💥 Entry:
✅ Any price level after confirmed breakout above the triangular moving average.
Patience = profits. Wait for confirmation to avoid fake moves.
🛑 Stop Loss:
This is the “Thief SL” @ 920.0 💀
⚠️ Note: Dear Ladies & Gentlemen (Thief OG’s) — adjust SL based on your strategy & risk appetite. Place it only after breakout confirmation, not before!
🎯 Target:
The moving average acts as a strong resistance zone, combined with overbought signals and potential trap activity.
Our target: @ 1120.0 💰
💬 Take profits smartly — your capital, your rules.
🧭 Related Pairs to Watch (Correlation Insight)
🔹 BINANCE:BTCUSDT – Bitcoin’s momentum drives most altcoin sentiment. A BTC breakout usually strengthens BNB bullish continuation.
🔹 BINANCE:ETHUSDT – Ethereum & Binance Coin often move in tandem within similar risk cycles; ETH strength confirms market-wide bullish tone.
🔹 BINANCE:SOLUSDT – Competes in smart-contract dominance; if SOL rallies, BNB tends to mirror short-term volatility shifts.
🔹 BINANCE:BNBBTC – Tracks BNB’s relative strength against BTC. Watch for BNB outperforming BTC — a hidden signal of accumulation by whales.
⚡ Key Points
Volume confirmation is crucial ⚙️
Wait for candle close above MA 🕒
Manage risk; don’t blindly copy setups 🚫
Follow the trend, not emotions 💭
🧠 Final Note:
This is not financial advice. Trade wisely, respect your plan, and remember — smart exits matter more than perfect entries.
🚀 Stay patient, stay sharp — Thief OG’s never chase, they calculate.

BNB: Inverse Head & Shoulders & Rising Channel StructureHi!
BNB has completed a clear inverse Head & Shoulders pattern at the bottom, with the neckline successfully reclaimed. After the breakout, the price is now moving inside a well-defined rising channel, showing steady bullish momentum.
The market has pulled back toward the midline of the channel, which lines up with previous neckline structure. If this support holds, the next leg higher remains the primary scenario.
Your projection highlights two key points:
A potential higher low forming inside the channel
Continuation toward the 1,031 resistance, with room for an extension toward the top of the channel
As long as the price respects the ascending structure and stays above the neckline/green zone, the bullish outlook remains intact.

#BNBUSDT: Targeting 1450, One Swing Entry And Target**BINANCE:BNBUSDT**
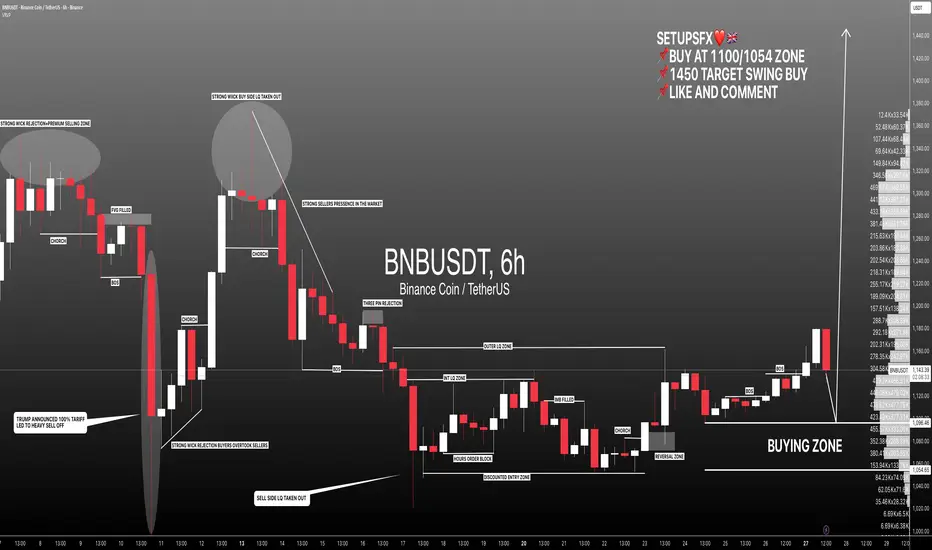
Buyers still have control in the market in the daily time frame. However, there is still sellers’ pressure for the short term which is favourable. We want the price to reach our buying zone and move sharply upwards.
This is possible as there is major news coming up this week on Friday which is the Non-Farm Payroll (NFP) data. This economic data will influence the crypto market and other financial instruments.
Our target is to swing buy and close the position at 1450. However, the final closing price is at your discretion.
If you find our work helpful please like and comment.
Team Setupsfx_
BNB/USD Market Levels: Multi-Buy Plan, Risk & Reward Defined📈 BNB/USD "Binance vs U.S Dollar" – Crypto Market Wealth Strategy Map (Swing/Day Trade)
🔥 Plan: Bullish bias confirmed with Hull MA pullback + Heikin Ashi bullish reversal candle spotted.
🎯 Entry (Thief Layering Style):
This strategy uses multiple limit orders (layer entries) instead of a single entry point. Example layers:
Buy Limit @ 980.0
Buy Limit @ 990.0
Buy Limit @ 1000.0
Buy Limit @ 1010.0
(You can expand layers higher/lower depending on your style).
🛑 Stop Loss (SL): Suggested at 960.0.
⚠️ Note to all Thief OG’s: This is my own risk level. You are free to adjust according to your money management.
💰 Target (TP):
Main target @ 1070.0 🚀
Strong resistance “Police Barricade” zone around 1100.0 (possible overbought trap).
⚠️ Note: Escape with profits before the trap. Again, it’s your call — you take the money when you make the money.
🔗 Related Pairs to Watch (Correlation Radar):
BITSTAMP:BTCUSD → BNB usually follows BTC momentum closely.
BITSTAMP:ETHUSD → ETH strength often fuels altcoin flows (including BNB).
COINBASE:SOLUSD → Competes with BNB in ecosystem growth; check relative performance.
BINANCE:BNBBTC → Strong ratio helps confirm if BNB is outperforming Bitcoin.
✨ “If you find value in my analysis, a 👍 and 🚀 boost is much appreciated — it helps me share more setups with the community!”
⚠️ Disclaimer: This is a Thief-style trading strategy, shared for educational & fun purposes only. Not financial advice. Trade at your own risk.
#BNBUSD #CryptoTrading #SwingTrade #DayTrade #LayeringStrategy #HullMA #HeikinAshi #Altcoins #BTC #ETH #SOL

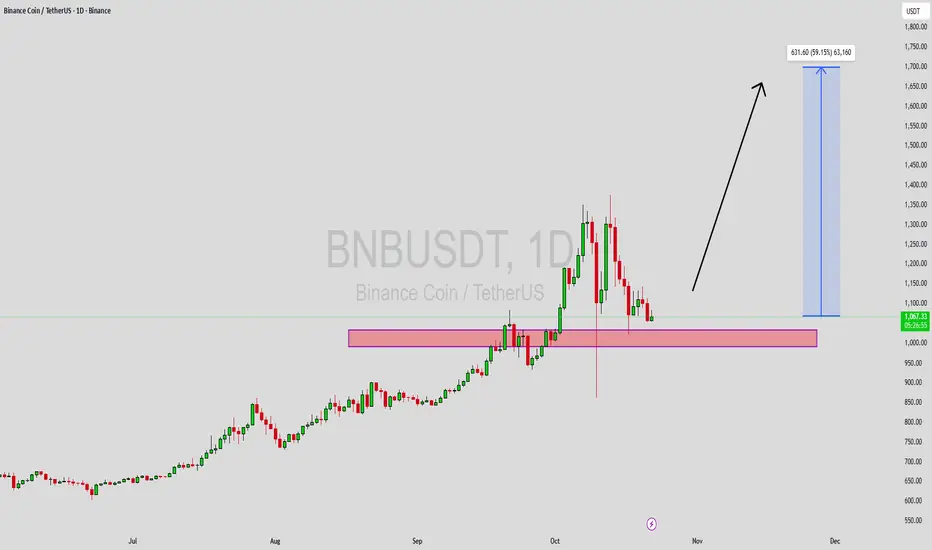
BNNBUSDT Forming Bullish MomentumBNBUSDT is showing signs of strong bullish momentum, forming a classic bullish wave pattern on the chart. This pattern typically indicates the continuation of an upward trend following a period of consolidation. The recent increase in trading volume supports the potential for another bullish leg as buyers continue to accumulate at current price levels. BNB, being a leading asset in the crypto market, often acts as a barometer for overall investor confidence, and the latest structure suggests renewed optimism among traders.
With an expected gain of 50% to 60%+, BNBUSDT could be preparing for a significant upside move if key resistance levels are broken. The formation of higher lows and sustained volume inflows indicate that market participants are positioning for potential breakout opportunities. Technical indicators such as momentum oscillators and moving averages are aligning with this bullish setup, providing further confirmation that BNB may continue to strengthen against USDT.
Investor interest in Binance Coin remains high as the project continues to play a central role in the broader crypto ecosystem. This ongoing engagement from traders and institutions provides fundamental support to the bullish technical outlook. If momentum continues to build, BNB could enter a new phase of price expansion, attracting more attention from both short-term traders and long-term investors.
✅ Show your support by hitting the like button and
✅ Leaving a comment below! (What is You opinion about this Coin)
Your feedback and engagement keep me inspired to share more insightful market analysis with you!
BNBUSDTCRYPTOCAP:BNB has big long momentum. but stoped this level between 1000$ to 1500$. We can buy again if breakout 1100$ and should kept trend above this level.

BNBUSDTBINANCE:BNBUSDT is Bull-trend and we may buyer in any correction.
Best support: Now level - 1150 - 1075 - 975
Seve profit in levels: 1275 - 1350 - 1400
P;ease control Risk management.⚠️

BNB/USD – Testing Patience Below the 200-SMA📈 Bias: NEUTRAL (reversal watch)
BNB trades around $1,186, consolidating after last week’s sharp pullback. Price remains capped under the 200-SMA ($1,238), suggesting the trend is still under pressure but flattening.
RSI near 46 shows recovering momentum. If bulls reclaim $1,223–$1,238, a shift to bullish bias is likely; failure to hold $1,178 opens the door to $1,145 support retest.
📊 Key Levels:
Resistance: $1,223 / $1,238
Support: $1,178 / $1,145

BNB; ATHHello friends
Given the recent growth we have had, the price has formed a double top pattern and is in the specified support areas, we can expect the price to be supported until the specified targets.
*Trade safely with us*

BNB/USDT: Bullish Breakout from H&S and Pennant FormationHi guys!
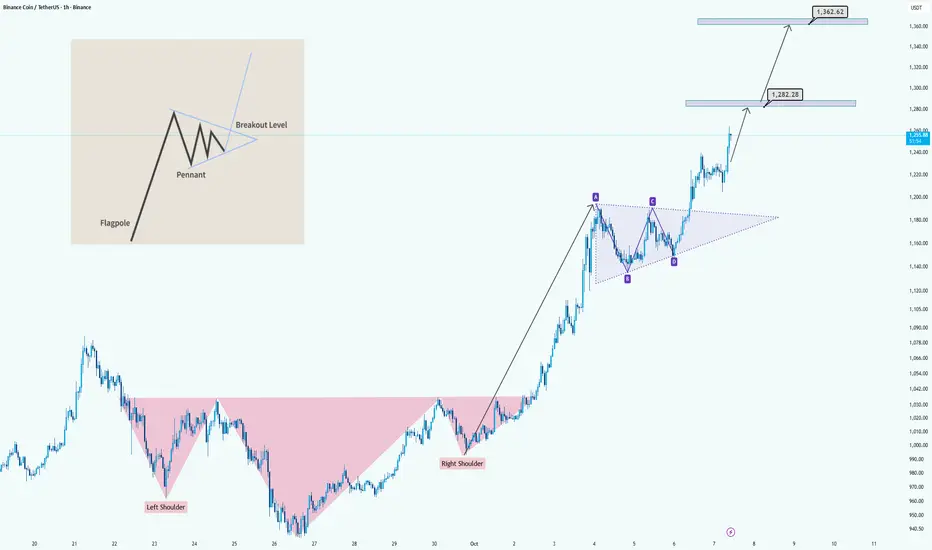
The chart clearly shows a bullish structure forming after a strong upward move. Initially, the price completed an Inverse Head and Shoulders pattern , signaling a potential trend reversal from bearish to bullish. After the breakout above the neckline, the market continued to climb and started consolidating into a bullish pennant pattern , a continuation setup that typically follows a sharp rally (flagpole).
The pennant breakout confirms renewed bullish momentum, suggesting the next leg higher is underway. Based on the flagpole projection, the measured targets are around $1,282 for the first resistance zone and $1,362 as the extended upside target.
In summary:
Patterns identified: Inverse Head and Shoulders + Bullish Pennant
Trend direction: Bullish continuation
Targets: $1,282 and $1,362
Outlook: Positive as long as price holds above the pennant breakout level
BNB Soars Above Key SupportLooking at this $BNB/USDT chart, here's a more concise breakdown:
Rising Support: The red line shows a strong support level that has held up since 2018, with the price bouncing off it several times, confirming its importance.
Accumulation Zone: Between 2020 and 2021, BNB traded sideways, building up buying pressure before the next move.
Breakout: After the accumulation phase, BNB broke out sharply, signaling the start of a strong upward trend.
Current Trend: The price is now above the rising support line, and the bullish momentum seems to be continuing, suggesting further potential upside.
In short , BNB is in a solid uptrend, with a key support line holding strong. The breakout indicates more gains ahead if the trend continues.

BINANCE HIGH PROBABILITY SETUP SOON!!!🚨 BINANCE HIGH PROBABILITY BUY SETUP 🚨
* Here We Can See Clearly The Next Potential Move For BNBUSD Coming Hours/Days.
* Keep Your Eyes Close On Your Trading Positions.
* Happy PIP Hunting Traders.
FXKILLA.

$BNB is holding near $968 with solid momentum, but ? CRYPTOCAP:BNB is holding near $968 with solid momentum, but I expect a healthy dip toward the $710–550 support zone before the next big move. That’s the area I’ll be looking to load, with eyes on a breakout toward $1,200+.
BNB CAN MAKE A NEW ATHi think BINANCE:BNBUSDT still bullish and can make a new ATH in the next Hours . i don't know how far it can reach but a new ATH is in plan!
best entry point can be in 4H FVG

BNB/USDT: Bullish Climb to 965?As the previous analysis worked exactly as predicted, BINANCE:BNBUSDT is gearing up for a bullish move on the 4-hour chart , with an entry zone between 859-868 near a key support and trendline.
First target at 930 marks initial resistance, while the second at 965 signals a potential breakout. Set a stop loss on a daily close below 840 to manage risk effectively. 🌟
A break above 875 with solid volume could trigger this climb, driven by BNB ecosystem news and market momentum. Watch BTC trends! 💡 Ready for this rise? Drop your take below! 👇
📝 Trade Plan:
✅ Entry Zone: 859 – 868 (support + trendline area)
❌ Stop Loss: Daily close below 840 to manage risk
🎯 Target 1: 930 (initial resistance)
🎯 Target 2: 965 (potential breakout zone)
Ready for this rise? Drop your take below! 👇

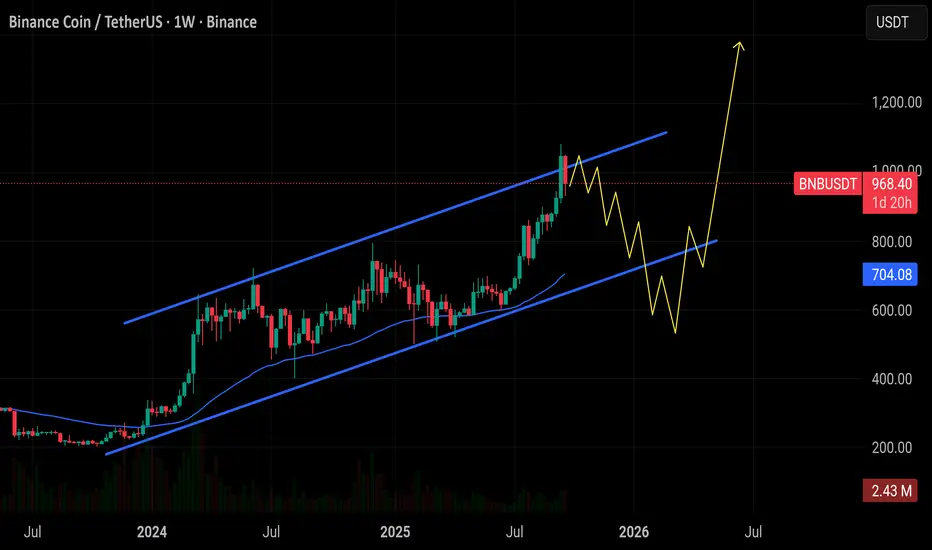
BNB WEEKLYHello friends🙌
🔊We are here with BNB analysis:
A long-term analysis that can be viewed as an investment, but in the long term, with patience and capital management...
You can see that after weeks of price suffering, a good upward move has now been formed by buyers, which has also caused a new ceiling to be set. Considering the market decline and the decline of most currencies, you can see that BNB is well supported and its price has suffered.
⚠Now, with the arrival of buyers, you can enter a long-term buy trade with capital management.
🔥Follow us for more signals🔥
*Trade safely with us*

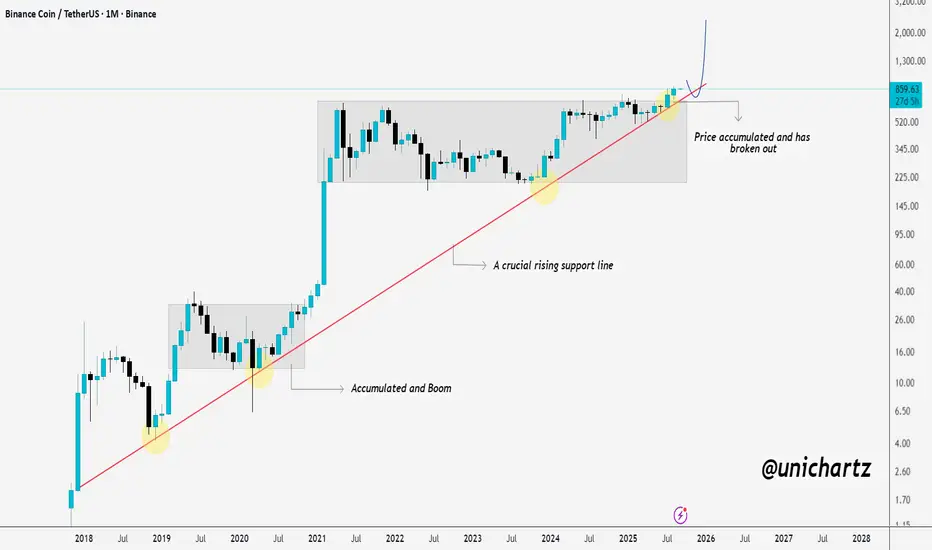
$BNB could move 80% from here - the key levels to watch BNB/USDT Monthly Analysis
CRYPTOCAP:BNB has been respecting a strong rising support line since 2018, showing consistent strength over the long term.
Each time BNB consolidated near this trendline, it accumulated and then rallied hard, marking key breakout points in previous cycles.
Right now, price has accumulated again and broken out, signaling a potential continuation to the upside. If momentum sustains, the next targets could push toward $1,200–$1,500 and beyond in the coming months.
The rising trendline remains a crucial support, holding above it keeps the macro bullish structure intact.
DYOR, NFA
Thanks for checking this out.
BNB/USDT Binance Coin Breakout to 990?BINANCE:BNBUSDT is setting up for a bullish breakout on the 4-hour chart , with an entry zone between 812-820 near the support zone and rising trendline. First target at 890 aligns with initial resistance, while the second target at 990 could push into new highs if momentum builds. Set a stop loss at 790.5 on a close below to manage risk tightly.
A surge above 830 with strong volume could confirm this move, driven by Binance ecosystem news and crypto market recovery.
Watch BNB chain activity and overall sentiment as key catalysts. This setup looks promising for traders eyeing the rebound—what’s your play?
Do you see this BNB breakout happening? Share your thoughts!
#BNBUSDT #BinanceCoin #CryptoSignals #TechnicalAnalysis #TradingView #DayTrading #MarketAnalysis

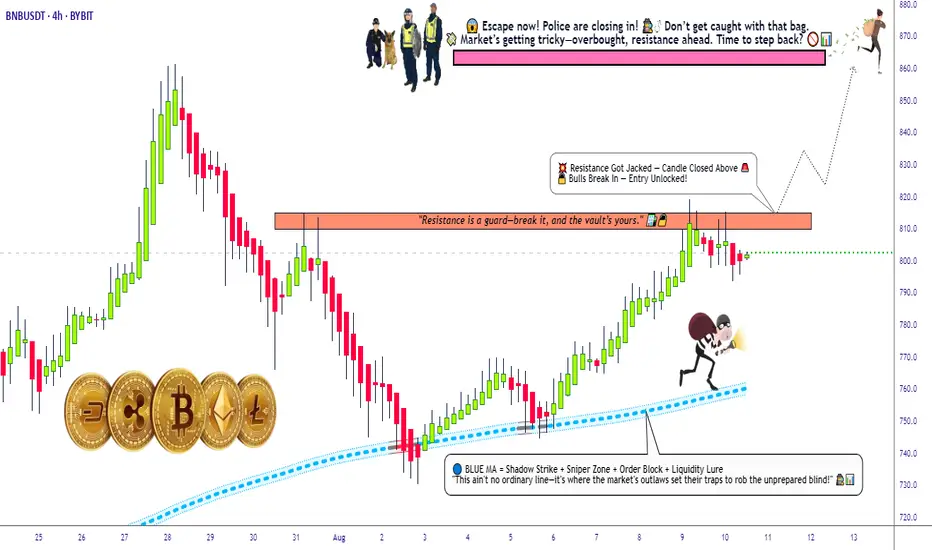
BNB Breakout Masterplan | Police Trap Near Target – Exit Early💎BNB/USDT – The Binance Coin Breakout Heist @820💎
🚨🛡️ Thieves Assemble! 🛡️🚨
The BNB vault doors are about to swing open at 820.0 – and we’re first in line to snatch the loot! This isn’t just a trade; it’s a full-blown breakout robbery plan!
📌 Asset: BNB/USDT "Binance Coin vs Tether"
📌 Plan: Bullish Breakout
📌 Entry: Any price level (load up those layered limit orders like a pro safecracker 🗝️)
📌 Stop Loss: 783.0 (Hide your tracks here if the mission fails)
📌 Target: 860.0 – but remember… the POLICE are waiting near the target 🚓💨, so exit before they close in!
🎯 Mission Brief:
Our technical recon shows BNB is ready to blast past resistance @820.0 – powered by momentum, liquidity traps, and a bit of fear in the bear camp. We layer orders like stacking gold bars, letting the market hand us profit bags one by one.
🛑 Stop Loss Protocol:
Place it with precision at 783.0. Adjust according to your order size & risk appetite – this is no place for sloppy work.
💰 Profit Extraction:
860.0 is the jackpot zone – but if the heat gets too close, escape earlier with your bags full. Use trailing SL to secure the loot.
⚠️ Market Surveillance Alert:
Avoid entering during high-impact news – too many sirens. 🚨
Lock in profits once the market gives you the chance – don’t get greedy.
Scalpers: Only rob on the long side; bears are heavily armed.
💥 Support the crew – Boost this idea so our robbery team grows stronger! Every boost makes us richer in both clout and coin. 🏴☠️💎
Stay sharp, move fast, and escape clean.
We’ll meet again for the next big market heist. 🤑🚀