#BNB/USD Buy Trade Scenario.Here’s an up-to-date #BNB/USD Buy trade outlook (technical + fundamental) to help you assess whether positioning for a Upside makes sense right now.
Thank You......
Bnbusdtsignal

BNBUSDT at Critical Support — Bounce or Breakdown?On the Weekly timeframe, BNB remains in a macro bullish structure after successfully breaking out from the long accumulation phase of 2022–2023 and rallying impulsively to print a local ATH around 1,375.
Following the parabolic rally, price is now undergoing a healthy correction (pullback) and is currently retesting a major demand zone.
The key area to watch is the yellow block at 505 – 450, which previously acted as:
Accumulation base
Breakout origin
HTF structural support
As long as price holds above this zone, the macro bullish structure remains valid.
---
Structure & Pattern Formation
The current structure leans toward a:
1. Bullish Re-Accumulation Range (Wyckoff-like Structure)
Key characteristics:
Strong rally → Buying Climax
Temporary distribution at the top
Pullback forming a Higher Low on HTF
Retest of the origin demand zone
The 505 – 450 zone acts as:
Last Point of Support (LPS)
Smart Money re-entry area
Institutional demand block
---
2. Fibonacci / Horizontal Reaction Levels
Layered resistance levels shown on the chart:
671 → Minor resistance / mid-range
745 → Resistance retest
848 – 930 → Supply / distribution range
1,300 → ATH resistance / breakout trigger
These levels form the bullish continuation roadmap if momentum returns.
---
Key Levels
Support:
505 – 450 → Major demand / invalidation zone
617 → Minor weekly support
Resistance:
671 → Initial resistance
745 → Mid resistance
848 – 930 → Strong supply zone
1,300 → ATH breakout level
---
Bullish Scenario
Bullish continuation activates if:
Price holds above 505 – 450
Strong bullish reaction / weekly close from demand
Upside roadmap:
1. Bounce toward 671
2. Break & hold → move to 745
3. Reclaim 848 – 930 supply
4. If supply breaks → continuation to 1,300 ATH
5. ATH breakout opens new price discovery
This would confirm macro bullish continuation.
---
Bearish Scenario
Bearish case activates if:
Weekly close breaks below 450
Demand fails to absorb selling pressure
Potential downside:
Retest lower historical supports
Return into previous accumulation range
Structure shifts from re-accumulation → distribution
A breakdown here could lead to:
Extended HTF sideways movement
Or the start of a deeper macro correction
---
Conclusion
BNB is currently sitting at a critical HTF decision zone.
The 505 – 450 demand block will determine the next major move:
Hold → Valid re-accumulation → Bullish continuation
Break → Structural weakness → Deeper correction risk
As long as demand holds, the market bias remains bullish, with upside potential toward 900 – 1,300.
#BNB #BNBUSDT #CryptoAnalysis #TechnicalAnalysis #Altcoins #BNBAnalysis #SmartMoney #Wyckoff #Reaccumulation #CryptoTrading #PriceAction #AltcoinSeason #BinanceCoin

#BNB/USD Buy Trade Scenario.Here’s an up-to-date BNB/USD Buy trade outlook (technical + fundamental) to help you assess whether positioning for a Upside makes sense right now.
Thank You......

#BNB/USD Buy Trade Scenario.Here’s an up-to-date BNB/USD Buy trade outlook (technical + fundamental) to help you assess whether positioning for a Upside makes sense right now.
Thank You......

#BNB/USD Buy Trade Scenario.Here’s an up-to-date BNB/USD Buy trade outlook (technical + fundamental) to help you assess whether positioning for a Upside makes sense right now.
Thank You......

#BNB/USD Buy Trade Scenario.Here’s an up-to-date BNB/USD Buy trade outlook (technical + fundamental) to help you assess whether positioning for a Upside makes sense right now.
Thank You......

#BNB/USD Buy Trade Scenario.Here’s an up-to-date BNB/USD Buy trade outlook (technical + fundamental) to help you assess whether positioning for a Upside makes sense right now.
Thank You......

BNB/USD Sell Trade Setup.Here’s an up-to-date BNB/USD Sell trade outlook (technical + fundamental) to help you assess whether positioning for a Downside makes sense right now.
Thank You......

BNB/USDT at Critical Zone – Trend Continuation or Correction?On the 4-day timeframe, BNB/USDT is currently undergoing a healthy correction following a strong bullish impulse that previously formed a blow-off top near the 1,375 level. Price is now retracing into a critical technical area that will likely determine the next major directional move.
---
Pattern & Market Structure Explanation
1. Strong Impulsive Rally
BNB experienced a sharp, near-parabolic rally, signaling strong bullish momentum and a phase of market euphoria.
2. Blow-Off Top Formation
The peak around 1,375 was followed by aggressive selling pressure, indicating distribution from smart money.
3. Corrective Structure (ABC / Descending Pullback)
The current decline appears corrective rather than a full bearish reversal, characterized by controlled lower highs and orderly price action.
4. Major Demand Zone / Previous Resistance Flip
The yellow zone at 765–720 represents:
A historical consolidation area
A former strong resistance level
A potential support-resistance flip (SR Flip) and high-probability demand zone
---
Key Levels to Watch
Resistance Levels:
892
989
1,135
1,300
1,375 (ATH / Major Supply)
Support Levels:
765 – 720 (Major Demand Zone)
Below 720 → risk of deeper correction
---
Bullish Scenario
Price holds and reacts bullishly within the 765–720 demand zone
Bullish confirmation may include:
Strong rejection
Long lower wicks
Break of minor bearish structure
Upside targets:
892 → 989 → 1,135
If momentum strengthens, a retest of 1,300 – 1,375 becomes highly probable
This scenario confirms the move as a pullback within a larger bullish trend
---
Bearish Scenario
A strong 4D close below 720
Demand zone fails to absorb selling pressure
Price may continue correcting toward lower historical support levels
Market structure shifts into a medium-term bearish continuation
Bearish bias is confirmed if subsequent rallies fail to form a higher low
---
Conclusion
BNB is currently trading at a critical decision zone. The 765–720 area is the key battlefield between buyers and sellers. Price reaction here will determine whether BNB resumes its macro bullish trend or enters a deeper corrective phase. Patience and confirmation are essential before taking any position.
---
#BNBUSDT #BNB #CryptoAnalysis #Altcoin #TechnicalAnalysis #MarketStructure #SupportResistance #DemandZone #SwingTrading #CryptoMarket

BNB — Ascending Channels, Shakeout Pattern & Bull Market OutlookIn 2018 BNB formed a clear ascending channel. After moving inside this structure for several years, the market experienced a sharp shakeout in March 2020, which became the final capitulation before a major trend reversal. By late 2020 the price broke out above the channel, confirming the beginning of a strong bull market.
Since 2021 a new ascending channel has been forming. I expect a corrective move toward the lower boundary of this channel in the $300–$350 area. A similar shakeout to what happened in March 2020 may occur again around 2026, potentially acting as a final reset before the next major uptrend.
After this pullback, the next bullish phase could begin, with long-term targets in the $4,000–$5,000 range.
Key points:
2018: formation of the first ascending channel.
March 2020: sharp shakeout → final reset before the bull run.
Late 2020: breakout above the channel → start of the bullish cycle.
2021–present: formation of a new ascending channel.
Expected: retrace to $300–$350 + possible 2026 shakeout.
Long-term target: $4K–$5K after the new bull run begins.

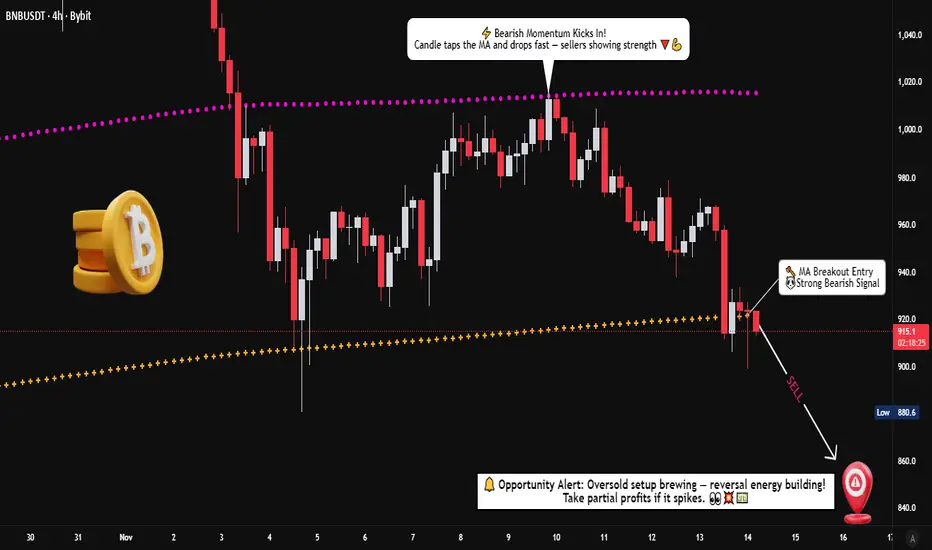
BNB/USDT – Momentum Shift Indicates Controlled Bearish Pressure📊 BNB/USDT: CRYPTO MARKET OPPORTUNITY BLUEPRINT | Swing Trade Analysis
🎯 TRADE SETUP OVERVIEW
Asset: BNB/USDT (Binance Coin vs Tether)
Timeframe: Swing Trade
Bias: 🔴 BEARISH | Confirmed via Weighted Moving Average Dynamic Support Breakout
📍 ENTRY STRATEGY: LAYERING METHOD
Entry Approach: Multiple Limit Order Layering (Dollar-Cost Average Entry Style)
Layer 1: $960.0 (Initial Entry)
Layer 2: $940.0 (Add Position)
Layer 3: $920.0 (Scale Entry)
💡 Customize layer levels based on your risk tolerance & capital allocation
🛑 STOP LOSS (SL)
Thief OG's SL Level: 🎪 $970.0
⚠️ CRITICAL: Place SL only after breakout confirmation is validated on price action
📌 Disclaimer: Adjust SL based on your personal strategy & risk management rules. This is YOUR capital at risk.
🎁 PROFIT TARGET (TP)
Target Level: 🏁 $850.0
Why This Level?
✅ Moving Average acts as strong resistance zone
✅ Overbought conditions present
✅ Previous support-turned-resistance trap identified
✅ Optimal risk-to-reward structure
📌 Disclaimer: This is a reference target. Take profits at YOUR discretion. Partial profit-taking recommended.
🔗 CORRELATED PAIRS TO MONITOR
Direct Correlations (High Impact)
1. ETH/USDT (Ethereum) - 📈 POSITIVE CORRELATION
Why Watch: BTC & ETH dominance typically drives altcoin movement
Key Point: If ETH breaks down, BNB often follows within 2-4 hours
Action: Use as confirmation signal for BNB downtrend continuation
2. BTC/USDT (Bitcoin) - 📈 POSITIVE CORRELATION
Why Watch: Bitcoin is the market leader; BNB is highly correlated
Key Point: Major Bitcoin support/resistance breaks precede BNB moves
Action: Monitor BTC for early trend reversal signals
3. BNB/BTC (Binance Coin vs Bitcoin) - 🔄 RELATIVE STRENGTH
Why Watch: Shows BNB's strength independently from Bitcoin
Key Point: If BNB/BTC weakens while BTC holds, downtrend is stronger
Action: Confirmation of bearish bias strength
Secondary Watch Pairs (Market Context)
4. USDT Dominance - 💰 INVERSE CORRELATION
Key Point: Rising USDT dominance = increased selling pressure on alts
Action: Check Tether flows into/out of BNB pairs
5. Crypto Fear & Greed Index - 📊 SENTIMENT INDICATOR
Why Watch: Extreme readings often precede reversals
Key Point: Greedy sentiment before drops = trap setup (like here)
Action: Validate bearish thesis with sentiment extremes
⚡ RISK MANAGEMENT CHECKLIST
✅ Breakout confirmation required before entry
✅ Risk:Reward ratio minimum 1:2 for this setup
✅ Position size = (Account Risk % × Capital) ÷ (Entry - SL)
✅ Scale entries across 3 layers to reduce slippage
✅ Monitor correlations for early exit signals
✅ Take profits in tiers: 33% at 900.0 | 33% at 875.0 | 34% at 850.0
📊 Summary
BNB has shifted into a bearish structure after losing dynamic support. With a layered entry method, flexible SL/TP management, and clear correlation signals across major crypto assets, this setup provides a properly structured swing opportunity for disciplined traders.
BNB/USDT Setup – Will the Moving Average Confirm the Bull Move?💎 BNB/USDT – "BINANCE COIN VS TETHER" 💰
Crypto Market Opportunity Blueprint (Swing Trade)
📈 Plan: BULLISH
After a period of compression within a triangular structure, BNB is preparing for a potential breakout. The breakout above the triangular moving average could trigger a new bullish wave — offering a solid opportunity for swing traders!
💥 Entry:
✅ Any price level after confirmed breakout above the triangular moving average.
Patience = profits. Wait for confirmation to avoid fake moves.
🛑 Stop Loss:
This is the “Thief SL” @ 920.0 💀
⚠️ Note: Dear Ladies & Gentlemen (Thief OG’s) — adjust SL based on your strategy & risk appetite. Place it only after breakout confirmation, not before!
🎯 Target:
The moving average acts as a strong resistance zone, combined with overbought signals and potential trap activity.
Our target: @ 1120.0 💰
💬 Take profits smartly — your capital, your rules.
🧭 Related Pairs to Watch (Correlation Insight)
🔹 BINANCE:BTCUSDT – Bitcoin’s momentum drives most altcoin sentiment. A BTC breakout usually strengthens BNB bullish continuation.
🔹 BINANCE:ETHUSDT – Ethereum & Binance Coin often move in tandem within similar risk cycles; ETH strength confirms market-wide bullish tone.
🔹 BINANCE:SOLUSDT – Competes in smart-contract dominance; if SOL rallies, BNB tends to mirror short-term volatility shifts.
🔹 BINANCE:BNBBTC – Tracks BNB’s relative strength against BTC. Watch for BNB outperforming BTC — a hidden signal of accumulation by whales.
⚡ Key Points
Volume confirmation is crucial ⚙️
Wait for candle close above MA 🕒
Manage risk; don’t blindly copy setups 🚫
Follow the trend, not emotions 💭
🧠 Final Note:
This is not financial advice. Trade wisely, respect your plan, and remember — smart exits matter more than perfect entries.
🚀 Stay patient, stay sharp — Thief OG’s never chase, they calculate.

BNB/USDT 1H AnalysisHi
After a prolonged downtrend, BNB has broken its descending trendline, signaling a shift from bearish to bullish momentum. The price formed a symmetrical triangle pattern, completing at point D, which coincides with the lower boundary of the rising channel. Since then, BNB has been trading inside a clearly defined ascending channel, respecting both support and resistance levels.
Recently, a bullish flag has formed, representing a consolidation after a strong upward impulse. A breakout from this flag suggests continuation towards the upper channel boundary near $940–950. Support lies around $880, aligning with both the flag’s lower boundary and the channel’s midline.

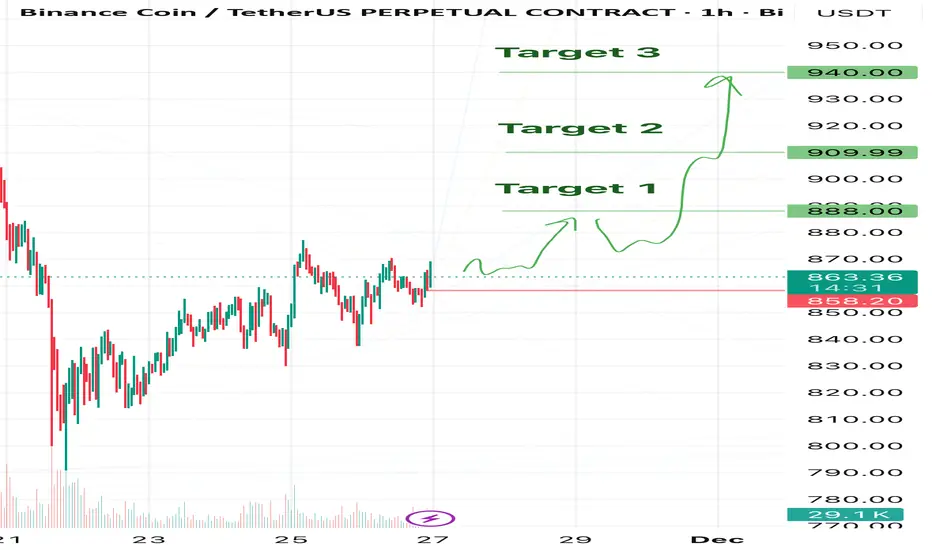
BNB - Optimistic outlookIn my view, BNB looks more than optimistic.
I believe we can see this coin at 900 and higher in the foreseeable future.
But we might currently be in a correction (possibly an ABC) after the previous drop, so we keep our hand on the pulse. As always — mandatory stops, no exceptions!
My current targets:
🎯 Target 1 — $888
🎯 Target 2 — $910
🎯 Target 3 — $940
❌Invalidation level: $858.2
A clear break and close below this zone cancels the bullish scenario for me.
Long bias remains as long as we hold above 858.2.
Trade safe and see you at the targets! 🚀
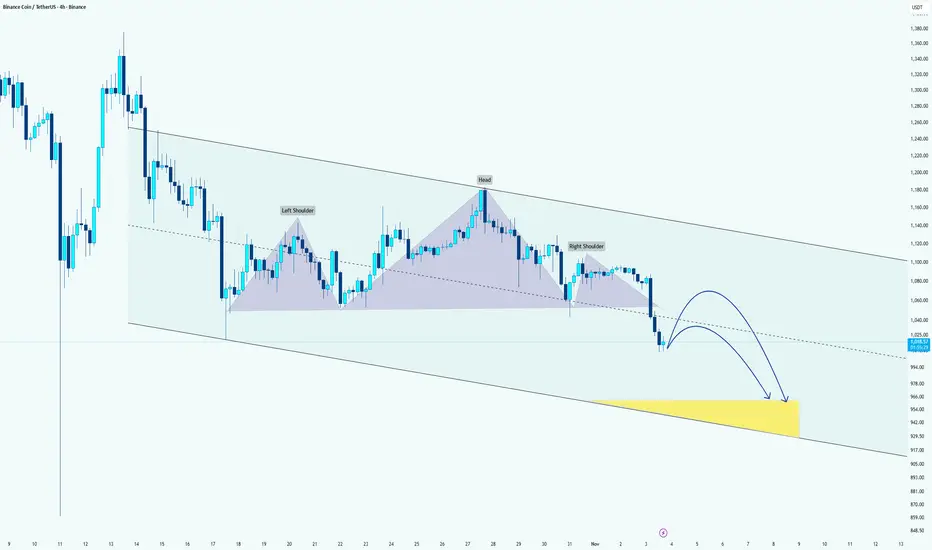
BNB Forming Head & Shoulders Breakdown Within Descending ChannelHi!
The chart shows a descending channel, indicating that the broader trend remains bearish. Inside this channel, we can see a Head and Shoulders pattern that recently broke below its neckline, confirming a potential continuation of the downtrend.
After the neckline breakout, price pulled back slightly but continues to trade under the broken support. The two projected blue curves suggest a possible short-term retracement toward the neckline or mid-range of the channel, followed by another move to the downside.
The yellow highlighted area marks a strong target/support zone between roughly $950–$970, which aligns with:
The bottom boundary of the descending channel, and
The measured move projection from the Head and Shoulders pattern.
As long as the price stays below the neckline and within the channel, the bearish bias remains intact. A clean break above the neckline could temporarily invalidate this scenario and lead to a relief rally, but overall, momentum favors a continuation toward the lower support zone.
BNB/USD Market Levels: Multi-Buy Plan, Risk & Reward Defined📈 BNB/USD "Binance vs U.S Dollar" – Crypto Market Wealth Strategy Map (Swing/Day Trade)
🔥 Plan: Bullish bias confirmed with Hull MA pullback + Heikin Ashi bullish reversal candle spotted.
🎯 Entry (Thief Layering Style):
This strategy uses multiple limit orders (layer entries) instead of a single entry point. Example layers:
Buy Limit @ 980.0
Buy Limit @ 990.0
Buy Limit @ 1000.0
Buy Limit @ 1010.0
(You can expand layers higher/lower depending on your style).
🛑 Stop Loss (SL): Suggested at 960.0.
⚠️ Note to all Thief OG’s: This is my own risk level. You are free to adjust according to your money management.
💰 Target (TP):
Main target @ 1070.0 🚀
Strong resistance “Police Barricade” zone around 1100.0 (possible overbought trap).
⚠️ Note: Escape with profits before the trap. Again, it’s your call — you take the money when you make the money.
🔗 Related Pairs to Watch (Correlation Radar):
BITSTAMP:BTCUSD → BNB usually follows BTC momentum closely.
BITSTAMP:ETHUSD → ETH strength often fuels altcoin flows (including BNB).
COINBASE:SOLUSD → Competes with BNB in ecosystem growth; check relative performance.
BINANCE:BNBBTC → Strong ratio helps confirm if BNB is outperforming Bitcoin.
✨ “If you find value in my analysis, a 👍 and 🚀 boost is much appreciated — it helps me share more setups with the community!”
⚠️ Disclaimer: This is a Thief-style trading strategy, shared for educational & fun purposes only. Not financial advice. Trade at your own risk.
#BNBUSD #CryptoTrading #SwingTrade #DayTrade #LayeringStrategy #HullMA #HeikinAshi #Altcoins #BTC #ETH #SOL

BNB SHORTThe wave (3) traveled 162% of the distance, reached the trend line of the structure, and realized the potential of the wave (4) on a logarithmic scale. It's time for correction. Given the momentum formation scenario, this is the best point for a reversal on the chart.

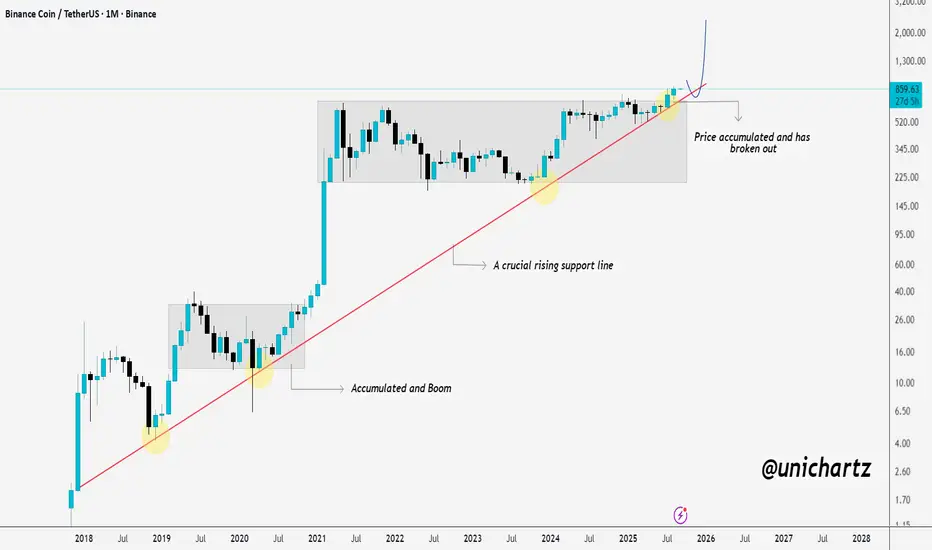
$BNB could move 80% from here - the key levels to watch BNB/USDT Monthly Analysis
CRYPTOCAP:BNB has been respecting a strong rising support line since 2018, showing consistent strength over the long term.
Each time BNB consolidated near this trendline, it accumulated and then rallied hard, marking key breakout points in previous cycles.
Right now, price has accumulated again and broken out, signaling a potential continuation to the upside. If momentum sustains, the next targets could push toward $1,200–$1,500 and beyond in the coming months.
The rising trendline remains a crucial support, holding above it keeps the macro bullish structure intact.
DYOR, NFA
Thanks for checking this out.
Binance Coin Robbery Setup – Bullish Layers or Police Trap?🚨💰 BNB/USD Crypto Market Grand Heist Plan 🎭🚨
🕵️♂️ Dear Thief OG’s & Market Robbers,
The vault door is open in BNB/USD “Binance Coin vs U.S Dollar” Crypto Market — today’s Day Trade Heist is about to begin! 🔥
📜 Master Plan
Direction: 📈 Bullish Robbery Mode Activated
Entry 🎯: Thief never knocks once — we layer entries at:
900.00 💵
890.00 💵
880.00 💵
👉 You can add more layers depending on how big your bag needs to be!
Stop Loss 🛑:
Thief SL is hidden at 870.00 — escape hatch ready!
⚠️ Adjust your SL based on your own strategy & risk appetite.
Target 🎯:
Police barricade spotted! 👮♂️💥
Our grand escape with the loot is at 930.00 — grab it before they catch you! 🚔💨
💡 Thief’s Strategy
We don’t enter all-in — we slice the entry with multiple limit orders (layering strategy style), just like cracking a safe piece by piece.
Patience, discipline, and precise timing = a clean heist. ⏱️🔓
⚠️ Trading Alert: Stay sharp — news releases & sudden volatility can trigger alarms. Always manage your positions and keep your stops in check!
💖 If this heist plan fuels your robbery spirit, hit the Boost Button 💥 and strengthen the Thief Army.
Together we rob the market daily with style, precision & profit. 🏆💪🤑
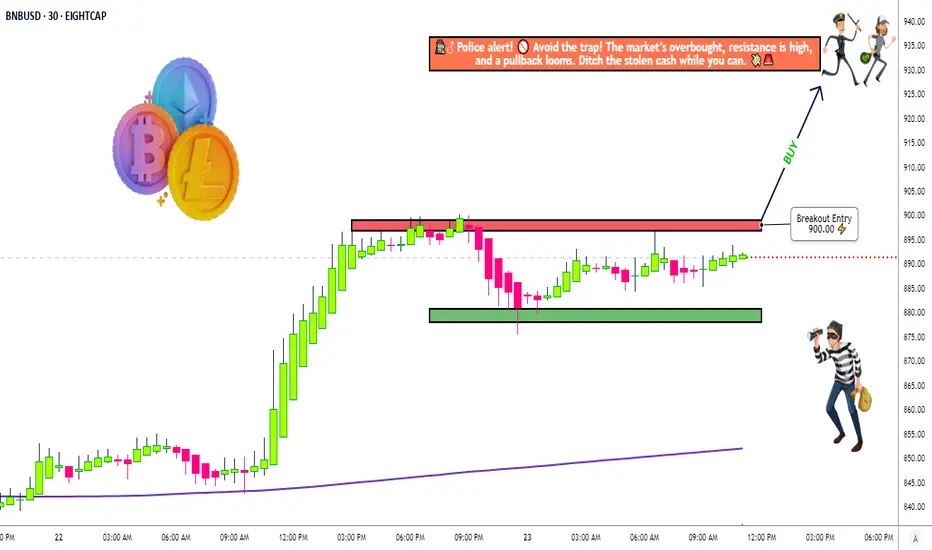
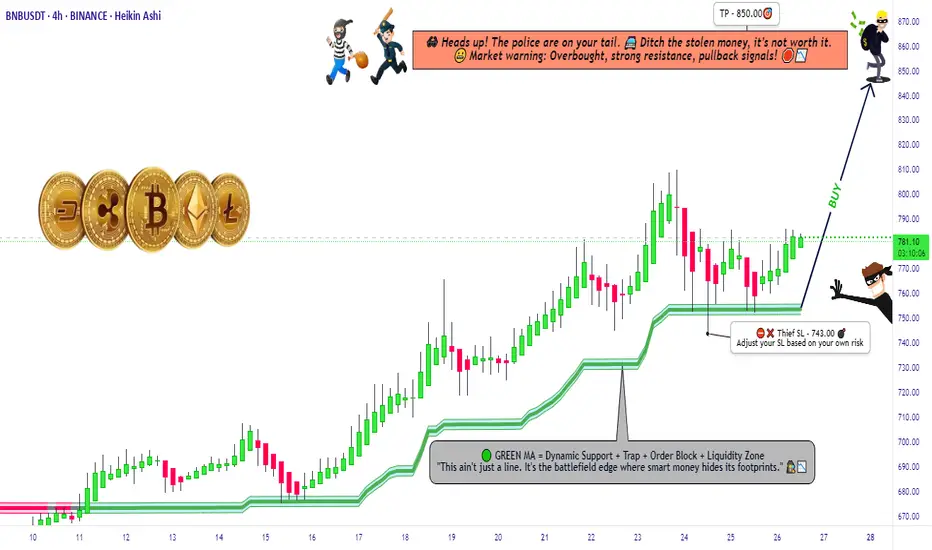
"BNB Primed for a Pump – Thief Trading Mode Activated!"🚨 BNB/USDT HEIST PLAN – SWIPE THE BULLISH LOOT BEFORE COPS ARRIVE! 🚨
🌟 Attention, Money Makers & Market Robbers! 🌟
(Hola! Oi! Bonjour! Hallo! Marhaba!)
The BNB/USDT vault is CRACKED OPEN—time to execute the ultimate heist! 🏦💰 Based on 🔥Thief Trading Style Analysis🔥, here’s your lucrative robbery blueprint for the Binance Coin vs. Tether market.
🔐 MASTER PLAN: LONG ENTRY HEIST (HIGH-RISK, HIGH-REWARD)
🎯 TARGET: 850.00 (or escape before the cops show up!)
🚨 POLICE TRAP ZONE: Overbought + Strong Resistance – Bears & cops are lurking!
💎 TAKE PROFIT EARLY & TREAT YOURSELF! (You’ve earned it, outlaw!)
⚔️ ENTRY STRATEGY: SWIPE FAST OR WAIT FOR THE PULLBACK!
🤑 VAULT IS OPEN! Enter any price if you’re bold (instant long).
🕵️♂️ SMART THIEVES: Use buy limit orders near 15M/30M swing lows/highs for a safer heist.
🛑 STOP-LOSS (ESCAPE ROUTE)
Thief SL: 743.00 (4H candle wick – adjust based on your risk tolerance!)
⚠️ WARNING: If the cops (bears) break in, DON’T HESITATE—RUN!
🎯 TARGETS & ESCAPE PATHS
Scalpers: Trail your SL & escape with quick loot! (Only long-side allowed!)
Swing Bandits: Hold strong but watch for police traps!
📡 MARKET INTEL (WHY THIS HEIST WILL WORK)
Bullish momentum in play! (But stay sharp—consolidation & reversals possible.)
Fundamentals, COT Reports, On-Chain Data, & Sentiment all hint at more upside!
🚨 TRADING ALERTS – DON’T GET CAUGHT!
📰 NEWS = VOLATILITY! Avoid new trades during major releases.
🔒 LOCK PROFITS! Use trailing stops to protect your stolen gains.
💥 BOOST THIS HEIST – STRENGTHEN THE SQUAD! 💥
🔥 Hit the LIKE & FOLLOW to support the robbery team!
🚀 More heists coming soon—STAY TUNED, OUTLAWS! 🚀
🎯 Trade Smart. Steal Big. Escape Faster. 🏴☠️
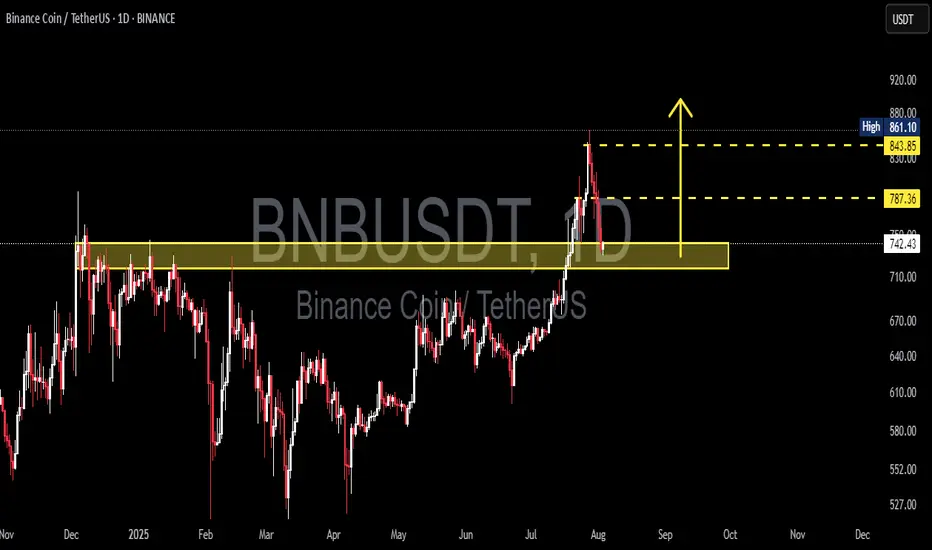
BNBUSDT Critical Retest in Progress📊 Comprehensive Analysis:
BNB/USDT has finally managed to break out of a major consolidation range that lasted over 6 months, with the key resistance zone between $730 and $750 acting as a strong ceiling since late 2024.
The breakout in late July 2025 was supported by a noticeable increase in volume, signaling strong accumulation and a possible shift from a ranging market to a bullish trend.
Now, the price is revisiting this previous resistance — a crucial retest zone that will likely determine whether this move is sustainable or a potential bull trap.
---
🔍 Key Price Levels Identified:
🟡 Retest Support Zone (Previous Resistance):
$730 – $750 → A critical area that must hold to maintain the bullish market structure.
🟡 Minor Resistance:
$787.36 → Recently rejected, this is the next short-term barrier that bulls must break.
🟡 Major Resistance (Swing High):
$843.85 → Key historical level before reaching the recent local high.
🔵 Recent Local High (Potential Double Top or Breakout):
$861.10 → A break above this level could open the doors to fresh highs.
---
✅ Bullish Scenario:
If BNB holds above the $742.36 level and prints a strong bullish reversal candle (e.g., pin bar or bullish engulfing), the retest can be considered successful.
Next upside targets:
🎯 $787.36 → Immediate resistance
🎯 $843.85 → Key swing high
🎯 $861.10 → Local high
🎯 $900 psychological level → If momentum and volume persist
Look for decreasing volume during retracement and surging volume on breakout to confirm bullish continuation.
---
❌ Bearish Scenario:
If the price fails to hold above $742.36 and breaks down below $730, this may confirm a false breakout (bull trap).
Downside targets could include:
⚠️ $710 – $690 → Minor demand zone
⚠️ $660 – $640 → Historical support within the previous range
A bearish confirmation would come from a lower high formation followed by a strong bearish breakdown candle with increasing volume.
---
📈 Chart Pattern & Price Structure:
The breakout indicates a bullish continuation pattern.
Potential formation of a Bullish Flag or an Ascending Channel, if support holds and consolidation continues above $740.
No major signs of distribution yet — the structure remains healthy and bullish.
---
🧠 Strategic Summary:
> The market has shown strong bullish intent, but it is now at a critical retest phase. Holding this zone could ignite the next leg up. Failure to do so, however, may signal a reversal or deeper correction.
For swing traders, the $730–$750 zone is a golden pocket for potential entries with tight risk management. For conservative traders, a confirmed breakout above $787–$843 offers a safer opportunity.
#BNBUSDT #BNBAnalysis #CryptoBreakout #Altcoins #TechnicalAnalysis #PriceAction #SupportResistance #BullishScenario #BearishScenario #CryptoTrading #BinanceCoin #SwingTrading
BNBUSDT - Big Move Loading….BINANCE:BNBUSDT recently made a clean breakout from a strong resistance level, and since then, it’s been chilling in a tight consolidation range textbook flag formation if you ask us! This kind of local flag pattern often signals a continuation of the previous move, and in BNB’s case, that move was up.
The consolidation phase seems mature now, and price action is starting to show signs of life again. With growing hype around BNB and Binance related developments, momentum could be building for a strong leg up. If things go as expected, the next destination might just be its previous all-time high. 👀
Traders should watch for volume confirmation on the breakout from this flag. A decisive move above the pattern could trigger a sharp rally. But hey as always, don’t forget your stop-loss. Protect your capital and ride the move smartly. Let’s see if BNB is ready to fly again!
BINANCE:BNBUSDT Currently trading at $653
Buy level : Above $655
Stop loss : Below $620
Target : $795
Max leverage 5x
Always keep stop loss
Follow Our Tradingview Account for More Technical Analysis Updates, | Like, Share and Comment Your thoughts

BNBUSDT sell/shortBy utilizing levels, historical patterns, , we can formulate a hypothesis that the market might follow a similar trajectory if bearish sentiment prevails.
