Boeing (BA) Technical Outlook: Is Downside Momentum Building?✈️ BA "BOEING COMPANY" | Cash Flow Management Strategy (Swing/Day Trade)
📉 Plan: Bearish Setup
This analysis follows the Thief Strategy 🕶️ — a layering method of multiple sell-limit orders across different levels.
🔑 Trade Plan
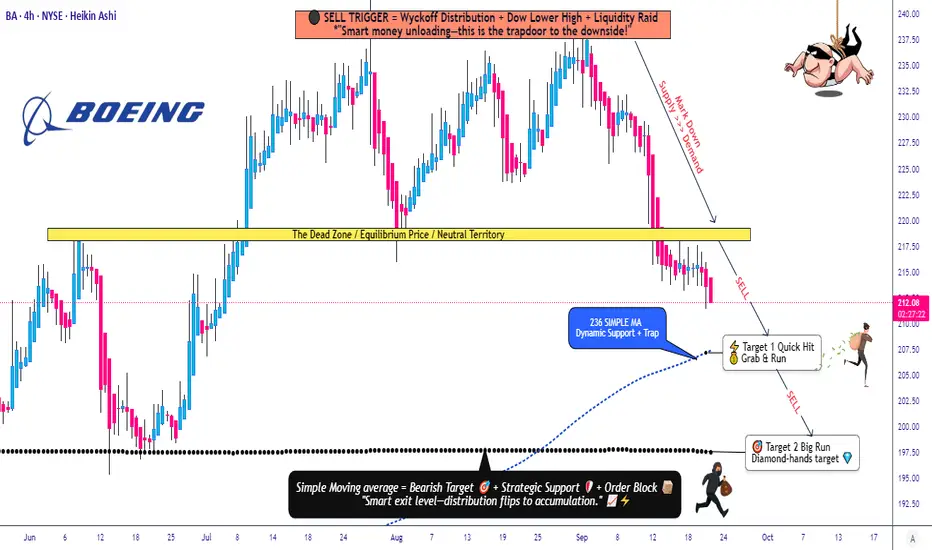
Entry (Layered Sell Limits):
220.00
218.00
216.00
214.00
(You can increase/decrease limit layers based on your own preference)
Stop Loss: 227.00 (⚠️ Thief SL)
Note: Dear Ladies & Gentleman (Thief OG’s) 🙌 this SL is just my own preference. Please manage your risk your own way.
Targets 🎯
TP1 → 207.00
TP2 → 197.00
Note: Targets are my reference points. You can book profits at your own choice, anytime.
📊 Key Points & Correlation
Boeing (BA) often reacts to aviation sector news ✈️ and macroeconomic cycles 📉.
Watch related pairs for correlation / sentiment clues:
AMEX:SPY (S&P 500 ETF) – BA is a Dow & SPX component.
TVC:DJI (Dow Jones Index) – Direct BA weighting.
NYSE:LMT (Lockheed Martin) – Sector peer correlation.
SKILLING:AIR.PA (Airbus SE) – Competitive aviation stock in Europe.
A slowdown in air travel demand, defense spending shifts, or broad market weakness may enhance bearish momentum.
🧠 Strategy Style Reminder
This is the Thief Layering Strategy → scaling into positions step by step with multiple limit orders, not rushing into full size at once. It’s a patient cash flow management approach.
✨ “If you find value in my analysis, a 👍 and 🚀 boost is much appreciated — it helps me share more setups with the community!”
⚠️ Disclaimer: This is Thief Style Trading Strategy — just for fun & educational purpose. Not financial advice. DYOR & manage risk.
#BA #Boeing #Stocks #DayTrading #SwingTrading #LayeringStrategy #ThiefStyle #SPY #DJI #LMT #Airbus #StockMarket
Boeingstock
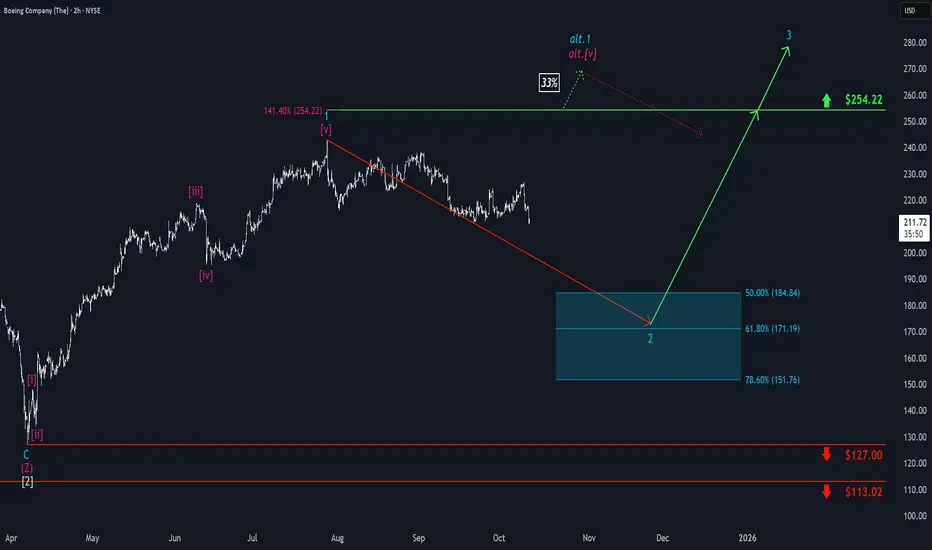
Boeing: Target Zone AheadOver the past two weeks, Boeing shares have seen several upward moves, but each rally was quickly met with selling pressure. In our primary scenario, we anticipate further declines as part of turquoise wave 2, which is expected to conclude within our turquoise Target Zone of $184.84 to $151.76. Looking ahead, wave 3 offers potential for gains above resistance at $254.22. A direct breakout above this level would initially signal a higher high within turquoise wave alt.1 before the anticipated correction occurs (probability: 33%).
Boeing (BA) Share Price Could Reach 2025 HighsBoeing (BA) Share Price Could Reach 2025 Highs
As the Boeing (BA) stock chart indicates, the price rose by 3.5% yesterday, while the S&P 500 index (US SPX 500 mini on FXOpen) gained only 0.4%. Boeing’s stronger performance reflects optimism driven by news (and market rumours) reported in the media suggesting that:
→ Korean Air has purchased more than 100 aircraft during the newly elected South Korean president’s visit to the White House;
→ Boeing is negotiating the sale of 500 aircraft to China;
→ the Trump administration may acquire stakes in companies linked to the defence sector (Palantir, Boeing, Lockheed Martin).
Technical Analysis of BA Stock Chart
BA’s price fluctuations have formed an upward channel (shown in blue). However, at the end of July, the rally encountered resistance around the $235 level:
→ following a volatility spike at the end of July (triggered by the quarterly earnings release), the price retreated towards the lower boundary of the channel;
→ in mid-August, the price turned downwards again from this level.
At the same time, we can observe a sequence of higher lows (1-2-3), emphasising that the lower boundary of the channel is acting as key support, setting the pace for BA’s growth trajectory in 2025.
It is worth noting that the stock’s oscillation between support (the lower boundary) and resistance around $235 is creating bullish patterns such as an Ascending Triangle and a Cup and Handle.
Should reports of a potential Boeing share purchase by the US government be confirmed, the BA stock price could advance to new annual highs. In such a scenario, several factors could be important:
→ the price may subsequently consolidate around the channel’s median;
→ historically, the $250–260 zone has acted as significant resistance during 2021–2023;
→ the $235 level may switch roles to become support, similar to the way $218 previously did.
This article represents the opinion of the Companies operating under the FXOpen brand only. It is not to be construed as an offer, solicitation, or recommendation with respect to products and services provided by the Companies operating under the FXOpen brand, nor is it to be considered financial advice.

The Infamous Boeing: Accidents Weight on PriceThe Infamous Boeing: Accidents Weigth on Price
Dear Esteemed Members,
Boeing’s stock price has also dropped by 8.5% since Monday after a plane had to make an emergency landing after a part of its fuselage ripped off mid-air. Another plane was grounded after a window fell out during takeoff. Alaska Airlines decided to inspect all Boeings.
The competition from Airbus, which has secured a deal with the US Air Force to provide 20 A330 Multi Role Tanker Transport aircraft for $3.5 billion. This deal could give Airbus an edge over Boeing in the military aviation market, and also boost its reputation and revenue.
Kind Regards,
Ely

Boeing Approaching Critical Support: Will $150 Hold or Break?Hey fellow traders,
Boeing ( NYSE:BA ) is facing some turbulent times both fundamentally and technically, and all eyes are on the charts to see what happens next. Let’s break it down.
After a series of tough news — including a machinist strike and warnings about a potential credit downgrade — Boeing has seen a sharp drop, falling nearly 4% on Friday alone. This brings the stock down to $156.77, close to a two-year low. But that’s not the full story; we’re approaching a pivotal level that could make or break Boeing’s near-term future.
What’s Happening on the Charts?
Downtrend Dominance: Boeing’s been in a consistent downtrend, with a well-established trendline that’s been pushing the price lower for some time now. Each time the stock tries to break through, it’s met with resistance. We’re getting close to testing that support again.
$150 Key Support: The price is closing in on $150 — a level that’s acted as a strong support in the past. This is the line in the sand, and a lot of traders are watching closely. Will it hold, or are we headed for further downside?
Possible Scenarios Ahead
Bullish Case: If Boeing finds support at $150, we could see a short-term bounce. The next logical target would be back to the $170-$175 range, which lines up with that downward trendline.
Bearish Case: On the flip side, if $150 breaks, things could get ugly. Given the current sentiment, we might be looking at a sharper drop, with $130 as the next potential support area.
Volume Will Tell the Story
One thing to keep an eye on is volume. If we start seeing increased selling pressure, it would confirm the bears are in control. Right now, the fundamentals (negative news, cash burn, strike) are aligning with the technicals — a dangerous combination.
Final Thoughts Here
Whether you’re bullish or bearish, the next few days could provide some interesting opportunities. If $150 holds, we might see some relief, but if it breaks, it could signal much bigger downside potential. Let me know what you think! Will Boeing bounce or break?

Boeing: Approach for a Landing 🛬In line with our primary scenario, the Boeing stock price is pitching further downward. Soon, the magenta wave (2) should find its completion above the $176 mark. Subsequently, we expect rises above the resistance at $267.54. However, this primarily anticipated uptrend could be interrupted halfway. If the price reverses before reaching the resistance at $267.54 and falls below the $176 mark (37% likely), we will have to assume that it will land in our dark green Target Zone between $172.25 and $130.78.

Boeing: Descent to $130Overview
Boeing ( NYSE:BA ) has had a rough several years due to the controversy surrounding its MAX series. Just recently, an incident occurred during a flight on the West Coast where a part of the fuselage blew off during an ascent and required a prompt emergency landing. Fortunately everyone onboard made it safely back to the airport. This follows years after the two fatal Boeing MAX crashes in 2018-2019.
Technical Analysis
This is a new one for me. The BA 1D chart doesn't reveal any obvious patterns and, if anything, was in the process of forming an ascending triangle which is bullish. In light of the breaking news I am fairly confident that the ascending triangle will become invalid then transform into a months long descending triangle.
Utilizing Fibonacci retracement levels, I am expecting decent support around $130. Of course there will always be plenty of opportunity for scalping in-between now and then as the current share price is sitting around $249.
Fundamental Analysis
I will assess the balance sheet and provide a fundamental analysis sometime this weekend. However, I don't believe even a good balance sheet will alleviate the coming selling pressure. The markets are reactive to news and a healthy balance sheet would only mean certain recovery at a later time.

[BA] BOEING CO. BUY SETUPlooking for a rebound soon and recovery this year.
possible targets : 330$ , 425$

Boeing's stock is about to challenge the top high shoulder Boeing's stock is about to challenge the top high shoulder
This chart shows the weekly candle chart of Boeing's stock in the past 4 years. The graph overlays the 2020 bottom to top golden section. As shown in the figure, Boeing's stock is currently in the second largest wave band after bottoming out, with the third wave rising and about to challenge the top high shoulder position in March 2021! In the future, focus on the 1.618 and 2.000 positions of the golden section in the graph, and use these two positions as the long short split range for Boeing's stock!

Boeing: Approach 🛬Boeing is approaching the low of wave (4) in magenta, but still has got room left to expand this movement further southward. As soon as it is finished, though, the share should turn upward to steer above the resistance at $228.16, heading for the dark green zone between $251.82 and $288.54. There, Boeing should complete wave 1 in dark green before maneuvering southward again. However, there is a 34% chance that the share could have concluded wave alt.1 in dark green by now. In that case, it would spin below the support at $173.85 and into the lower dark green zone between $168.58 and $141.08 to already develop wave alt.2 in dark green. This low would then initiate further upward movement.

Is BA- Boeing Company ready for bullish continuation ?BA is in the industrial sector. Presently a sector may be underway with the industrial sector
(XLI) getting more attention and some upticks. On the daily chart BA is seen in consolidation
at the high volatility high volume area about the POC line of the volume profile. In 2022,
BA descended from its post-COVID highs into a double bottom of the "W" type. Since then
the uptrend continued into the present consolidation. The zero-lag MACD shows the K /D lines
crossing the zero horizontal line. BA is further supported by the long term mean of the anchored
VWAP.
Given the pattern and trends on the highly reliable daily chart. I see this as a good setup for a
long swing trade of either stocks or call options with about 40% upside to the supply zone. I
see it as a good way to diversify away from technology for better risk management.

Boeing: Aerobatics ✈️Welcome to Boeing’s aerobatics-show! Watch with bated breath as the share is taking off from the magenta-colored zone, propelling toward the resistance at $224.76, which it should conquer soon to conclude the loop of wave 1 in green in the green zone between $251.82 and $288.54. Then, in a death-defying stunt, Boeing should drop back below $224.76 and dive below the support at $173.85 afterward. However, there is a 33% chance that Boeing could curb its boost earlier, slipping below $173.85 prematurely to develop wave alt.2 in green into the green zone between $168.58 and $141.08. In that case, wave alt.1 in green would have already been finished in January.

BA The Boeing Company Options Ahead of EarningsLooking at the BA The Boeing Company options chain, i would buy the $146 strike price Calls with
2022-11-4 expiration date for about
$3.61 premium.
Looking forward to read your opinion about it.

Boeing at Long Term Support -70% $BA AnalysisBoeing looks like a good long term buy and hold. Currently down over 70% from ATH.
I may buy this. Will update if I do.

$BA Daily Setup Just Got Better 4/15 Quick Video analysis on $BA Daily triangle resistance broken. Yesterday was a retest of that resistance so we should see a move up today market willing.


BA Boeing We saw in January 27 2020 and 1 February 2020 a 2 bottom formation (bullish sign ) , but for now I can identify the top of rising wedge and seams to be a bull exhaustion with a small pullback. In a long term I`m bullish on BA with the vaccine the Aerospace & Defense Industry and transportation sector can come back to normal.


Boeing Co Buy📈 NYSE:BA Long D1
🛒Buy above = 219.64
🎯Target1 = 236.64
🎯Target2 = 247.66
🎯Target3 = 264.98
⛔️Stop-loss = 191.62
❌Cancel trade = 208

Boeing Retrace CompleteThis has retraced to 0.5 Fibonacci and rebounded slightly but I would expect this to continue. Target is next resistance at 292

BA BUY (BOEING CO)Hi there. Price is forming a continuation pattern to the upside.
Watch strong price action at the current levels for buy.

$BA **REQUEST** Consolidation Above $200 Expected 1/21/21Video Breakdown and Analysis on $BA going into New Year! REQUESTED

BOEING- Took 3rd take profit / holding another 30% 🧐✈️Was a great timing and one of my best trades last month. I have taken profit gradually 3 times and still hold 30% of my initial positions to attempt to take profits at 258 and 300.
Thank you Boeing 🥰✈️
