When Structure and Volatility Align Again — Will History Rhyme?In the past, an ascending triangle combined with a Bollinger Bands squeeze led to a volatility expansion and the start of a directional move.
Currently, price is consolidating within a horizontal channel while Bollinger Bands are compressing again, suggesting another phase of reduced volatility.
Rather than predicting direction, this observation focuses on how market structure and volatility compression often precede expansion , regardless of outcome. The question remains whether history will rhyme once more — to the upside or the downside.
ETHICAL & EDUCATIONAL NOTICE
This content is presented solely for educational and analytical purposes , based on historical price data.
It does not promote or encourage any specific trading method, financial instrument, gambling, leverage, margin usage, short selling, or interest-based activity .
Readers are encouraged to align any financial activity with their own ethical, legal, and religious principles .
⚠️ DISCLAIMER
This material is strictly educational and informational .
It does not constitute financial advice, investment recommendations, or trading instructions.
The author does not provide personalized guidance.
Any decisions made based on this content are the sole responsibility of the individual.
Bolingerband

How to Trade with Bollinger Bands in TradingViewBollinger Bands are a volatility indicator that helps traders identify market extremes, trend strength, and potential breakout setups by measuring how far price moves away from its average.
What You’ll Learn:
• Understanding Bollinger Bands as a volatility-based trading tool built around a moving average
• How the middle band represents the 20-period simple moving average (SMA)
• How the upper and lower bands are calculated as two standard deviations above and below that SMA
• Why expanding bands signal rising volatility — and tightening bands signal market compression
• Recognizing overbought and oversold conditions when price touches or moves beyond the upper or lower bands
• Why these signals aren’t automatic buy or sell triggers, and how to confirm them with other tools like RSI or MACD
• Identifying the “Bollinger Band squeeze,” a setup that often precedes major breakouts
• Spotting potential mean-reversion trades when price closes back inside the bands after moving outside
• How to add Bollinger Bands on TradingView via the Indicators menu
• Understanding the default settings (20, 2) and how adjusting the period or deviation affects sensitivity
• Practical examples using the E-mini S&P 500 futures chart
• Applying Bollinger Bands across daily, weekly, and intraday timeframes for volatility analysis and signal confirmation
This tutorial is designed for futures traders, swing traders, and technical analysts who want to integrate volatility dynamics into their trading approach.
The methods discussed may help you identify breakout conditions, trend continuation signals, and potential reversal zones across multiple markets and timeframes.
Learn more about futures trading with TradingView:
optimusfutures.com
Disclaimer
There is a substantial risk of loss in futures trading. Past performance is not indicative of future results. Please trade only with risk capital. We are not responsible for any third-party links, comments, or content shared on TradingView. Any opinions, links, or messages posted by users on TradingView do not represent our views or recommendations. Please exercise your own judgment and due diligence when engaging with any external content or user commentary.
This video represents the opinion of Optimus Futures and is intended for educational purposes only.
Chart interpretations are presented solely to illustrate objective technical concepts and should not be viewed as predictive of future market behavior. In our opinion, charts are analytical tools — not forecasting instruments.

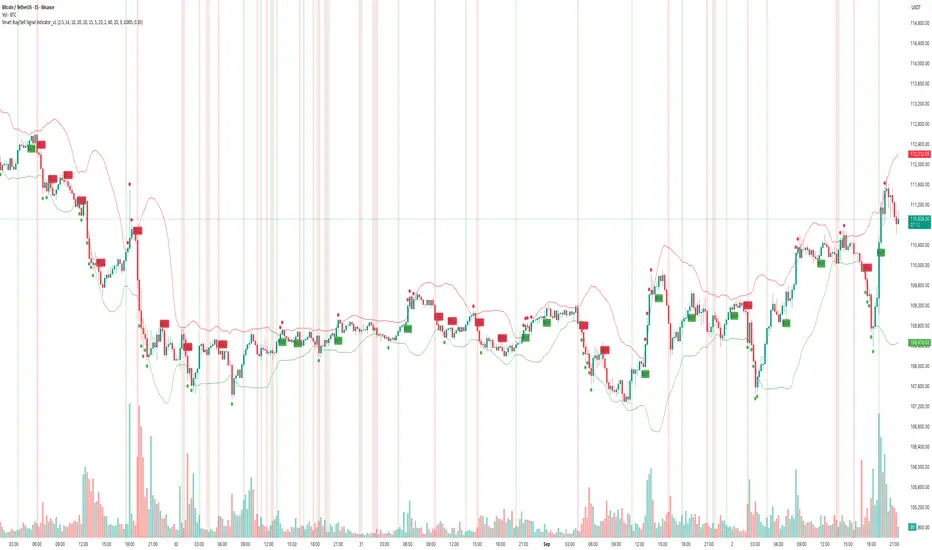
How to Use - Smart Buy/Sell Indicator — Real-Time & ReversalDescription
The chart above demonstrates how the Smart Buy/Sell Signal Indicator combines multiple conditions — Supertrend, RSI, ADX, Confirmation MA, and Bollinger Bands — to highlight potential trade opportunities in real time.
🔹 Core Signals
• Buy / Sell Triggers: Generated when trend, momentum, and volatility filters align.
• Reversal Clouds: Appear when RSI, ADX, and Bollinger extremes suggest potential exhaustion or traps.
🔹 Unique Aspect — Real-Time & Leading
Unlike many lagging tools, this indicator evaluates conditions during the live candle formation.
• If all rules align → signal appears immediately.
• If conditions fail before the candle closes → the signal disappears.
This design allows it to act as a leading signal generator, giving traders early heads-up rather than waiting for full candle confirmation. It emphasizes signal accuracy over repainting, by ensuring only valid conditions remain visible at close.
🔹 What Makes It Different
• Multi-factor confirmation (trend + momentum + volatility)
• Cooldown logic to avoid clustered signals
• Both continuation & reversal insights in one tool
• Adaptive to trending and sideways phases
📊 In the example above (BTCUSDT, 15m), you can see how signals align with both momentum-driven moves and intraday reversals.
⚠️ Note: This is an analytical tool, not financial advice. Performance varies across assets and timeframes. Always backtest and combine with risk management.
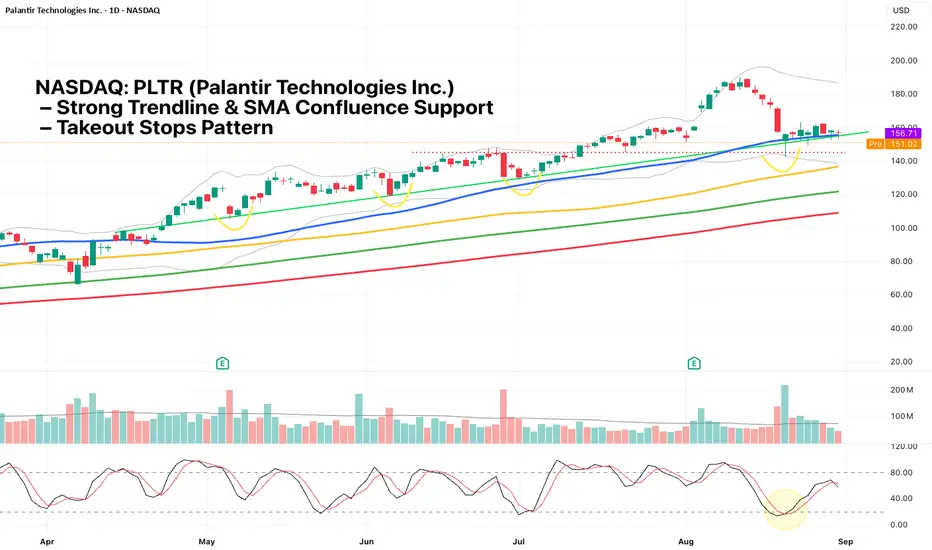
NASDAQ: PLTR – Strong Trendline & SMA Confluence SupportNASDAQ: PLTR Palantir remains in a clear uptrend with the moving averages aligned (SMA 50 > SMA 100 > SMA 150 > SMA 200). Since April, price has consistently traded above the 50-day SMA, finding support on each pullback to the trendline (green line). This trendline has been tested four times over the past six months, the latest on August 20.
On August 20, PLTR formed a hammer candlestick while testing multiple key supports simultaneously:
1) Horizontal support (red dotted line)
2) Cut Lower Bollinger Band
3) Tested 50-day SMA
4) Trendline support (green line)
5) Stochastic in oversold zone
6) Takeout stops pattern: wick flushed below prior lows, likely taking out stops before reversing
This strong confluence of signals suggests buyers are defending the level, offering a favorable risk-reward setup.
Nasdaq Technical Analysis. What Makes Nasdaq a Trader’s Favorite📊 Nasdaq Technical Analysis – Week 15, 2025
This week’s Nasdaq structure suggests a high probability of sideways movement between 19,500 and 18,700,
despite recent macro-driven volatility.
Key headlines include: – U.S. tariff adjustments & China’s 125% retaliation
– March CPI hitting the lowest level since early 2021
– Bond market instability and capital outflows
From a technical perspective:
🔹 volatility on the weekly is overheated — suggesting reduced volatility ahead
🔹 Fibonacci 0.618 near 20,084 may act as short-term resistance
🔹 Ideal long zone sits between 18,600 and 18,700, with invalidation below 18,500
(by 12H closure)
🔹 Ideal long zone sits between 18,000 and 18,300, with invalidation below 17,900
(Just a touch of 17,900 might invalidate this idea)
This analysis includes trendline setups held since 2023, confirming the value of clean charting.
A full structure review from Yearly to 4H charts is included.
No news-based guesswork. Just structured, chart-driven insight.
📌 If this chart aligns with your bias, feel free to save, comment, or follow.

$SNOW Breakout on the HorizonSnowflake (A.I. data storage) NYSE:SNOW , has been trading in VERY tight range for over a month that is much smaller than its normal expected move, which is insane.
1. If it’s at a major support, than its breakout is to the upside (which I’m inclined to believe)
2. If there some crazy news about AI data storage, than it could break below the support.
I am more inclined to believe it’s the former. The point of control on the volume profile is $155-$160/share, so that’s where it is likely heading if it breaks out upward. NYSE:SNOW

BTC/USD Fire the Engines!!!Hi ,there
In green the lines that we will go up and in red the lines that will find support
the game is hard .. I know!!
if you can't do some trades (small time frame) just buy and hold.
there aren't many options..
we know that in the future it will definitely go up and statistically it always seems that it will achieve this but it takes some time (maybe several months or a few years)
Traders, if you liked this idea or if you have your own opinion about it, write in the comments
If you liked this idea don't forget to follow me for more news and updates.
Thanks for reading!

shiba/eur the rise or the set?Hi Traders!
A quick update on shiba !!!!
If the price close up to 1259 then we will see very good returns!!
personally it is the number one asset in my portfolio
(of course there are others).
let's see during the weekend if he can surprise us..
Be careful and always do portfolio management and if you are not in a good mood then go for a walk or read some book!!
Traders, if you liked this idea or if you have your own opinion about it, write in the comments. don't forget to follow me for more news and updates.
Thanks for reading!

The Good the Bad and the Neutral scenarioLet's all wish a happy new year!
Let's all see the ads for the super products
don't worry if you don't .. the company knows how to do it!
* Let's remember those in our local area who need to sell their products (or online) and buy some (good scenario)
* Let's see more ads without buying nothing (Bad scenario for now)
* Let's see what our favourite people do with smoke signals until the market gives us the up or down signal
If you liked this idea or if you have your own opinion about it, write in the comments.
Thanks for reading!


XRP The Fall of the RiseHello fellow traders!
In this analysis we will talk about the XRP
In short! very bad picture!!
still,
1. Cardano Founder Is Done with XRP (u.today)
2. XRP Supporter John Deaton Jumps into SEC v. LBRY Case
3. Ripple, SEC make final bids for a quick win in XRP lawsuit
4.
5..
..
...
and many more to be written!
while price falls Whales add more XRP amid rumors of lawsuit ending
interesting piece..
let's consider this scenario:
coin image is for sale
the price falls more
whales buy a big chunk then the value will rise
the whales sell at a profit and the price falls again and we are in the red... (the good scenario)
then let's wait a little longer and then buy
If you liked this idea or if you have your own opinion about it, write in the comments.
Thanks for reading!

KALA New Drug on the Street Hi Traders
We can't say much here!
As always history has shown us when a new drug goes on the market we have 3 scenarios:
1 we're going up (green path)
2 the medicine is not good we are going down (red path)
3 we don't know what the medicine is like until many people take it let's go sideways (purple path)
with all that is happening at the moment we are following the first scenario the probabilities looks good, but we will see as soon as the index open.
Traders, if you liked this idea or if you have your own opinion about it, write in the comments. don't forget to follow me for more news and updates.
Thanks for reading!

eur/usd Someone is Fishing in the OceanWhen the candles go from big to small (trading volume) then something big is coming...
the chart shows that it is going down..
if the price closes below the strong support (after resistance) then some will make a nice bonus for the holidays..
If you liked this idea or if you have your own opinion about it, write in the comments
Don't forget to follow and like.
Thanks for reading!

BNB/USDHello friends
Today we will see BNB/USD
We don't seem to have much traffic at the moment the price is stuck at the specific point of 282-284. Price should break 286-287 and go ahead to break 293 and hold 300 to be able to make a higher high
otherwise it will make 279-273 easy and we might see 270 as well and if he can't keep it we will see 260 or even lower low. I suggest that we do nothing for now
until we see some trend-volume on the charts .
.
.
Lower low : If the price of a security closes at a lower price than it did at the close of the previous day, which was also a low, then it is referred to as a lower low.
If you liked this idea or if you have your own opinion about it, write in the comments.
Thanks for reading!

HINDALCO INDUSTRIES LTD - Bollinger Band + MACD📊 Script: HINDALCO (HINDALCO INDUSTRIES LIMITED)
📊 Nifty50 Stock: YES
📊 Sectoral Index: NIFTY 500 / NIFTY METAL
📊 Sector: Commodities - Metals & Mining
📊 Industry: Non - Ferrous Metals - Aluminum
Key highlights: 💡⚡
📈 Script is trading at upper band of Bollinger Bands (BB) and giving breakout of it.
📈 MACD is already giving crossover.
📈 Double Moving Averages also giving crossover.
📈 Current RSI is around 66.
📈 One can go for Swing Trade.
⏱️ C.M.P 📑💰- 455.55
🟢 Target 🎯🏆 - 502
⚠️ Stoploss ☠️🚫 - 435
⚠️ Important: Always maintain your Risk & Reward Ratio.
⚠️ Purely technical based pick.
✅Like and follow to never miss a new idea!✅
Disclaimer: I am not SEBI Registered Advisor. My posts are purely for training and educational purposes.
Eat🍜 Sleep😴 TradingView📈 Repeat🔁
Happy learning with trading. Cheers!🥂

Is the SPY carving out a bottom? A Bollinger and MA study. In this video I discuss the importance of the 3rd standard deviation from the 50 SMA on the SPY, QQQ, and NDX. Details in video.
TLDR:
The SPY has found itself at extremes: The Stochastic, the ATR, and the 3rd standard deviation (lower Bollinger Band) on the weekly timeframe all show this.
Pull up the weekly SPY, add the Bollinger Band - go to settings: change the period to 50 and the stnddv to 3, add ATR, add Stochastic, add the 50 SMA - these will paint a picture of the extremes
Study the corrections vs the crashes, 00', 08', 18', 20', 22' - ask yourself: is this a correction or a crash?
Consider the extremes and consider the history of corrections/crashes and how they uses these extremes.
I have heard this argument A LOT last week: " The NASDAQ and IWM are already at -30%.....if the SPY is to go lower that means the NASDAQ may go to -45% and THIS is not possible."
---> I beg to differ, but recognize the importance of the Bollinger bounce. Look at the dot com bubble and the housing market crash, extremes can be used as a trend line for extended periods.
Remember, nothing goes straight down or up, there is always trending days/periods and range days/periods. It is best to be able to quickly identify which type of day/period you are trading in in order to ultimately use your indicators correctly.
Although I remain in the bear camp, I am absolutely open to the idea of a huge massive bounce here before the 200 SMA is tested. This bounce may come with a test of the 50 SMA in the 440's - where is goes from there I am not yet ready to speculate on. Since though I am remaining bearish, I do see a higher probability of the 200 SMA being tested before the real rally to the 50 begins. Either way, I do expect a rally in the near term, news and catalysts aside.
Please watch the video for a more detailed look, and please chart this out yourself to draw your own conclusions.....as these are ONLY my opinions and NOT financial advise.

EU strong Bullish to 1.092 and then Bearish to 1.076Hello Friends
well i really hope you doing great in trading here its where we go there is rising wedge we did reach 1.087 and now will reach the roll great area to see bearish coming to 1.092 so stay bullish until that level 1.092 and watch sings of Bearish Volume coming soon at that level 1.092 hope you enjoy your trading Business with no losses at all
Thanks

BA double bottom!divergence and bollinger bands tightening could be a great klong position for the long term since Boeing is a strong fundamental company!

chf is weakening and the yen is strengthening.I think the franc is weakening and the yen is strengthening. It should definitely fall according to the mentioned harmonic pattern. But it needs to go through red zones called PRZs and then reach its first target, the middle of the Bollinger Band. We can also mention the target of 120,913.

Long FBP.E 333.26
S.L 302.55
T.P 395.57
In this analyse we can see how the movement of the FB stock is inside a channel, and now we are in a lower spot. Adding to this, the fundamental Analysis suggest us that FB is waiting for the quarterly earnings, that are in a good forecast today.
For the technical analysis part we can see that we have a big volume in the pre-market inside. The two indicator with their convergence show that a change of trend is possible. However we aren't now to enter in the market but the volume that will be generate at the starts of the session of today can delete our position.
BE CAREFULL
no financial advise

CVCUSDTCVCUSDT is moving in a channel. the upper bound of the channel is a strong resistance bc it covers with 0.37 resistance that makes it more valid. for now if bitcoin close 4H candle above 50K, we can think about buying new alts. so for now be careful.

SOLBTCthe trend line is broken. possible targets are shown by Fibo levels. we may have a pull back to the trend line, so consider that too.

BTCUSDTdue to the previous post, divergence was confirmed and the pullback has been completed. bitcoin price could not move above the trendline. possible supports are shown. and THE DAILY negative divergence is also seen in the RSI.
