Bitcoin Fractal shows the turn around. 4hr vs. Daily fractalI found a daily fractal from a previous cycle Bitcoin Bottom turn around.
It seems to be a perfect fit over the current 4hr chart.
If this plays out Bitcoin will turn North again by March.
Bottom

Bandhan Bank - first major trend reversal! Upside to ₹215–230Thesis:
Bandhan Bank has broken out above the ₹185 zone after constructing a multi-month rounded base between ₹130 and ₹185. This marks the first major structural reversal after a multi-year downtrend. The breakout is backed by above-average volume and positive momentum.
Technical Structure:
Breakout Level: ₹180
Current Price: ₹189.64
Volume Surge: 11.4M (above 20-day average)
RSI (14): 67.5 — trending strong, near breakout zone
Targets:
₹215 ( 13.8% upside ) — measured move of near-term range
₹259 ( 25% upside ) — major horizontal resistance from 2022
Disclaimer:
Not a recommendation. For educational use only. Position already held from earlier. This post reflects personal strategy execution in a structured portfolio.

BTCUSD Double-bounce off recent lows. Get someThis quick video highlights my predictive modeling results for BTCUSD.
I normally don't post much about BTCUSD - but this stood out as a clear opportunity for some traders.
Pay attention. These won't be huge moves - but they are very clear opportunities for skilled traders.
Get some.

BTC - Where the 2026 Bottom Might Actually FormLet me be clear from the start.
This is not about calling a bottom today.
It’s about comparing this cycle to the previous ones.
📉 From a structural point of view:
Price is trading below the key moving average, and as long as that MA is not reclaimed to the upside, the trend remains bearish.
At the same time, momentum confirms this view.
The MACD has flipped bearish, which historically marks the transition from expansion into a corrective cycle.
In previous BTC cycles, the real bottom never formed until both conditions were met:
- MACD flips back bullish
- Price reclaims the moving average
Until that happens, we stay in a bearish or corrective regime, even if price bounces short term.
🧠 Now zooming out.
When you compare this structure to prior cycles, Bitcoin tends to:
• Correct deeply
• Find support at prior major resistance
• Reset momentum near long term demand
• Then flip trend again
On this chart, that area is very clear.
The green zone around 55k to 65k aligns with:
• Previous cycle highs
• Strong historical demand
• The lower boundary of the long-term rising structure
If history rhymes again, this is where we would expect:
• Momentum to stabilize
• MACD to start curling bullish
• Price to eventually reclaim the moving average
⏳ Timing wise , based on previous cycles, this process usually takes time.
That points toward late 2026, roughly October and beyond, not before.
⚠️ Disclaimer: This is not financial advice. Always do your own research and manage risk properly.
📚 Stick to your trading plan regarding entries, risk, and management.
Good luck! 🍀
All Strategies Are Good; If Managed Properly!
~Richard Nasr

$BTC BOTTOM IN - Dragonfly Doji Reversal CandleBOTTOM IS IN
⚠️ Need to reclaim ~$95k within the next couple days to confirm, but I’m confident.
🐉 Printed a Dragonfly Doji Reversal candlestick with a Volume breakout to accompany.
🐉 RSI also sitting at lowest since Liberation Day.
🐉 Death Cross historically marks bottoms.
🐉 This 29% correction lines up perfectly with prior ones before next impulsive move up.

$BTC VERY Close to Forming a BOTTOMReceiving the end of cycle calls / texts from normie friends - one of my best indicators.
Bullish Divergence on the Daily.
Need some closes above the EMA9 ~$103k to confirm.
Then $107,5 next up.

BTC MARKET UPDATEThe bears couldn't push the price below 16800 Support. The price bounced from the 16800 support due to the massive BUY ORDER BLOCK and moved above the 17000 key level. If we notice the daily timeframe then the price is under the consolidation box for a long time, any movement outside this box with a strong confirmation will be massive (whether upside or downside) Trade Carefully and Stay Tuned!

ZEN (Horizen) Could Behave Well In The Weeks AheadIts funny how human psychology may repeat Beauty is that charts can visually show you patterns, no matter the timeframe. Its amazing how human psychology may repeat itself. Beauty here is that charts can visually show you human psychology in patterns, no matter the timeframe you're comparing them to.
It has many similar tokenomics as Zcash (ZEC)
DISCLAMER:
Non of this should be take as a financial advise. Be well.

BANANA TIME FOR ETHEREUM? or BIG SHORT? #ETHInstitutional holdings: Public companies accumulated over 1.2M ETH, with strategies leaning into staking and liquid staking for reserve yield.
Supply and fees: Circulating supply rose 0.1% QoQ to 120.7M ETH; network fees fell to multi‑year lows as activity migrated to L2s and alternative L1s.
Staking: Total staked ETH climbed to 35.7M (29.6% of supply), with USD stake value up 43% to $89.2B
Bullish momentum narrative: Multiple outlets point to consolidation below major resistance with upside targets between $4,500 and ~$6,900 contingent on breakouts and institutional flows resuming.
On-chain/structural context: Continued high staked share (~30–35% of supply) and ETF rotation narratives underpin reduced liquid supply and potential resilience, though breakouts hinge on clearing $4,500–$4,975 resistance and defending ~$3,800 support
Main news that captured my Attention is:
Animoca Brands plans to go public on Nasdaq via a reverse merger with Currenc Group, expected to close in 2026.
The Hong Kong-based firm, valued at $6 billion in 2022, has invested in over 600 projects across gaming, DeFi, NFTs, and metaverse sectors.
The merger will make Animoca the world’s first publicly-listed, diversified digital assets conglomerate, with Animoca owning 95% of the new entity.
Currenc will divest from its current operations, including a digital remittance platform, as part of the deal.
Animoca’s digital asset treasury includes Bitcoin, Ethereum, Solana, and MOCA, with a market cap of $208 million for MOCA.
The merger is subject to Australian regulatory approval; Animoca previously traded on the Australian Securities Exchange before delisting in 2020.
Ethereum Layer 2 project MegaETH announced its third community-led raise, starting at a $1 million valuation with a cap of $999 million via an English auction.
The raise is conducted through Sonar, Coinbase-acquired ICO platform founded by Jordan “Cobie” Fish.
Coinciding with the raise, Hyperliquid launched MEGA pre-market perpetuals, quickly valuing MegaETH at $6 billion pre-market, with a current FDV of $5.2 billion.
If the raise hits the maximum valuation, ICO participants could see a 5x return; early Echo round investors are up 23x, and Fluffles NFT holders nearly 10x.
The event marks MegaETH’s third community-focused funding effort, emphasizing long-term social and onchain engagement.
The rapid valuation surge signals strong investor interest ahead of the official launch.

$FI Fiserv - Time to Bottom feed - AGAINFiserv, Inc NYSE:FI
We recently troughed on NASDAQ:TEAM for a little sour sustenance. Like the degenerate catfish we are, we shall now dine on the stink bait that is NYSE:FI Fiserv.
Pinch your noses and pull out your pocketbooks. This thing is on clearance with an expiration date of now. We might get sick and have dumpy diarrhea from this one.
Hope you have strong stomachs.

DXY relative perf. to predict market tops.Using intermarket analysis. During expensive markets, demand for US dollar grows - and often it correlates with stock market tops. Step further - we can use intermarket analysis of DXY/SPX. Look for trend break out and Higher Lows in the structure. ✅

PUMPBTC showing signs of reversal_Watch for short term upsidePUMPBTC has touched its bottom and is now showing signs of recovery. A short-term bullish move is likely if momentum continues to build.
Always manage risk wisely and wait for confirmation before entering.

IS BSV READY FOR NEW CYCLE MOVE TO $100 - 2025Bitcoin SV is showing on the short-term view a trend that can have an upcoming increase in volume. Further checking if SV is going to confirm the $25-28, which can lead to a breakout back to up $40 level.

Oil Playing Twister: Triple Bottom or Quadruple Pretzel?A Triple Bottom Walks Into a Bar…
Crude Oil (CL) has been busy doing something traders love and hate at the same time: building bottoms. First, it carved a neat Triple Bottom on the daily chart — textbook stuff. Everyone lined up at 66.68 waiting for the breakout champagne to pop.
But what did price do? Instead of exploding higher, it slammed on the brakes and took a detour straight back to support. Typical CL — always keeping traders on their toes.
Now we’re staring at the possibility of a Quadruple Bottom. Not a typo. Yes, they exist, but you don’t see them every day. Like spotting a unicorn in Times Square.
Why We Care About 66.68
That level isn’t just random. It’s the line where:
The Triple Bottom neckline lives.
The Supertrend upper band hangs out.
And, conveniently, the breakeven of our options spread sits.
In other words: get above 66.68 and suddenly this setup has wings. Target? Around 70.63, where UFO resistance is waiting to greet us.
The Fun Part: Bull Call Spread
Instead of swinging a giant futures bat and risking unlimited pain, we play it smarter with a Bull Call Spread:
Buy the 65 Call (Nov-17)
Sell the 71 Call (Nov-17)
Pay about 1.75 points (≈ $1,750 per standard spread, ≈ $175 if you go micro).
That’s it. Risk capped, reward mapped. Max loss? $1,750. Max gain? $4,250.
And yes, the breakeven is… drumroll… 66.8. Same line as the chart breakout. Love when math and pictures line up.
Plot Twist: Cheaper Now, But…
Here’s the kicker: because price dipped back into support, the spread might actually be cheaper right now. Sounds good, right?
But there’s a catch. Waiting for the breakout confirmation could make the spread pricier later, shrinking your reward-to-risk. Classic trading dilemma: do you want cheaper tickets with less confirmation, or more expensive tickets after the bouncer checks your ID?
Risk in 3 Sentences
Keep your trade size sane.
Don’t marry the setup if price dumps below the bottoms.
If CL rushes toward 70, take the money and run (or at least roll the short strike higher).
Bottom Line
Crude Oil is still building its base. Maybe it’s a Triple Bottom. Maybe it becomes the rare Quadruple Bottom collectors dream about. Either way, the play is the same: breakout above 66.68, aim for 70.63, and do it with a defined-risk Bull Call Spread that doesn’t keep you up at night.
Sometimes the market is dramatic. That’s why we trade it. 🎭
Want More Depth?
If you’d like to go deeper into the building blocks of trading, check out our From Mystery to Mastery trilogy, three cornerstone articles that complement this one:
🔗 From Mystery to Mastery: Trading Essentials
🔗 From Mystery to Mastery: Futures Explained
🔗 From Mystery to Mastery: Options Explained
When charting futures, the data provided could be delayed. Traders working with the ticker symbols discussed in this idea may prefer to use CME Group real-time data plan on TradingView: www.tradingview.com - This consideration is particularly important for shorter-term traders, whereas it may be less critical for those focused on longer-term trading strategies.
General Disclaimer:
The trade ideas presented herein are solely for illustrative purposes forming a part of a case study intended to demonstrate key principles in risk management within the context of the specific market scenarios discussed. These ideas are not to be interpreted as investment recommendations or financial advice. They do not endorse or promote any specific trading strategies, financial products, or services. The information provided is based on data believed to be reliable; however, its accuracy or completeness cannot be guaranteed. Trading in financial markets involves risks, including the potential loss of principal. Each individual should conduct their own research and consult with professional financial advisors before making any investment decisions. The author or publisher of this content bears no responsibility for any actions taken based on the information provided or for any resultant financial or other losses.

American Eagle Oufitters - Bottoming outNYSE:AEO saw a strong bullish reversal from the bottom and with the 15% jumped on Monday, the stock has briefly broken above the resistance line at US$13.02. Given the strong momentum, AEO will likely confirmed the double bottom and reached US$20.00.
Momentum:
Long-term MACD has performed a crossover at the bottom and histogram is positive. Stochastic has confirmed the oversold crossover and 23-period ROC is rising and stay positive on the high note. Volume spikes upon break out

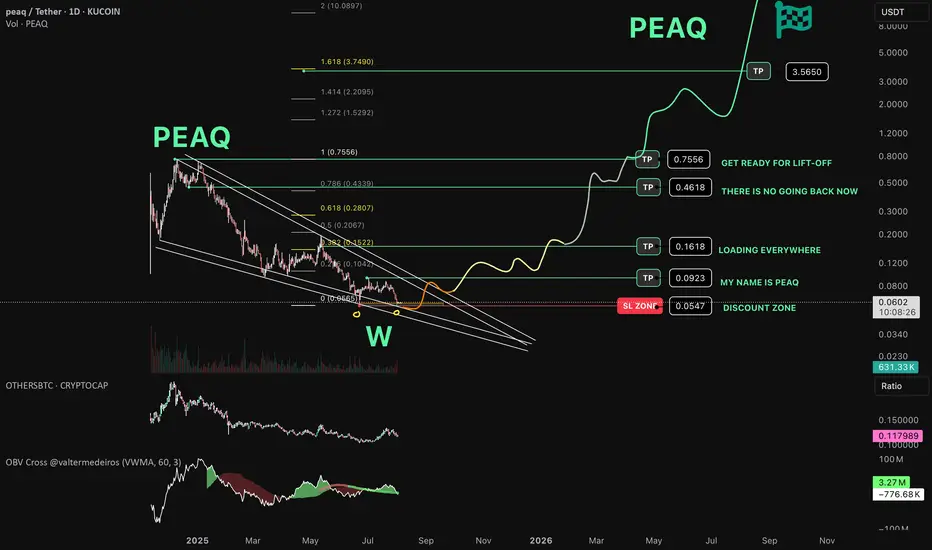
PEAQ Network about to make another pea(q) ? Bottom can be IN!
// ==================================
// ====THE===========================
// ========MACHINE=============^^====
// ===============NEEDS===TALK=======
// ====================TO============
// ==================================
Is this the time?
Chart Recap
🔍 Pattern:
Price formed a falling wedge pattern, which typically signals a potential bullish reversal.
A large W-shaped double bottom pattern is highlighted at the wedge's base, adding strength to the bullish thesis. Can this be the awaited bottom?
🟢 Accumulation & Support Zone :
"DISCOUNT ZONE" is marked near $0.0547, aligned with the wedge support.
Repeated touches at this level suggest strong buyer interest — also called "MY NAME IS PEAQ" and "LOADING EVERYWHERE"
🚀 Bullish Scenario & Targets:
If the wedge breakout plays out:
TP1: $0.0923 – early target near the local range high.
TP2: $0.1618 – aligns with the 0.382 Fib level.
Labeled as “LOADING EVERYWHERE”
TP3: $0.4618 – near the 0.618 retracement.
“THERE IS NO GOING BACK NOW”
TP4: $0.7556 – previous swing high.
“GET READY FOR LIFT-OFF”
TP5: $3.5650 – long-term Fib extension target (1.618).
Ultimate moonshot-level target.
Why hello there ETH, can we be friends?barring any black swan events - now that we have the new ETH release forthcoming, the bitcoin halving in the future, and the bear market behind us (fingers crossed?), this is the trend - we'll see some stops and volatility at the major support/resistances for trading.
I'll just be holding for the next year or two. Less stress!

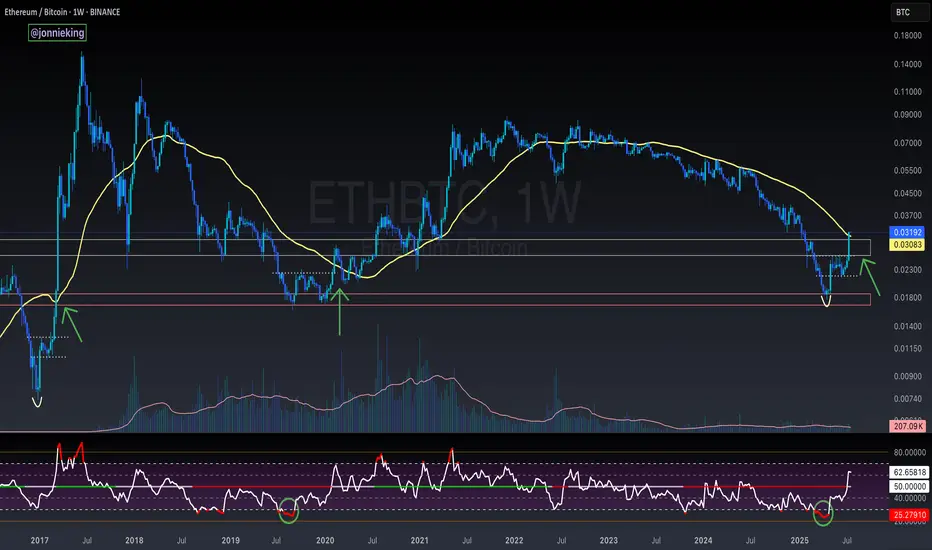
$ETH Closes Above the 50WMA - Alt Season Signal ALT SEASON ALERT 🚨
CRYPTOCAP:ETH Closed the Week ABOVE the 50WMA
Historically this has signaled the start of ALT SEASON.
*NOTE* 2020 had the pandemic hiccup.
This bottoming pattern looks very similar to the 2017 explosion.
Also the RSI matches the 2019 bottom.
Dare I call it yet bros? 🤓
$SOL Local Bottom FormingCRYPTOCAP:SOL closed the day back within the POI.
RSI oversold.
Should see a retest ~$136 to confirm the local bottom.

ETH/BTC Looking Juicy ...Well... not a bad time to scoop some ETH at these low levels for some long term hold...
As always, DYOR!
Peace,
Subawu

Bitcoin Bottom- i saw many traders using vrvp or vpvr like and claiming BTC will go 10k.
- They just don't know how to use this tool and didn't understand how it works.
- if u don't know how to use a tool, simply don't use it. so less people's will rekt. this is an advanced trading tool.
- The Timeline of those tools are VERY IMPORTANT, they cannot be set up from 2015 or 2013.
What happened when BTC was Bearish :
- Actually when BTC dipped from 30,000$ ish, the columns started in the vrpv darker zone ( Less Demand )
- BTC reached 20,000$ and columns started to grow ( Demand Zone but Fear "Retailers" )
- Then dipped 17,500$ and the columns diminished size ( Good Demand " Smart Money" )
- This is at this point that you can detect a BOTTOM Zone. ( Darker zones + Small Columns )
Then what happened when BTC was Bullish :
- if you watch VRVP when BTC was growing you will notice the inverse.
- The Main demand was around 30,000$.
- BTC Reached 50,000$ and VRVP started to be darker ( More Demand impulse "FOMO" ).
- Then BTC reached 70,000$ ( No Demand ). ( Darker zones + Small Columns )
- i will post an exemple under this post to show a bad use of VRVP/VPVR. please don't use it that way.
Happy Tr4Ding !

$NKE potential bottom around $58-63- For NYSE:NKE longs, they gotta feel 10-15% more downside for potential bottom. $63 is the 200 SMA on monthly scale where it could potentially bottom.
- Ideally, NYSE:NKE has been losing market share to NYSE:ONON , deckers etc. On top of that there's zero innovation in the shoes and design. Premium price for Nike seems unjustified.
- Fair value based on multiple compression seems to be around $78-85. Therefore, buying it in 70s isn't worth holding. I believe parking money here is like betting on dead horse as of now.
- Turn around in brick and mortar business takes long time and patience as compared to SAAS business where one could see positive turn around within 1-2 quarters.
- CEO is a veteran which is a plus but investors should be cautiously optimistic.
- Buying around $58-63 provides good upside adjusted for slow rate of pace of growth and competition fears.

#PARTIUSDT is showing signs of a reversal🚀 The price BYBIT:PARTIUSDT.P is showing signs of a reversal after a prolonged downtrend.
🚀 The scenario becomes more likely if the price holds above $0.1520 with increasing volume.
🚀 Watch for a breakout and confirmation above the $0.1500–$0.1520 zone — this would strengthen the bullish setup.
🚀 If volume picks up during the continuation of the move, a quick push toward $0.18 is possible.
📈 LONG BYBIT:PARTIUSDT.P from $0.1533
🛡 Stop loss: $0.1492
🕒 Timeframe: 1H
✅ Overview:
➡️ The price has broken out above the Bearish Flag, confirming a break in the downtrend structure.
➡️ The Double Bottom formation increases the likelihood of an upward move.
➡️ Entry at $0.1533 is just above the resistance zone and confirms the breakout.
➡️ The upward potential remains toward $0.1600 and beyond, aiming for the POC volume area.
🎯 TP Targets:
💎 TP 1: $0.1555
💎 TP 2: $0.1575
💎 TP 3: $0.1600
📢 Support zone: $0.1500–$0.1510 — must hold to maintain the bullish structure.
📢 If price consolidates above $0.1555, expect a potential acceleration toward $0.1600.
📢 A drop below $0.1492 invalidates the scenario — stop is mandatory.
🚀 BYBIT:PARTIUSDT.P breaks key level — bullish signal confirmed! Watch for continuation!
