The key is whether it can rise above 4403.87
Hello, traders.
Follow us to get the latest information quickly.
Have a great day.
-------------------------------------
(ETHUSDT 1W chart)
The formation of an upward trend line (A) created an upward channel from (A) to (B).
Therefore, the key is whether it can continue to rise along this upward trend line.
If the upward movement fails, we need to check whether the price rises along the rising trend lines (1) and (2).
Therefore, the 3900.73-4107.80 range is a crucial area for sustaining the upward trend.
In this context, we expect a significant period of volatility to begin around the week of November 24th.
This period of volatility could continue until around the week of January 12th, 2026.
-
(1M Chart)
If this month closes with a bearish candle, forming an upward trend line (a), the key question is whether the price can rise along trend line (a).
If not, there's a possibility of touching the upward trend line (2), so we need to consider a response plan.
-
(1D Chart)
The key is whether the price can sustain above the uptrend line (1) and rise above 4403.87.
To do this, we need to see if it can break above the downward channel created on the 1D chart.
Therefore, we need to observe how the price moves after the volatility period around November 5th.
The HA-High ~ DOM(60) section (4393.04-4780.15) on the 1W chart overlaps with the HA-High ~ DOM(60) section (4403.87-4749.30) on the 1D chart, so it's likely to act as resistance.
------------------------------------
The basic trading strategy is to buy in the DOM(-60) ~ HA-Low section and sell in the HA-High ~ DOM(60) section.
However, if the price rises from the HA-High to DOM(60) range, a step-like uptrend is likely, while if it falls from the DOM(-60) to HA-Low range, a step-like downtrend is likely.
Therefore, a split trading strategy is recommended.
To maintain a step-like uptrend in the DOM(-60) to HA-Low range,
1. The StochRSI indicator must be rising. If possible, it should not enter the overbought zone.
2. The On-By-Value (OBV) indicator must be rising. If possible, it should remain above the High Line.
3. The TC (Trend Check) indicator must be rising. If possible, it should remain above the 0 level.
If the above conditions are met, the uptrend is likely to continue.
If not, a high point is likely to form, so you should consider a countermeasure.
-
Thank you for reading to the end.
I wish you successful trading.
--------------------------------------------------
Breadth Indicators

See if it can rise above 110644.40-111696.21
Hello, fellow traders!
Please "Follow" to always get the latest information quickly.
Have a great day.
-------------------------------------
(BTCUSDT 1W Chart)
Support levels for maintaining an uptrend are:
1st: 104463.99-108353.0
2nd: 87814.27-93570.28
Support must be found within the first and second levels above.
To rise above the right Fibonacci ratio of 2.618 (133889.92), which is my target level, the price must rise above the uptrend line (1) and maintain its position.
In other words, the price must rise above the HA-High indicator level of 116259.91 on the 1W chart and maintain its position.
-
(1D Chart)
The key is whether the price can find support near 10443.99-108353.0 and rise above the 110644.40-111696.21 range.
If the price fails to rise, it is highly likely to fall further, so we need to consider countermeasures.
Since the M-Signal indicator on the 1W and 1D charts is passing near the 110644.40-111696.21 range, I believe the trend will likely be determined by the presence of support.
The HA-High ~ DOM(60) range on the 1W chart is formed within the 116,259.91-119,086.64 range, while the HA-High ~ DOM(60) range on the 1D chart is formed within the 120,760.81-124,658.54 range.
Therefore, the 116,259.91-124,658.54 range is likely to act as resistance.
Therefore, I believe a surge in capital is needed to break above this range.
-
Therefore, I believe BTC dominance should rise while USDT dominance should decline.
If BTC dominance rises, most altcoins are likely to move sideways or decline, so altcoin trading requires a strategy to counter this.
BTC dominance is likely to rise to around 61.73,
USDT dominance is expected to fall below 4.55 and break above the resistance level.
-
If both BTC and USDT dominance decline simultaneously, an altcoin bull market could begin.
However, BTC dominance must decline below 55.01, and USDT dominance must also decline below 4.91.
The next period of volatility is expected to occur around October 25th (October 24th-26th).
-
Thank you for reading.
We wish you successful trading.
--------------------------------------------------
- This is an explanation of the big picture.
(3-year bull market, 1-year bear market pattern)
I will explain in more detail when the bear market begins.
------------------------------------------------------

Volatility Period: Around October 22nd (October 21st-23rd)
Hello, traders!
If you "Follow" us, you'll always get the latest information quickly.
Have a great day.
-------------------------------------
(TSLA 1M Chart)
The key is whether the price can rise above the target level of 488.54 by following the rising channel.
If the price fails to rise, we should check for support near 381.59.
-
(1W Chart)
The rising trend line (1) has formed, forming an ascending channel.
Therefore, the key is whether the price can maintain above the rising trend line (2) and rise along the rising channel.
The HA-High ~ DOM(60) range on the 1W chart is formed in the 382.40-421.06 range. If the price remains above this range, a stepwise uptrend is expected to continue.
-
(1D chart)
The key question is whether the price can continue its upward trend toward 488.54 after passing through this volatile period around October 22nd (October 21st-23rd).
To do so, we need to see if it can find support and rise around 439.60-442.79.
-
Thank you for reading to the end.
I wish you successful trading.
--------------------------------------------------

Check if 224.47-260.42 can be supported
Hello, fellow traders!
If you "Follow" us, you'll always get the latest information quickly.
Have a great day.
-------------------------------------
(ZECUSDT 1M chart)
You might be wondering why it's rising, but you don't need to know why.
Because it's already rising.
It's a sharp rise, breaking above the important support and resistance area of 56.29-78.91.
The key is whether the price can hold above the Fibonacci 1.618 (338.52) level.
If not, we need to check for support near 220.20, the previous DOM (60) indicator level.
Since the chart was broken by a surge, I believe the next support period is crucial.
-
(1W chart)
The next volatility period is expected to be November 3-23, around the week of November 10.
-
(1D chart)
As mentioned earlier, since the chart was broken by a surge, I think we can calculate the next volatility period based on the next support period.
Until then, we need to see how the price moves after this volatility period, which runs around October 21 (October 20-22).
Looking at the current 1D chart, the HA-High ~ DOM(60) range is forming between 224.47 and 260.42. Therefore, we need to see if it can find support within this range and rise.
If it falls below 220.20, it could fall to around 115.72, so we should consider a response plan.
-
Thank you for reading to the end.
I wish you successful trading.
--------------------------------------------------

Solana Price Prediction SOL Defends $200 as DEX Volumes Beat ETHSolana (SOL) is holding $200 amid buyer defense of key trendline support, showcasing resilience as its DEX volumes surpass Ethereum's. Trading near $203 after stabilizing from $180–$185 lows, SOL benefits from surging DeFi activity, with daily DEX volume at $5.23 billion—16.3% of all blockchain activity—eclipsing Ethereum's $4.44 billion. This dominance, driven by low fees and memecoin frenzy, marks 10 consecutive months of Solana leading, with $124 billion in July trades 42% higher than ETH. On-chain metrics show TVL up 27.3% monthly and 83% YTD developer growth to $15.3 billion, signaling ecosystem strength. This article analyzes SOL's price action, DEX lead, and forecast. Position for SOL's potential rebound.
SOL's Trendline Defense and DEX Supremacy
SOL's buyers are defending the ascending trendline at $180–$185, rebounding to $200.55 after a dip to $178, with RSI at 58 signaling bullish momentum. The daily chart shows a falling wedge breakout potential, with MACD crossover (+0.12) targeting $215–$220 short-term. Fibonacci support at $170 holds, resistance at $205–$210. DEX volumes flipped Ethereum again, with Raydium capturing 49.2% share and $333 billion Q1 volume, fueled by Pump.fun (34.5% Q4 share).
On-chain: 33 million to 44 million daily transactions and 72 million to 106 million active users reflect DeFi revival, with liquid staking +$2.1B, lending +$440M, and DEX +$985M since September. Memecoin share fell to under 30%, stablecoins at 58%, indicating maturation. Sentiment is 71% bullish, correlating 0.7 with ETH, but $200 tests as support—break below risks $170, above signals $230.
Price Prediction: $200 Hold or $400 Surge?
Short-term: SOL could reclaim $215–$220 if $200 holds, with ETF speculation (90% approval odds) adding fuel. Analysts forecast $400 max by 2025, or $201 by mid-October, driven by ecosystem growth. Bull case: DeFi snowball effect pushes $500, bear case: $180 retest on delays. TVL and developer surge support $200 as floor.
Trading Signals: RSI and MACD
Based on recent trends:
SOL ($203): RSI at 58 (bullish). Bullish MACD (+0.12)—target $220 (8% upside). Fibonacci support at $180, resistance at $205.
ETH ($4,500): RSI at 58. Bullish MACD (+0.12)—target $5,200 (15% upside). Support at $4,200, resistance at $4,760.
Overall: RSI 58 signals longs at supports for 8–15% gains. Risks: delays (5–7% dip); hedge with USDC.
Conclusion: SOL's DEX Lead Signals Strength
SOL defending $200 as DEX volumes beat Ethereum underscores DeFi dominance, with RSI 58 and bullish MACD targeting $220. Buy the dip for ecosystem-driven upside—watch TVL for confirmation.
What’s your SOL target? Comment below!
#SolanaPrice #SOLPrediction #DEXVolume #Solana #TradingSignals
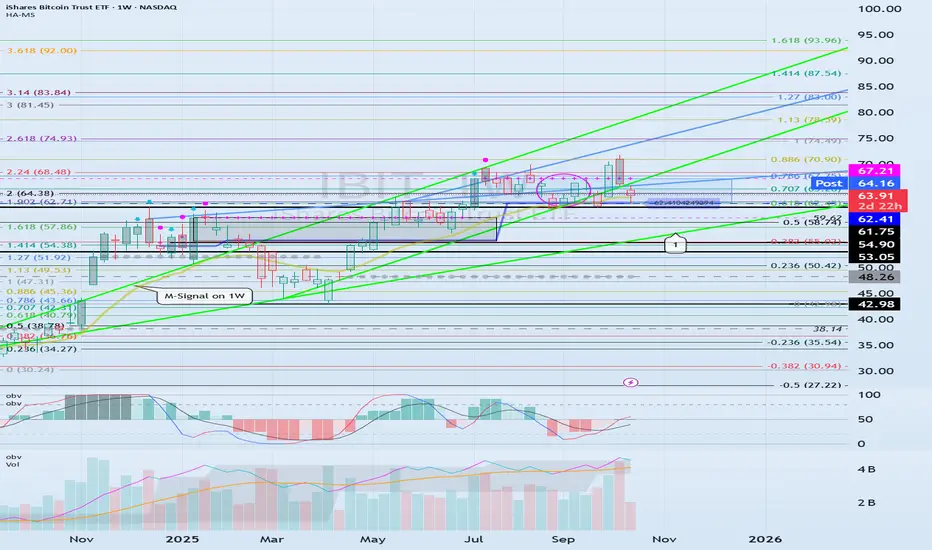
The key is whether it can rise above 67.21
Hello, traders. Nice to meet you.
By "Following," you can always get the latest information quickly.
Have a nice day today.
-------------------------------------
(IBIT 1W Chart)
Since the chart was created recently, the M-Signal indicator for the 1M chart is missing.
However, the HA-High and DOM (60) indicators indicate a stepwise upward trend.
The key question is whether the price can maintain its upward momentum above the HA-High ~ DOM (60) range of 62.41-67.21.
If it falls below 62.41, it is likely to touch the uptrend line (1) and re-establish the trend.
At this point, the key support and resistance levels are 53.05-54.90.
We need to check for support near this 53.05-54.90 range.
If it rises above 67.21, the target levels are:
1st: 74.93
2nd: 93.96
The target levels are expected to be around the first and second levels above.
--------------------------------------------------------
Because BTC is linked to the stock market and is being linked to it, it is highly likely to be affected by stock market movements.
However, it is always advisable to check the fund flow in the coin market first, as the coin market itself can exhibit price defense.
-
Thank you for reading to the end.
I wish you successful trading.
--------------------------------------------------
Volatility Period: October 16 (October 15-17)
Hello, traders!
Follow us to get the latest information quickly.
Have a great day!
-------------------------------------
(ETHUSDT 1D Chart)
Following BTC, ETH is also entering a volatility period.
This period of volatility for ETH is expected to last until October 16th (October 15th-17th).
After this period of volatility, the key question is whether the price can find support around 3900.72-4372.72 and rise above 4403.87 to maintain its price.
If the price fails to rise, it is expected to encounter the M-Signal indicator on the 1M chart, so a response plan should be considered.
-
(1M chart)
The StochRSI indicator on the 1M chart is entering an overbought zone, potentially limiting its upward movement.
Therefore,
1st: 3900.73-4107.80
2nd: 3321.30-3438.16
We need to determine whether the price can rise after finding support near the 1st and 2nd levels above.
In other words, we need to see if the price remains above the M-Siganl indicator on the 1M chart.
-
(1W chart)
Looking at the 1W chart, the HA-High ~ DOM (60) range is formed in the 4393.04-4780.15 range. Therefore, a rise above this range is necessary for a stepwise uptrend.
Ultimately, the key question is whether the price can rise above the 4393.04-4780.15 range.
----------------------------------
Therefore, the key question is whether the 4393.04-4780.15 range, which corresponds to the HA-High ~ DOM(60) range on the 1W and 1D charts, can rise after this period of volatility.
As I always say, to break above this important point or range and continue the uptrend,
1. The StochRSI indicator must be trending upward. If possible, it's best to avoid entering the overbought zone.
2. The On-By-Sign-Observable (OBV) indicator must be trending upward. If possible, it should remain above the High Line.
3. The TC (Trend Check) indicator must be trending upward. If possible, it should remain above the 0 level.
If the above conditions are met, the uptrend is likely to continue.
It's recommended to draw support and resistance points or ranges on the 1M, 1W, and 1D charts and utilize auxiliary indicators to determine the significance of these points or ranges.
When drawing support and resistance points or zones, we often think of them as important, but it can be difficult to recognize how important they actually are.
Therefore, when drawing support and resistance points or zones, it's important to be able to develop a basic trading strategy.
Once you've established a basic trading strategy, the key to trading is figuring out how to maintain that strategy and respond accordingly.
No matter what chart analysis you use, you'll ultimately need to draw support and resistance points or zones.
Therefore, the first step is to draw support and resistance points or zones on the 1M, 1W, and 1D charts.
Next, you should check auxiliary indicators to determine the importance of the drawn support and resistance points or zones and determine whether you should respond.
To achieve this, you need to understand your investment size and how to manage your reserve funds.
You should always keep a certain portion (approximately 20%) of your total investment in cash.
This allows you to respond to volatility when it occurs.
If you've invested too much money in a single coin (token, stock), it's a good idea to sell some of it when the price rises to a certain level and secure cash.
Ultimately, overcoming the relentless volatility of the beginning and achieving profit depends on how you manage your funds.
-
Thank you for reading to the end.
I wish you successful trading.
--------------------------------------------------
Support around 212.91 is crucial
Hello, fellow traders.
By "Following," you'll always get the latest information quickly. Have a great day today.
-------------------------------------
(SOLUSDT 1W Chart)
The chart may look complicated due to the drawn lines, but the key is whether the price can rise above the boxed area.
In other words, whether the price can rise above the 179.53-237.60 range and maintain its upward momentum is crucial.
-
(1D Chart)
The HA-Low indicator on the 1D chart is showing signs of forming at the 212.91 level.
Therefore, if support is confirmed around 212.91, it would be a good time to buy.
However, the HA-High ~ DOM (60) range has formed in the 236.88-237.60 range, so we need to see if it can break above this range.
If the upward breakout fails, it's time for a partial sell-off.
-
To continue the uptrend by breaking above a key zone or point,
1. The StochRSI indicator must be trending upward. If possible, it should be below the overbought level.
2. The On-By-Value (OBV) indicator must be trending upward. If possible, it should remain above the High Line.
3. The TC (Trend Check) indicator must be trending upward. If possible, it should remain above the 0 level.
If the above conditions are met, the uptrend is likely to continue.
-
Thank you for reading to the end.
I wish you successful trading.
--------------------------------------------------

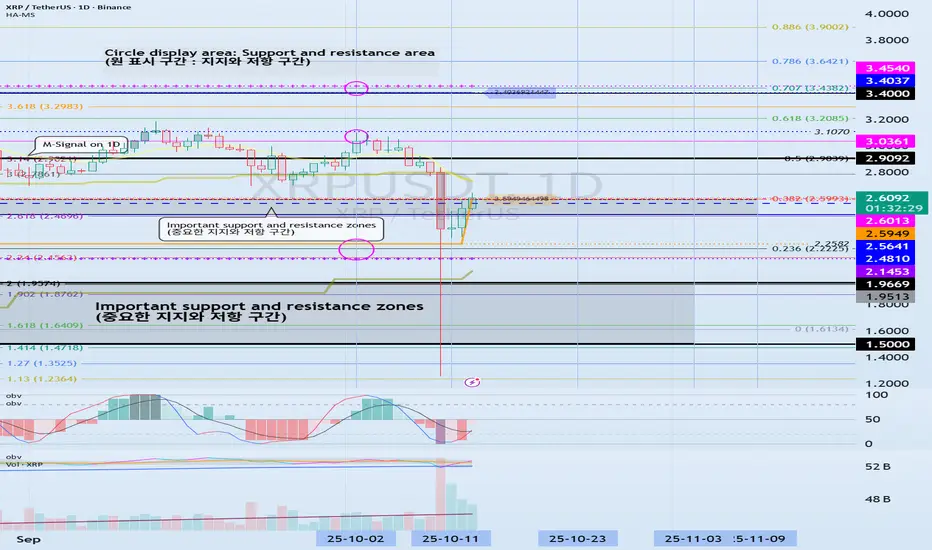
Next volatility period: Around October 23rd (October 22nd-24th)
Hello, traders!
By "Following," you can always get the latest information quickly.
Have a nice day today.
-------------------------------------
(XRPUSDT 1D Chart)
After this period of volatility, the HA-Low indicator on the 1D chart is forming at the 2.5949 level.
Therefore, if the HA-Low indicator forms at the 2.5949 level, it will be important to determine whether support is found near that level.
Furthermore, the HA-High indicator on the 1M chart is forming at the 2.4810 level.
Therefore, the key question is whether the price can find support and rise near the important support and resistance levels of the left Fibonacci ratio (2.618 (2.4696)) and the right Fibonacci ratio (0.382 (2.5993)).
However, to continue the step-up trend, the price must rise above 3.4037-3.4540 and hold, so you should also consider a countermeasure.
-
The basic trading strategy is to buy in the DOM(-60) ~ HA-Low range and sell in the HA-High ~ DOM(60) range.
However, if the price rises in the HA-High ~ DOM(60) range, a step-up trend is likely, while if the price falls in the DOM(-60) ~ HA-Low range, a step-down trend is likely.
Therefore, the basic trading strategy should be a segmented trading strategy.
Currently, the HA-Low indicator is showing signs of forming, so if support is confirmed near the HA-Low indicator, it would be a good time to buy.
From a medium- to long-term perspective, if the price holds above the 1.5-1.9669 range, the upward trend is likely to continue.
-
Thank you for reading to the end. I wish you successful trading.
--------------------------------------------------
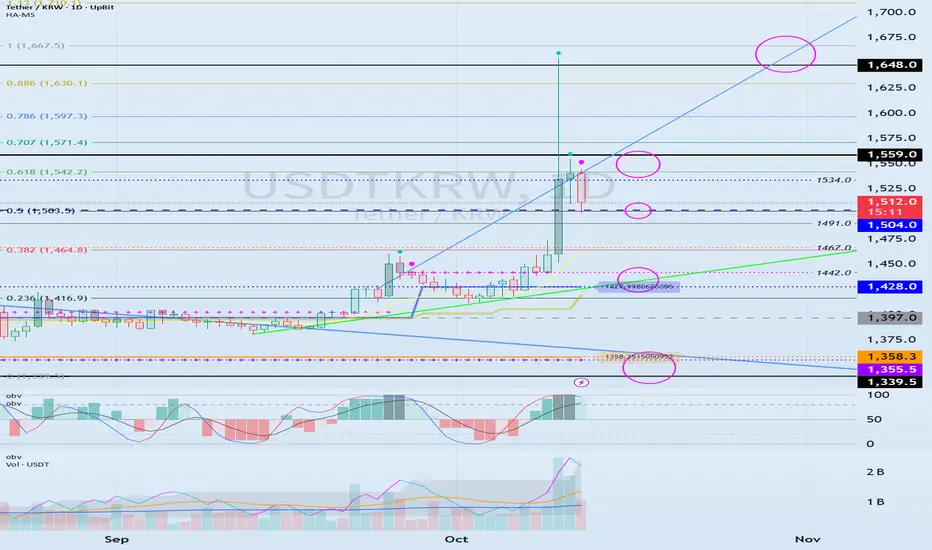
The key is whether it can fall below 1504.0
Hello, fellow traders!
Follow us to get the latest information quickly.
Have a great day.
-------------------------------------
(USDTKRW 1D chart)
Important support and resistance levels are marked with circles.
The key is whether it can fall below 1504.0.
Next, we need to see if it falls below the 1428.0-1442.0 range.
If it fails to fall, it is likely to rise along the uptrend line.
-
Thank you for reading to the end.
I wish you successful trading.
--------------------------------------------------
This year's target: Around 133889.92
Hello, traders!
Follow me to get the latest information quickly.
Have a great day.
-------------------------------------
(BTCUSDT 1W chart)
The price has been rising above the HA-High indicator, forming a step-up trend.
You can see that the upward movement of the step-up trend is slowing down.
The key question is whether the price can rise above the right Fibonacci level 2.618 (133889.92), which is considered this year's target.
If it shows further upward movement, it could rise to around the right Fibonacci level 3 (151018.77).
Even so, it must ultimately break above the HA-High ~ DOM (60) range on the 1W chart. Therefore, we need to see if the price can rise above the 116259.91-119086.64 range and maintain its upward momentum.
If it fails to rise, it will eventually touch the M-Signal indicator on the 1M chart again.
From a long-term perspective, the price must remain above the 69000-73499.86 level to maintain the uptrend.
Therefore, we must first confirm support near the first, second, and third levels.
-
(1D chart)
The 116259.91-119086.64 range is the resistance zone on the 1W chart.
If the price rises above this range, the 120760.81-124658.54 range, which is the resistance zone on the 1D chart, awaits.
Therefore, the 116529.91-124658.54 range should ultimately be considered the resistance zone.
To determine whether this range is important, you should examine the movements of auxiliary indicators such as StochRSI, On-By-Signal (OBV), and TC (Trend Check).
To break above this important range and continue the uptrend,
1. The StochRSI indicator must be trending upward. Ideally, it should not be in the overbought zone.
2. The On-By-Signal (OBV) indicator must be trending upward. If possible, it should remain above the High Line.
3. The TC (Trend Check) indicator should show an upward trend. If possible, it should remain above the 0 level.
It's important to meet the above conditions when breaking above the resistance zone of 116529.91-124658.54.
If not, there's a high chance of failing to break above the resistance zone.
-----------------------------------------------------
The HA-Low and HA-High indicators included in this chart are designed for trading on Heikin-Ashi charts.
Therefore, a basic trading strategy can be utilized: buy near the DOM (-60) ~ HA-Low range and sell near the HA-High ~ DOM (60) range.
However, if the price rises from the HA-High to DOM(60) range, it is likely to exhibit a step-like upward trend. If the price falls from the DOM(-60) to HA-Low range, it is likely to exhibit a step-like downward trend.
Therefore, the basic trading strategy should be a segmented trading approach.
We can see that the HA-High to DOM(60) range, i.e., the resistance zone, is likely to form, and then a pullback is likely to occur as it attempts to break above it.
Auxiliary indicators (StochRSI, OBV, TC) indicate the strength needed to rise again from a pullback, or a downward trend.
Although the 110644.40 level still serves as weak support, the DOM(-60) level has been identified.
For the 110644.40 level to function as support, it must hold for at least three days.
Therefore, during this period of volatility, we need to monitor whether the DOM (-60) indicator holds at 110644.40 after October 14th (October 13th-15th).
This is because if the price fails to break above the resistance zone of 116259.91-124658.54, the 110644.40 level could serve as support.
-
I believe the bull market is likely to continue until this year.
If it rises further, the upward trend could continue through the first quarter of 2026.
However, a major bear market is expected in 2026.
Therefore, we need to finish the year on a good note.
-
Thank you for reading.
I wish you successful trading.
--------------------------------------------------
- This is an explanation of the big picture.
(3-year bull market, 1-year bear market pattern)
I will explain in more detail when the bear market begins.
------------------------------------------------------

Understanding the Money Flow in the Coin Market
Hello, fellow traders!
Follow me to get the latest information quickly.
Have a great day!
-------------------------------------
(USDT 1D Chart)
(USDC 1D Chart)
I believe that USDT and USDC show a gap up trend when funds flow into the coin market, and a gap down trend when funds flow out.
Therefore, unless the gap turns into a downtrend, the coin market is expected to maintain its upward trend.
-
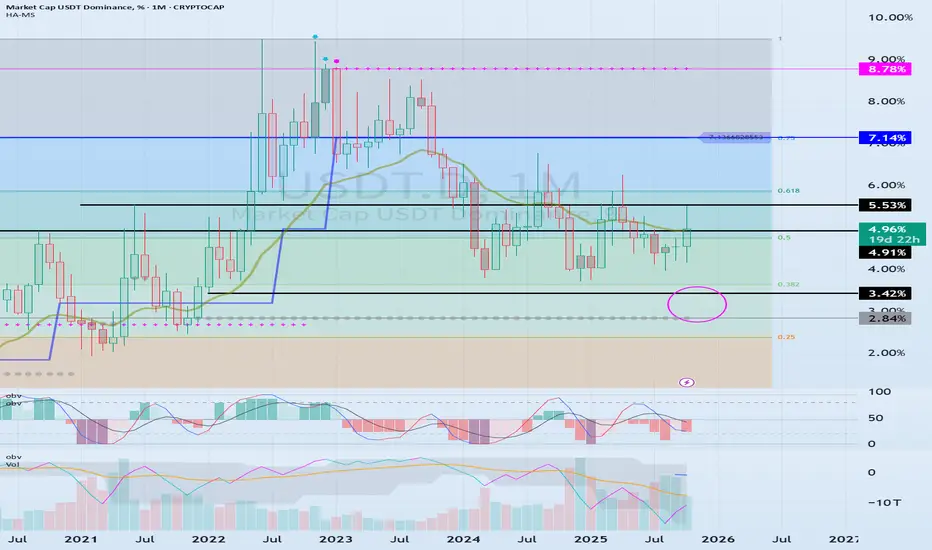
(USDT.D 1D Chart)
(1M Chart)
As funds flow into and out of the coin market through USDT and USDC, USDT dominance is likely to ultimately rise.
However, I believe that the funds (USDT, USDC) flowing into the coin market will change dominance through trading.
In other words, if USDT dominance declines, the coin market is likely to trend upward.
This is because coins (tokens) are being purchased with USDT.
If USDT dominance remains below 4.91 or declines, the coin market is likely to trend upward.
Therefore, if USDT dominance rises without any evidence of fund outflows through USDT or USDC, it can be interpreted as a temporary increase in selling pressure.
If USDT or USDC gaps downward in this situation, the price will fail to defend, leading to a downward trend in the coin market.
Therefore, it's best to look at the USDT and USDT.D charts to understand the general flow of funds.
-
(BTC.D 1D chart)
(1M chart)
I believe BTC dominance reflects the relationship with altcoins, rather than the rise or fall of the coin market or the rise and fall of BTC itself.
In other words, rising BTC dominance indicates a concentration of funds toward BTC, increasing the likelihood that altcoins will gradually move sideways or experience a downward trend.
Therefore, for an altcoin bull market to begin, it must remain below 55.01-62.47 or show a downward trend.
Therefore, it is recommended to check BTC dominance before trading altcoins and develop a trading strategy.
--------------------------------------------------
Summary of the above:
For the coin market to continue its bull market,
1. USDT and USDC must maintain a gaping upward trend.
2. USDT dominance should decline below 4.91.
3. BTC dominance should decline below 55.01.
-
Thank you for reading.
I wish you successful trading.
--------------------------------------------------
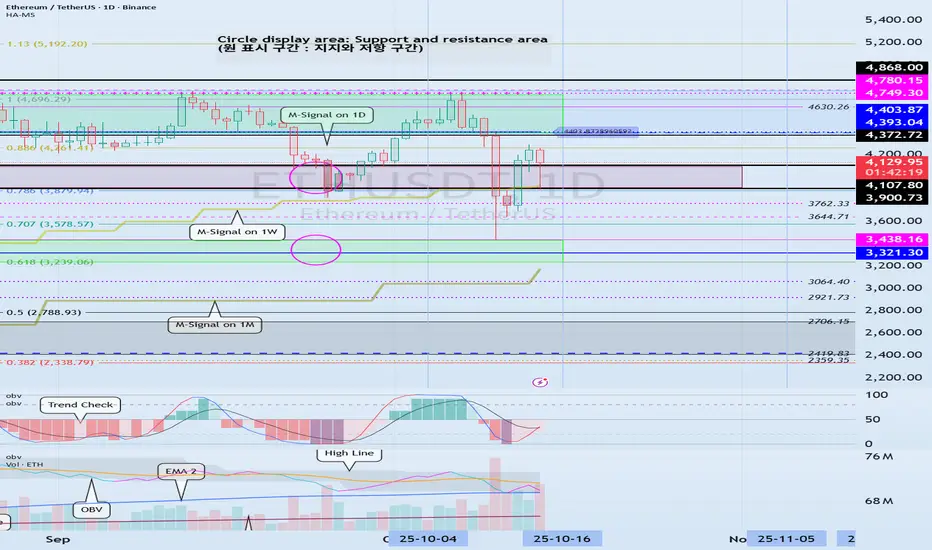
Support at the 4403.87-4749.30 range is key
Hello, fellow traders!
Follow us to get the latest information quickly.
Have a great day!
-------------------------------------
(ETHUSDT 1D chart)
This period of volatility is expected to last until October 5th.
Accordingly, the key question is whether support can be found around 4403.87 and whether it can rise above 4749.30.
If the price fails to rise,
1st: 3900.73-4107.80
2nd: 3239.06-3438.16
3rd: 2419.83-2706.15
We need to check whether support is found around the 1st-3rd levels above.
-
To break above a key point or range and continue the uptrend,
- The StochRSI indicator must be trending upward. If possible, it's best to avoid entering the overbought zone.
- The On-By-Sign Volume indicator must be trending upward. If possible, it should remain above the High Line.
- The TC (Trend Check) indicator must be trending upward. If possible, it should remain above the 0 level.
You should determine whether the above conditions are met at critical points or ranges and consider a response plan accordingly.
Currently, the StochRSI, OBV, and TC indicators are all showing an upward trend, so we believe the key point of 4403.87 has been broken upward.
However, to sustain this upward trend, the OBV indicator must rise above its High Line, and the StochRSI and TC indicators must maintain their current trend.
Therefore, we can see that support around 4403.87 is crucial.
-
The 4403.87-4749.30 range corresponds to the HA-High ~ DOM (60) range.
If this level is broken upward, a stepwise uptrend is likely, but it is likely to act as resistance.
Therefore, as mentioned earlier, determining whether the conditions for an upward breakout of a critical point or range are met will help you decide how to proceed with your trade.
-
Thank you for reading to the end. I wish you successful trading.
--------------------------------------------------

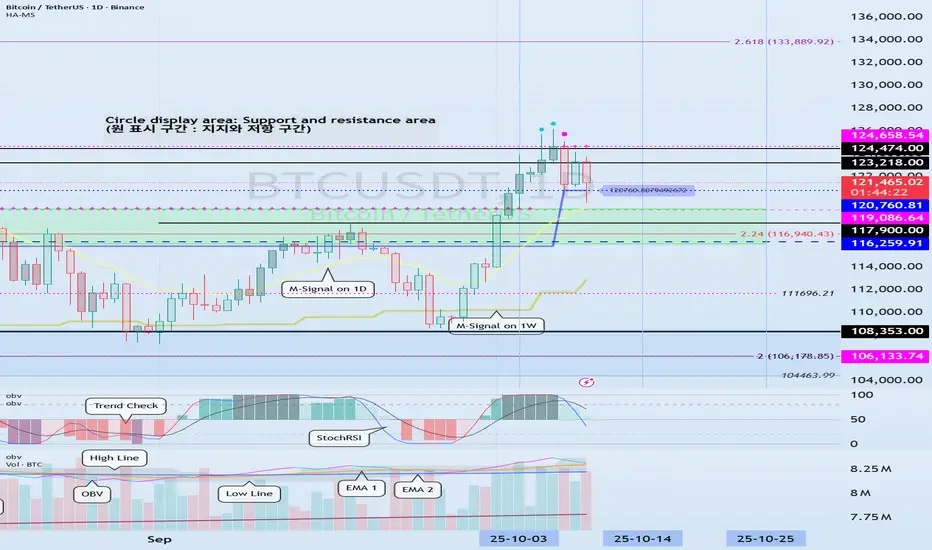
The key is whether the upward trajectory can continue
Hello, fellow traders.
If you "Follow," you'll always get the latest information quickly.
Have a great day.
-------------------------------------
(BTCUSDT 1D chart)
The price rose after forming a DOM(-60) ~ HA-Low range, and is now forming a HA-High ~ DOM(60) range, showing a upward trajectory.
Trend-wise, a decline below the M-Signal indicator on the 1W chart is likely to initiate a downtrend, and a decline below the M-Signal indicator on the 1M chart is expected to initiate a downtrend.
Therefore, when the price falls to the HA-High ~ DOM (60) range, it's important to identify support and resistance levels formed at the M-Signal indicator on the 1W chart.
-
Therefore, it's important to maintain the price above the 116259.91-119086.64 range.
The next important range is the 104463.99-108353.0 range.
-
To break above these key levels or ranges,
- The StochRSI indicator must be trending upward. If possible, it's best to avoid entering the overbought zone.
- The On-By-Signal (OBV) indicator must be trending upward. If possible, it should remain above the High Line.
- The TC (Trend Check) indicator should show an upward trend. If possible, it should remain above the 0 level.
If the above conditions are met, an upward breakout of the HA-High ~ DOM (60) range is expected.
The next period of volatility is expected around October 14th (October 13th-15th).
-
Thank you for reading to the end.
I wish you successful trading.
--------------------------------------------------
- This is an explanation of the big picture.
(3-year bull market, 1-year bear market pattern)
I will explain in more detail when the bear market begins.
------------------------------------------------------
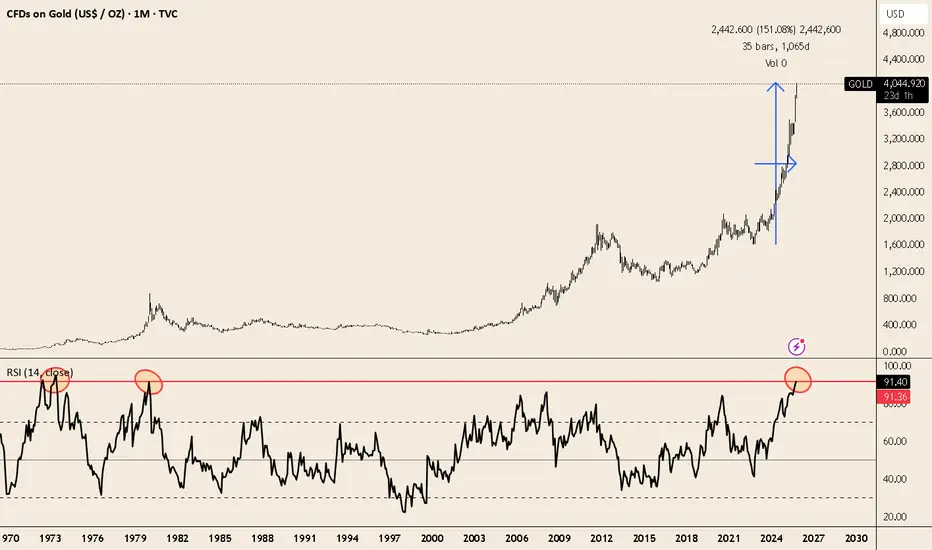
Gold monthly RSI >90 (first time since 1980) - rising FOMO risk💡 Idea / Thesis
Gold ( TVC:GOLD ) has gone almost vertical — up ~150% since late-2022 and +54% YTD.
The monthly RSI(14) just hit 91.36, a level we haven’t seen since the 1980 peak.
That doesn’t mean “sell now,” but it’s a clear sign of euphoria and extreme momentum — the type of move that usually ends with a pause or correction.
⚠️ Why I’m cautious
RSI >90 = extremely rare, often followed by several months of consolidation.
Parabolic breakout: The rally above 3400-3500 left little support underneath.
Sentiment: Everyone’s talking about gold again → signs of FOMO and crowded trades.
🎯 How I’d approach it
If you’re long:
Lock in some profits or hedge part of the position. Continue DCA strategy
Watch for a pullback to increase exposure like for example the area 3,300–3,500.
🚧 Risks
Strong uptrends can stay overbought for months — RSI ≠ sell trigger.
Central banks & geopolitics can keep gold strong.
Manage position size and respect stops.
📊 Bias: Long-term bullish, short-term cautious
Not financial advice. DYOR.
Ethereum Price Prediction: Samsung Staking and BitMine Treasury In October 2025, Ethereum (ETH) is poised for significant growth, driven by major catalysts like Samsung’s integration of ETH staking in Galaxy devices and BitMine Immersion’s massive treasury holdings. With ETH trading at $4,500 after a 23% rally, these developments signal strong demand, potentially pushing prices to $10,000 by year-end. Samsung’s partnership enables staking for over 200 million users, while BitMine’s 2.83 million ETH ($13.4 billion) underscores institutional confidence. This analysis explores these drivers, price predictions, and trading strategies for investors. Data as of October 7, 2025—position for ETH’s next surge.
Samsung Staking: Empowering 200M+ Users
Samsung’s integration with a major crypto platform allows Galaxy device owners in the US to stake ETH directly via a mobile wallet, offering zero trading fees and 5–7% APY. Targeting 200 million+ users, this feature simplifies staking, boosting retail adoption. Early data shows 75 million users gaining crypto access, with projected Q4 staking inflows of $500 million. This democratizes ETH participation, enhancing network security as the staking queue grows to 475,000 validators. The surge in retail staking could lift ETH prices by 10–15%, correlating 0.7 with Galaxy device sales.
BitMine Treasury: $13.4B ETH Holdings
BitMine Immersion Technologies holds 2.83 million ETH ($13.4 billion), the second-largest crypto treasury, with a recent $821 million purchase. Controlling 5% of ETH’s supply, BitMine’s strategy leverages immersion cooling for efficient mining and staking, signaling strong belief in Ethereum’s upgrades like Pectra. This reduces liquid supply, amplifying price sensitivity. Corporate treasuries, alongside $75.2 million net ETF inflows in September, support ETH’s price floor during corrections, with on-chain data showing a 15% increase in whale holdings.
Price Prediction for 2025: $4,685–$10,000
Analysts project ETH ranging from $4,685–$4,900 by mid-October, with bullish targets up to $10,000 on staking and treasury demand. Samsung’s 200M user base and BitMine’s holdings could drive a cup-and-handle breakout to $7,500. Futures open interest hit $61 billion, signaling momentum. Risks include regulatory delays or unstaking pressure (475,000 validators), potentially capping gains at $5,000. A 40% upside to $7,500 by Q4 is likely if adoption persists, with a 0.8 correlation to Nasdaq.
Trading Signals: RSI and MACD
Analysis uses RSI for momentum and MACD for trends, based on April 2025 uptrends:
ETH ($4,500): RSI at 58 (bullish above 55). Bullish MACD crossover (+0.15)—target $5,200 (15% upside). Fibonacci support at $4,200, resistance at $4,760. On-chain: Staking inflows +$500M.
LDO (staking proxy, $2.20): RSI at 60. Bullish MACD (+0.12)—target $2.50 (20% upside). Fibonacci support at $2.10, resistance at $2.40.
Overall: RSI 58–60 signals momentum—long at supports for 15–25% Q4 gains. Risks: Unstaking (5–7% dip); hedge with BTC.
How to Profit from ETH Demand
Capitalize on ETH’s catalysts:
Track Signals: Monitor RSI >60 and MACD crossovers for entries (e.g., ETH at $4,200), targeting 10–15% yields.
On-Chain Analysis: Follow staking inflows and treasury holdings via explorers for rally signals.
Portfolio Strategy: Allocate 20–30% to ETH, hedge with USDC at RSI >70 for 20% Q4 returns.
Education: Study staking mechanics and practice trades via demo platforms.
Conclusion: Ride ETH’s Surge
Samsung’s staking and BitMine’s $13.4B treasury fuel ETH’s rally, with $10,000 in sight for 2025. Track signals for breakout gains.
What’s your ETH price target? Comment below!
#EthereumPrice #Staking #CryptoTreasury #MarketTrends #CryptoInvesting
Next Volatility Period: Around October 14th
Hello, traders!
Follow us to get the latest information quickly.
Have a great day!
-------------------------------------
(BTCUSDT 1D Chart)
This volatility period is expected to last until October 4th.
Accordingly, the key question is whether it can find support near 119,177.56 and rise.
If not, and the price declines, support near 115,854.56 will be crucial.
If it finds support near 119,177.56 and rises, it is expected to challenge the Fibonacci ratio of 2.618 (133,889.92).
The key areas for maintaining an uptrend are:
- Short-term: 115,854.56-119,177.56,
- Medium-term: 104,463.99-108,353.0,
- Long-term: 87,814.27-93,570.28.
-
Thank you for reading.
We wish you successful trading.
--------------------------------------------------
- Here's an explanation of the big picture.
(3-year bull market, 1-year bear market pattern)
I'll explain more in detail when the bear market begins.
------------------------------------------------------

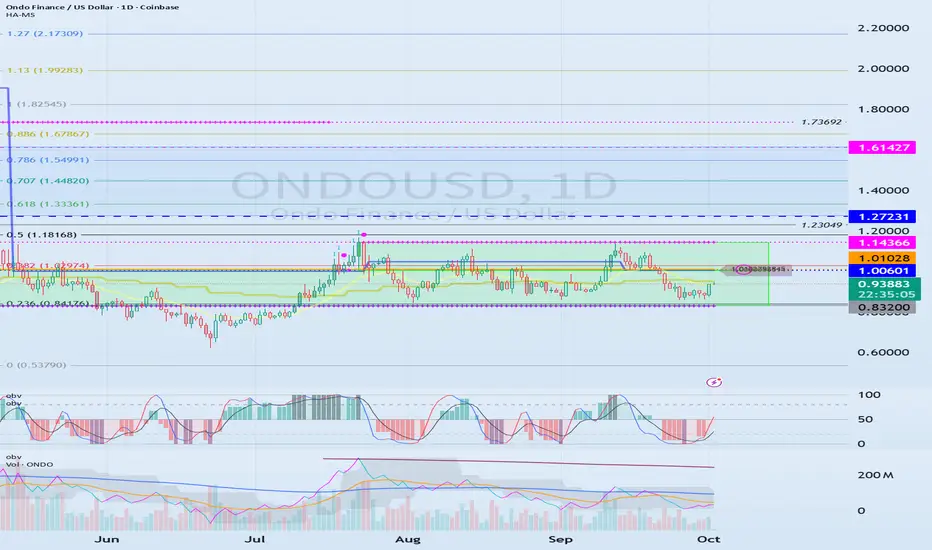
The key is whether support is found at 1.00601-1.01028
Hello, traders. Nice to meet you.
If you "Follow," you'll always get the latest information quickly.
Have a great day.
-------------------------------------
(ONDOUSDT 1W Chart)
The key is whether the price can find support near 0.832 and rise above the M-Signal indicator on the 1W chart.
The resistance zone is 1.27231-1.61427.
If it falls below 0.832, you should stop trading and wait and see how things go.
-
(1D Chart)
The key is whether the price can rise above the 1.00601-1.14366 range, which is the HA-Low and HA-High indicators.
The HA-High ~ DOM (60) range is formed within the 1.00601-1.14366 range, so if this range breaks upward, a step-up trend is likely.
However, the resistance zone on the 1W chart is located at 1.27231-1.61427, so the trend will ultimately be determined by whether support is found within this range.
What we can do is buy in the 0.832-1.14366 range and sell in the 1.27231-1.61427 range.
The reference range for buying is 1.00601-1.01028.
-
Thank you for reading.
We wish you successful trading.
--------------------------------------------------
Trading Strategy
Hello, fellow traders!
By "Following" us, you'll always receive the latest information quickly.
Have a great day.
-------------------------------------
The conditions that lead people to start trading vary.
Before starting a trade, you should consider a trading strategy.
A trading strategy should include:
1. Investment period
2. Investment size
3. Trading method and profit realization method
You should categorize the coins (tokens) you wish to trade based on items 1-3 above.
1. The investment period is the most important.
While the investment period varies from person to person, BTC and ETH are generally considered long-term investments.
Since BTC and ETH are important coins that support the cryptocurrency market, I recommend investing in either BTC or ETH.
All coins other than BTC are broadly categorized as altcoins. However, among them, BNB, SOL, XRP, TRX, and ADA LINK, which have high market capitalizations and have been around for a long time, are suitable for mid- to long-term investment.
However, since these coins are also broadly categorized as altcoins, it's recommended to increase the number of coins (tokens) that generate income, if possible, for mid- to long-term investment.
This method involves selling the original purchase price (plus transaction fees) when the price rises, leaving the remaining coins (tokens) available for profit.
This allows you to increase the number of coins (tokens) with an average purchase price of zero, making mid- to long-term investment feasible.
While it's certainly advisable to sell your holdings to generate cash profits, this practice is not suitable for mid- to long-term investment.
This is because if you make a mistake, you could end up buying at a high price and incur losses for a long period of time.
-
2. You should determine your investment size based on your investment period.
In other words, if you're making a long-term investment and have already invested all your capital, you could miss out on good opportunities in the future.
Therefore, it's best to invest in the following order: long-term investment < mid- to long-term investment < short-term investment.
Furthermore, you should keep approximately 20% of your total investment in cash.
This allows you to trade when a good opportunity arises.
If you run out of cash after trading, try to sell when the price rises to secure cash.
Furthermore, you should avoid investing in too many coins (tokens).
-
3. Once you've determined your investment period and size, you need to find the right buy and sell points for actual trading.
Therefore, you need to define your trading method and profit-making method.
The basic trading strategy is to buy in the DOM(-60) ~ HA-Low range and sell in the HA-High ~ DOM(60) range.
However, if the price rises in the HA-High ~ DOM(60) range, a stepwise upward trend is likely, while if the price falls in the DOM(-60) ~ HA-Low range, a stepwise downward trend is likely.
Therefore, the basic trading strategy should be a split trading strategy.
In other words, if you buy in the DOM(-60) ~ HA-Low range and the price rises to form the HA-High ~ DOM(60) range, it's best to sell in splits and observe the situation.
This stabilizes your psychological state, allowing you to re-analyze the charts.
Maintaining a stable psychological state is crucial for trading.
If your psychological state is unstable, you're more likely to make unexpected trades.
Therefore, it's important to have a basic trading strategy that suits your investment style.
As mentioned earlier, to maintain a mid- to long-term investment, you need to decide whether to increase the number of coins (tokens) that generate profits or to generate cash returns. Before conducting a trade, you need to decide whether to do so.
Since the coin market is increasingly interconnected with the stock market, you can try to interpret it using the same method as the stock market.
In other words, rather than examining the flow of funds within the coin market itself, you should prioritize assessing the stock market, social issues, the economy, and politics to determine market trends.
I believe this problem stems from a lack of understanding of the coin market.
While some external factors may influence the flow of funds within the coin market, they are not suitable for predicting it.
Therefore, you should check the USDT, USDC, USDT.D, and BTC.D charts to confirm the flow of funds within the coin market.
Next, you should check the charts of the coin (token) you wish to trade to determine if it fits your basic trading strategy and develop a trading strategy.
Finally, by examining issues beyond the coin market, you can make an objective decision about your trading.
Otherwise, you will likely make inappropriate trades based on subjective opinions stemming from issues outside the coin market.
To analyze and interpret the coin market like the traditional stock market, the two markets must be integrated.
Otherwise, I believe the coin market should not be analyzed or interpreted like the stock market.
-
Thank you for reading to the end.
I wish you successful trading.
--------------------------------------------------

Support near 222.61 is key
Hello, fellow traders!
Follow us to get the latest information quickly.
Have a great day!
-------------------------------------
(SOLUSDT 1D chart)
There are many lines drawn, but the important area is ultimately the 179.74-247.50 range.
Among these, a rise above 236.88-247.50 is necessary for a stepwise uptrend to continue.
The key is whether the current 202.45-222.61 range, i.e. the DOM (60) ~ HA-High range on the 1W chart, can provide support and allow for an upward movement.
Therefore, based on the 202.45-222.61 range, we need to monitor whether the price rises above 236.88-247.50 or falls below 179.74.
-
To break through this critical point or range and continue the uptrend,
- The StochRSI indicator must be trending upward. If possible, it should be below the overbought level.
- The On-By-Significant Volume indicator must be trending upward. If possible, it should remain above the High Line.
- The TC (Trend Check) indicator must be trending upward. If possible, it should remain above the 0 level.
-
Thank you for reading to the end.
I wish you successful trading.
--------------------------------------------------

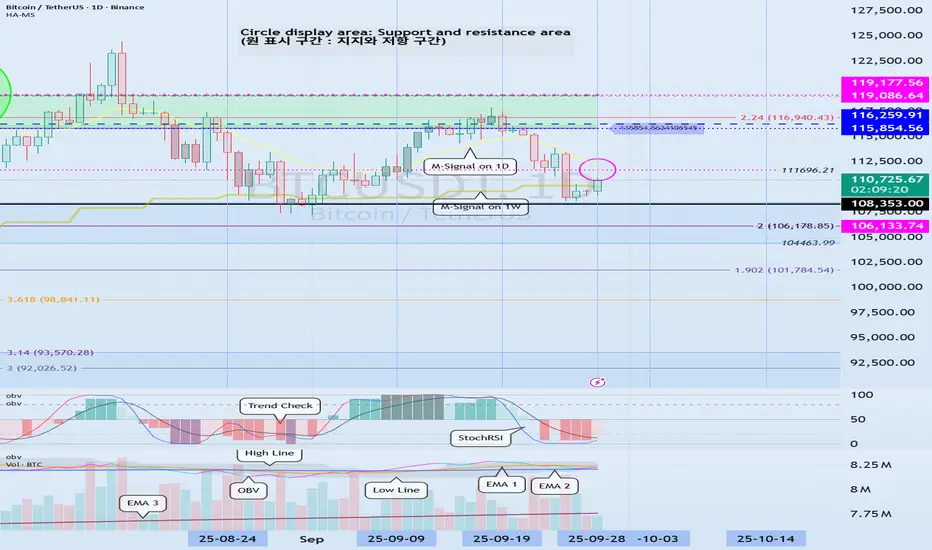
Next Volatility Period: Around October 3rd (October 2nd-4th)
Hello, fellow traders!
Please "Follow" to get the latest information quickly.
Have a great day!
-------------------------------------
(BTCUSDT 1D Chart)
This volatility period lasts until September 29th, but since the next volatility period is around October 3rd (October 2nd-4th), it's highly likely that the volatility period will continue until October 4th.
Therefore, we need to see if the price can sustain above 11696.21 after the volatility period.
If it fails to do so and falls below the 104463.99-108353.0 range, a sharp decline is likely.
If a sharp decline occurs, we need to check for the formation of new indicators such as the DOM (-60) or HA-Low indicators.
If new support is formed, it's important to determine whether there is support near that area.
If support is not found, a step-down trend is likely.
-
It is currently located near the M-Signal indicator on the 1W chart and the M-Signal indicator on the 1D chart.
Therefore, if the price rises above 111696.21 and holds, further upward movement is likely.
At this point, the key question is whether the price can rise above 115854.56 and hold.
To sustain the uptrend,
- The StochRSI indicator must show an upward trend. It must rise from the oversold zone.
- The On-By-Signal (OBV) indicator must show an upward trend. It must rise above EMA 1 and, if possible, above the High Line and remain there.
- The TC (Trend Check) indicator must show an upward trend. It must rise above the 0 point and remain there.
If the above conditions are met, the uptrend is likely to continue above 111696.21.
-------------------------------------------
The basic trading strategy is to buy in the DOM(-60) ~ HA-Low range and sell in the HA-High ~ DOM(60) range.
However, if the price rises in the HA-High ~ DOM(60) range, a stepwise upward trend is likely, while if the price falls in the DOM(-60) ~ HA-Low range, a stepwise downward trend is likely.
Therefore, the basic trading strategy should be a segmented trading approach.
This basic trading strategy principle was developed for trading on Heikin-Ashi charts.
Adding the M-Signal indicator on the 1M, 1W, and 1D charts allows you to see the overall trend.
The remaining indicators indicate support and resistance points or zones for chart analysis or trading strategies.
Trading is all about reaction, so understanding support and resistance points or zones is crucial.
However, you should interpret the charts based on core fundamental trading strategies.
-
Thank you for reading to the end.
I wish you successful trading.
--------------------------------------------------
- Here's an explanation of the big picture.
(3-year bull market, 1-year bear market pattern)
I'll explain more in detail when the bear market begins.
------------------------------------------------------
Resistance Zone: 977.90-1047.80
Hello, fellow traders!
Follow us to get the latest information quickly.
Have a great day!
-------------------------------------
(BNBUSDT 1M Chart)
We achieved our target by touching the Fibonacci level of 1.618 (1057.16).
We need to see if the price can rise towards Fibonacci ratio 2 (1259.05).
-
(1D chart)
The HA-High ~ DOM (60) range has formed at 977.90-1047.80.
Therefore, the 977.90-1047.80 range could act as resistance.
If it falls below 977.90, it could encounter the M-Signal indicator on the 1M chart.
Before that, we need to see if the price rises along the uptrend line (1).
-
Thank you for reading to the end.
I wish you successful trading.
--------------------------------------------------

Volatility Period: Around September 19th (September 18th-20th)
Hello, traders!
Follow us to get the latest information quickly.
Have a great day!
-------------------------------------
(BTCUSDT 1D Chart)
This volatility period is around September 19th (September 18th-20th).
As this period of volatility progresses, we need to examine the direction in which the price deviates from the 115,854.56-119,177.56 range.
As previously mentioned, the key ranges are 87,814.27-93,570.28 and 104,463.99-108,353.0.
Therefore, if the price falls below 115,854.56, we need to check for support near these key levels.
-
It's perhaps natural for trading volume to decrease after a new ATH (Any New High).
If a new ATH (Any New High) is met with high trading volume, it could indicate a significant amount of profit-taking, increasing the likelihood of a downward trend.
Therefore, I don't think it's wise to interpret the current decline in trading volume as a sign of a decline.
We're using the On-By-Volume (OBV) indicator, which helps us understand the movement of trading volume, so we can roughly gauge the current trading volume trend.
-
The HA-High ~ DOM(60) range on the 1D chart is 115854.56-119177.56, and the HA-High ~ DOM(60) range on the 1W chart is 116259.91-119086.64.
Since these two resistance levels overlap, a breakout above this level suggests a potential surge.
-
Thank you for reading to the end.
We wish you successful trading.
--------------------------------------------------
- This is an explanation of the big picture.
(3-year bull market, 1-year bear market pattern)
I will explain in more detail when the bear market begins.
------------------------------------------------------
