Earnings today with a break out and gap above?I am seeing a clear break of structure with a large liquidity gap above at my red lines.
With benefits to pharma tariffs being lifted it will provide bullish narratives for exporting our pharma production.
I honestly don't know much about the stock, but the technicals add up here.
Bearish thesis is a gap down to grab liquidity for long term.
Breadth Indicators

Was this the best buying opportunity since 2011?Sure, here's a rewritten version of your text in an engaging tone:
"Have you ever heard of the Zweig Breadth Thrust? Well, let me tell you, it’s an incredible metric that can really shed some light on the current market situation!
So, what would it take for me to believe that this bounce isn't just another bear market rally? My first step would be to dive into the breadth indicators and look for signs of that elusive breadth thrust.
Think of a breadth thrust like a rocket taking off. You need a strong initial boost to break free of gravity's grip. If the thrust is weak, the rocket can’t escape, and the same applies to stock market reversals. When we see a robust breadth thrust, that's a signal that a significant reversal is underway. Without it, we could be facing another false bounce.
Now, let’s talk numbers! As of Friday, April 25th, the SPX has surged an impressive 14.2% from its recent lows, and while that’s quite a leap, it’s essential to keep it in perspective. Just think back—this index was down 21.35% from its all-time high earlier in February during the panic sell-off. Now, with the recent strength, it’s only 10.75% off its peak.
The Zweig Breadth Thrust is calculated based on the 10-day EMA of NYSE Advances divided by the sum of Advances and Declines. A bullish signal pops up when the ZBT shifts from below 0.40 to above 0.615 within just ten days or less. Keep an eye on that—it might just help us navigate these choppy waters!"
On the monthly chart, it’s clear that what we’ve been seeing in the broader economy (you know, Main Street) is actually showing us some bearish divergence—a concept I've mentioned in my previous ideas.
Since 2009, we've had four notable instances on the Monthly chart where the ZBT dipped below 0.40, only to bounce back up past the 0.6 mark. Remember back in November 2011? That was when we got a significant signal with a low reading of 0.31, which climbed back to 0.62 by February 2013. That surge sparked a bull run that peaked in February 2020!
So, the takeaway here is that this breadth thrust is generating the positive momentum we need to reach new stock market highs this year. Exciting times ahead!

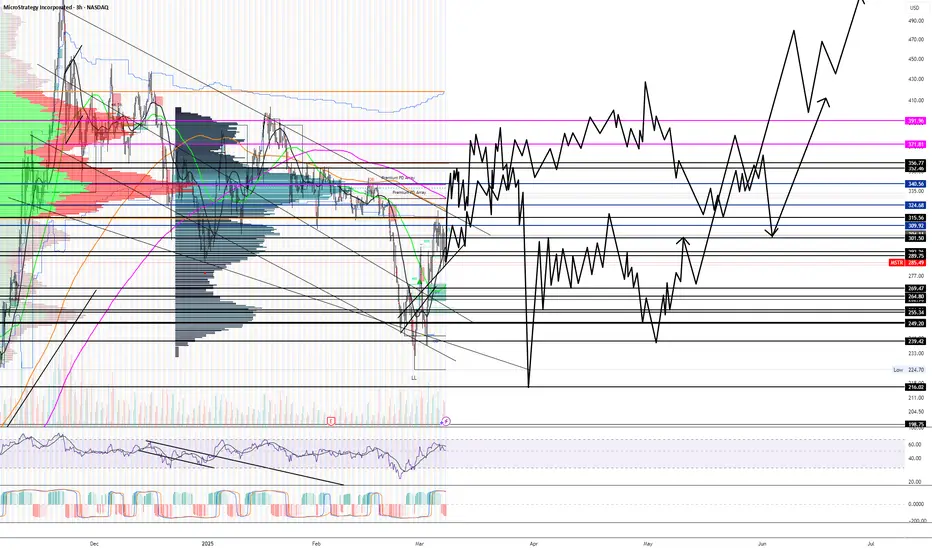
Big Bets Coming In, Negative Gamma Clusters Here We Come!I have been waiting to call this one for months. Predicted the downfall of MSTR and now I want a dead cat bounce or short term rally again.
After large positions and option contract plays are placed/bought, it can take time for the bottom to form and the price to move. I can see potential downside to $290-$289 and then we bounce ORRRRRR if we break through 290-289 with strong downside, next target is $262.
IF WE LOSE 290, its very very bad for the stock longer term.
First target is $320
Second target is $340

Charging Stations, Reduced Rates and Politics.With the future of the car industry looking dark and bright at the same time, HTZ has been over sold and bullied hard since its last pump with tesla ect.
My long term target I know it will hit is $8 over the next year.
I rarely call on meme stocks but no one is seeing this one coming ;)

$350 By March 21st? IshHere are my two possible price paths that I took from two other similar cycles.
This mixed with bitcoins price path in the coming weeks, I think my take profit level is $350 and then $370 at most. Idk why but the start of Q2 (April 1st) might be bumping to.
SKFI vs SPY - At OVERSOLD LevelsThere are only 1.44% of S&P Info Tech Stocks above the 50 DMA. Looking at history dating back to 2015, we generally get bounces around these zones. Even if bounces come, you would want SKFI to get back over the 50% range and hold. Failure to get back over and hold has historically let to more downside.

Breaking the 325 MA at 85K is a good sign.The 325 day moving average is seen in my chart as pink.
The rejection on Friday followed with a healthy retest over this weekend makes me believe liquidity is at 90-95K.
Then we will see more choppy behavior.

About the Volume OBV indicator...
Hello, traders.
If you "Follow", you can always get new information quickly.
Please click "Boost" as well.
Have a nice day today.
-------------------------------------
I think TradingView is attractive because users can create charts as they want.
However, since the number of indicators that can be added to the chart is limited depending on the plan, you have to add indicators that fit your plan.
As a result, I ended up integrating multiple indicators into one indicator.
-
The HA-MS indicator in this chart is a public indicator.
If you search the Internet, you can find detailed explanations on how to interpret the OBV indicator.
I expressed it as follows to make this interpretation method more realistic.
The body color of the candlestick is indicated by the 4-stage OBV indicator.
The OBV indicator is distinguished in the same way as the Price Channel indicator.
You can interpret it like the Bollinger Band.
That is, if the middle line that divides 2 and 3 rises by more than 3, you can interpret that the buying force is increasing.
1: It means below the lower line of the Price Channel and is indicated in dark red.
If you enter this section, there is a high possibility of a sharp decline.
You should check the support and resistance points because it is likely to stop falling soon and rise to 2.
2: It means between the lower line and the middle line of the Price Channel and is indicated in red.
This section is likely to show a weak downward sideways movement.
Therefore, if it rises from 1->2, there is a possibility of a short rise. However, if it fails to rise to 3, it is likely to fall back to 1, so it is recommended to make short trades.
3: It means between the middle line and the upper line of the Price Channel and is displayed in green.
This section is likely to show a weak upward sideways movement.
If it rises from 2 -> 3 and shows a sideways movement, you should focus on finding a buying point.
4: It means above the upper line of the Price Channel and is displayed in dark green.
If it enters this section, there is a high possibility of a sharp rise.
Since it is likely to stop rising soon and fall to 3, you should check the support and resistance points.
-
What we should pay attention to is when it changes from 1 -> 2, 4 -> 3.
As explained above, 1 is a section located below the lower line of the Price Channel, so there is a high possibility of a sharp fall.
4 is a section located above the upper line of the Price Channel, so there is a high possibility of a sharp rise.
Therefore, you can proceed with an aggressive buy when it changes from 1 -> 2, and you can proceed with a sell when it changes from 4 -> 3.
In the case of futures, it can be used as reference information for entering and liquidating LONG and SHORT positions.
-
They say that the only things you need on a chart are price and trading volume.
However, it is not easy to interpret this in reality.
To compensate for this, we hid the colors of the existing candles and displayed them in 4 stages of OBV so that you can intuitively see which stage the current price is at.
-
Thank you for reading to the end.
I hope you have a successful transaction.
--------------------------------------------------

Time to long it!!!I have no back ground info on this ticker once again and am only going based on technicals.
All indicators point to a pump for about 10-15%. RSI, MACD and my other breathe indicators are pointing up for bullish movement.
Price target 1 is 52

After falling for several days in a row, where should gold go?Gold technical analysis: After the gold opened in early trading, the price shot straight up, with the opening price at the 2858 line, which is a strong short-term support level. After rising in early trading, according to market inertia, there is a high probability that the European market will continue to rise. The strong pressure above is at the 2885 line. When the price touches this point for the first time, short selling can be carried out during the day. Since the opening of the morning session was directly pulled up sharply, the entry position for long positions today will obviously not be too low. However, it should be noted that since the rebound of 2832, the possibility of directly hitting a new low again today is extremely small, so the probability of a direct sharp drop in price is unlikely. However, don’t think about gold too simply. The short trend does not mean that it will continue to fall without a counter-tick. It can be found that before gold fell, it made two supports near 2890. If it falls below 2890 later, then 2890 will change from a support to a suppression position. In the short term, the upper side focuses on the resistance of 2880-2890, and the lower side focuses on the support of 2860-2850.
Brothers, profit is the ultimate goal of trading, and accumulating profits is what changes life and destiny. Wise choices are far more important than hard work. If you want to copy trading signals, earn stable profits, or want to learn the correct trading logic and skills in depth, you can consider joining the channel at the bottom of this article.

Largest Dark Pool Sweep Order Since 2023...On a ranked scale since inception, there was a relatively small DP sweep order ranked #58
Price purchased at $63.90.
The reason why its so substantial is that it was the largest trade made since 2023 when the stock found major support at levels we are still consolidating in to this day.
The even bigger reason on why this means we are most likely bottoming for the last time is that the #58 trade was a DP SWEEP. Meaning they bought the stock at market value to fill it as fast as possible.
They did not set a limit order and wait patiently.

BITCOIN SITS ON CRITICAL BULL MARKET SUPPORT!!!Good day Traders and investors,
Bitcoin at the moment is sitting above VERY CRITICAL Bull market support band. In my opinion, this support needs to hold it there is going to be another leg up.
I want to add this is likely the last time it will hold this line as support. It will not play such a big roll in the future other possibly serving as resistance to the tops or top.
Please keep in mind I as talking about closing above support, so... yes it can wick down. Weekly and monthly closes are very important. If this level is lost with a monthly close, then I would call t his bull run over. Yes, it's that important.
The top shows the entire trend line, and on the bottom is the same line, just zoomed in o the daily.
Please feel free to ask or add anything down below
like and share. Follow me on other socials linked in the BIO.
Kind regards,
WeAreSat0shi

btc finds 200 ema support, whats next?As I have been posting in these "Ideas" for the past few weeks about market direction and where the price for BTC will go. It now has come to pass where the 200 EMA has been tested and support has been found, It however has not generated any relief among buyer sentiment unable to push price above the previous days close leaving the digital asset to continue to bleed out and cause positions from all the 93k Bulls to liquidate.
Its a shame people cannot make the connection that the only way price can go higher is to go lower in a market. That Is why I am going to warn people about where we may go , I believe the 200 EMA will be tested again and if support is broken it will send is into the low 70k area where there are open orders and It is possible this may happen. The Bull market support band is the 200EMA however there may be institutional money that may drive us down to cause massive liquidations and fear and panic among those holding bags while greed causes big players to push more into the fringe of where we can maintain a recovery.
Watch for a retest of the 200EMA . which is a bit of a fuzzy zone , use the high and low to denote the area for support as well as keep an eye on the RSI and CCI , we are also watching on balance volume drop off which is not a great sign that there is market confidence however this will play out over the weekly and the weekly candle will start to materialize in the next few days.

Bitcoin | 60-Day OutlookYou may wonder, where did I get this price path prediction from?
I audited the entire chart of bitcoin from when it was created to now.
Compared every top, bottom and consolidation move to present. The one you see here does not accurately predict the EXACT price it rejects, supports from BUT, it has predicted the last few months of price action for me so far.
First target is FWB:88K
Second target is $85K-$84K then a bounce back to $105K and a drop.
For the next few months, Bitcoin is going to be volatile and consolidate during its top formation.


Idk This Company, But It Is Acting Strange My first target price is 1.75 and that is the only target I am looking at, for the moment.
I am seeing unusual price action and volume imbalances. This can be whipsawed in either direction so be careful!


Potential Short Opportunity for GE Aerospace (GE)GE Aerospace (GE) may be a good short opportunity here, as the hourly chart shows some nice negative divergence within a nice-looking rising wedge formation. If Ge breaks the wedge, short-term support will be around the $205 level. If they break that level, then I would be watching that $199.13 support level. If $199.13 were to fail, I would then watch to see if we could get a third reaction on the possible rising trend line highlighted in light blue.

PEPSIIII - Long Term Super Over Sold ConditionsThis play does not make the much sense to me via a fundamental perspective regarding the economic outlook of companies like PEPSI, Coke and $KO. But, from an investment standpoint, they control the food/drink market and have seen stagnant numbers and low growth regarding there products. Our new leader RFK Jr. in the food industry might start a complete overhaul of the products forcing these companies to rethink there targeted audiences/ marketing campaigns and adapt to this generations pallet.
Short term it needs to build more structure and a foundation, on the other hand watch out for a V shaped reversal in the coming weeks.
Target #1 - $155
Target #2 - $160
Target #3 - $170
Stop Loss - $140
Stay tuned for option position longs, I will personally be investing money in them as well.


Heavy Volume Build Up! Little Double Dip?Seen in the volume profile levels to the left, there is a large volume displacements and price looks like it wants $110 this week.
High amounts of calls at the $110 strike expiring 1/10. Its only right lol.
Large volume on the $130 & $150 strikes expiring 1/17
Price targets:
#1
$110 by end of week
#2
$120
#3
$140

Everyone wants $20, Here are my thoughts...Making this without looking at earnings numbers or there so called growth.
From what I am seeing in relative strength, $15 is the fair value price at the moment.
I am expecting to see a gap down to the $15 area and have it slowly or quickly climb to $20-$25.
If the inverse plays out, we will gap up to $20-$25 and then flash sell to $15 long term.
Right now, options market is wanting.
$20 for calls expiring 1-31.
$18 for calls expiring 2-07.
$17 for calls expiring 2-14.
BUT... a very large position of puts, expiring 02-28, is at the $12.5 strike.
I look at this as retail buying short term options expecting price to move there, while institutions have positioned themselves in longer term expiring contracts.

OM: the most resilient crypto asset todayI'm setting up a buy trigger for OM. Among the crypto assets I track, this one has shown remarkable resilience. During today's market drop, most assets pulled back to the 200-period moving average, with even major market cap leaders like ETH and BNB breaking well below this key support level intraday. In contrast, OM remained strong, with its deepest decline barely dipping below the 20-period moving average.
Today's sharp market recovery indicates strong buying interest at lower prices, which is an undeniably bullish signal. However, given the market's recent streak of failed breakout attempts, I plan to approach this setup with caution.
I'm taking a modest position in OM if the trigger is activated. Due to the relatively wide stop-loss (-32%), I will allocate only 3% of my portfolio, limiting potential downside risk to -1%. On the upside, if the trade performs well, the projected return is 160%, translating to a +4,8% portfolio gain.

Multiple Different Outcomes I Wanted to Share.I think its finally time for PLTR to seek some downside.
I put the four down move outcomes I think will happen and a few for upside peaks. We are stalling out on PLTR and the dont even get me started on the earnings/finacial side of the company versus its price.
Next weeks bear target is 75-70 and longer term is 60.
Bull case for this stock is 100. But I highly doubt it.
