EURGBP - Entry ShortCurrently Short in EURGBP
1. Price breaks through a respected support level
2. Rebounded from the next support level, retested to the previous area of support
3. Entered at the retest for downside potential to continue a bearish trend
Breakandretest

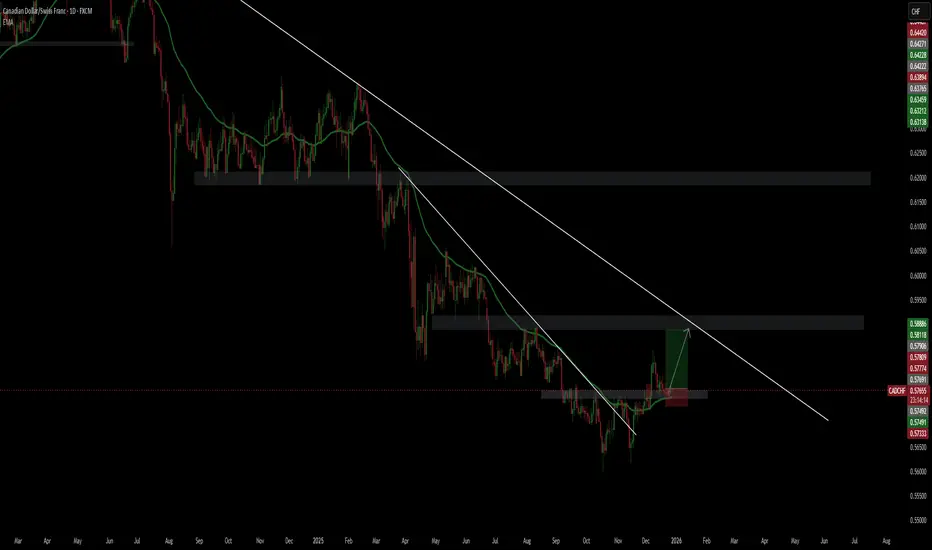
CADCHF LONG SCENARIO Here I'm using a slightly different approach.
So I'm using a 1:3+ RR and not the usual 1:1, because this is kinda different setup and here I'm combining the breakout of the minor resistance zone, which is now a support zone + the breakout of Daily 50 EMA + the breakout of the internal descending trend line (DTL).
Now is retesting all of these 3 indicators with SL not so far below and TP is the Weekly 50 EMA + minor zone + touch of the bigger weekly DTL (I'll put screenshot of the Weekly chart).
!!!- I already have an open trade from 22.12 from around this level here and I'm using only 0.4 risk for this trade, because it's a bit different from my strategy, but I like how the setup looks and everything is adding up perfectly + it's a clean setup.
[GBP/CHF] - Trendline Breakout & Retest - LONG Setup
"Is the long-term bearish trend for GBP/CHF finally over? After months of decline, we are seeing a textbook breakout and retest pattern on the 4H chart. With central bank policies shifting as we head into 2026, this could be the start of a major reversal.
Price has successfully broken out of a long-term bearish trendline, signaling a potential shift from Bearish to Bullish.
It is now retesting the key support zone around 1.06 (Previous Resistance turned Support flip zone).
The alignment of Fibonacci retracement levels at this area adds more weight to a potential bounce.
Order Setup
Entry: Around 1.06672
Stop Loss (SL): 1.06148 (Below the recent swing low)
Take Profit (TP):
TP1: 1.07534
TP2: 1.08095
TP3: 1.08632 (Major Supply Zone)
Risk/Reward Ratio: ~1:3.8
Risk Management: Always follow a risk management strategy and never risk more than you can afford to lose.
🔔 Disclaimer: This is not financial advice. The content is for personal record-keeping and educational purposes only. Traders should conduct their own research before making any trading decisions.

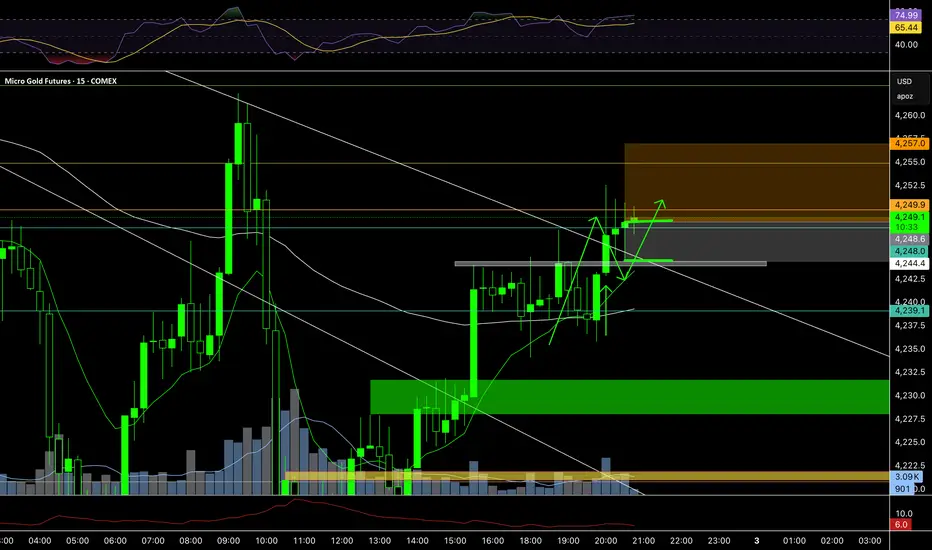
XAUUSD Potential Bullish SetupSetup Watch
🚀 XAUUSD: BULLISH Setup
Objectives
- Target 1: (R:R 1:2)🎯
- Target 2: (R:R 1:3)🎯
- Target 3: (R:R 1:4)🎯
Technical Anticipations:
- Support zone to hold
Position Management:
- partial profits secured at Target 1
- Stop loss adjusted to breakeven upon reaching Targets
- Final Target 3
LIKE or COMMENT if this idea sparks your interest, or share your thoughts below!
FOLLOW to keep up with fresh ideas.
Tidypips: "Keep It Clean, Trade Mean!"

ASIA: B&R/RTime: 20:45 GMT
4H Setup: REV/IBM
4H Confluences: EMA13, RSI reversal break, Weekly Level
15m Setup: B&R/R
15m Confluences: EMA13, EMA89, EMA Cross
Target: 2R
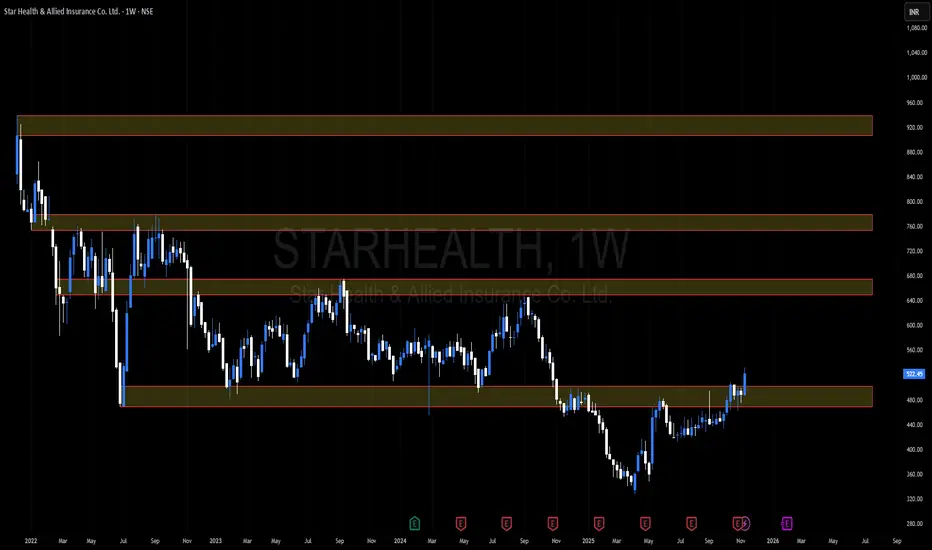
Amazing breakout on WEEKLY Timeframe - STARHEALTHCheckout an amazing breakout happened in the stock in Weekly timeframe, macroscopically seen in Daily timeframe. Having a great favor that the stock might be bullish expecting a staggering returns of minimum 25% TGT. IMPORTANT BREAKOUT LEVELS ARE ALWAYS RESPECTED!
NOTE for learners: Place the breakout levels as per the chart shared and track it yourself to get amazed!!
#No complicated chart patterns
#No big big indicators
#No Excel sheet or number magics
TRADE IDEA: WAIT FOR THE STOCK TO BREAKOUT IN WEEKLY TIMEFRAME ABOVE THIS LEVEL.
Checkout an amazing breakout happened in the stock in Weekly timeframe.
Breakouts happening in longer timeframe is way more powerful than the breakouts seen in Daily timeframe. You can blindly invest once the weekly candle closes above the breakout line and stay invested forever. Also these stocks breakouts are lifelong predictions, it means technically these breakouts happen giving more returns in the longer runs. Hence, even when the scrip makes a loss of 10% / 20% / 30% / 50%, the stock will regain and turn around. Once they again enter the same breakout level, they will flyyyyyyyyyyyy like a ROCKET if held in the portfolio in the longer run.
Time makes money, GREEDY & EGO will not make money.
Also, magically these breakouts tend to prove that the companies turn around and fundamentally becoming strong. Also the magic happens when more diversification is done in various sectors under various scripts with equal money invested in each N500 scripts.
The real deal is when to purchase and where to purchase the stock. That is where Breakout study comes into play.
Check this stock which has made an all time low and high chances that it makes a "V" shaped recovery.
> Taking support at last years support or breakout level
> High chances that it reverses from this point.
> Volume dried up badly in last few months / days.
> Very high suspicion based analysis and not based on chart patterns / candle patterns deeply.
> VALUABLE STOCK AVAILABLE AT A DISCOUNTED PRICE
> OPPURTUNITY TO ACCUMULATE ADEQUATE QUANTITY
> MARKET AFTER A CORRECTION / PANIC FALL TO MAKE GOOD INVESTMENT
DISCLAIMER : This is just for educational purpose. This type of analysis is equivalent to catching a falling knife. If you are a warrior, you throw all the knives back else you will be sorrow if it hits SL. Make sure to do your analysis well. This type of analysis only suits high risks investor and whose is willing to throw all the knives above irrespective of any sectoral rotation. BE VERY CAUTIOUS AS IT IS EXTREME BOTTOM FISHING.
HOWEVER, THIS IS HOW MULTIBAGGERS ARE CAUGHT !
STOCK IS AT RIGHT PE / RIGHT EVALUATION / MORE ROAD TO GROW / CORRECTED IV / EXCELLENT BOOKS / USING MARKET CRASH AS AN OPPURTUNITY / EPS AT SKY.
LET'S PUMP IN SOME MONEY AND REVOLUTIONIZE THE NATION'S ECONOMY!
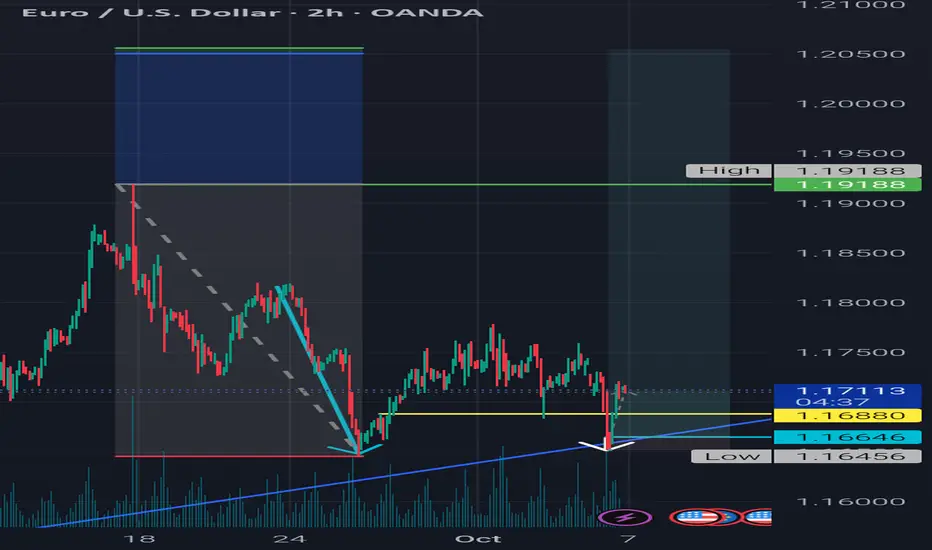
Momentum-Backed Retracement + Volume Retest | BadgerFX 📊 This setup establishes directional bias from the monthly chart (Current Bias: 📈 Bullish). The trade idea integrates momentum-driven retracements in line with this bias and validates continuation through structure and volume on the 15m.
📍 1.16880 confirmed the shift in structure, supported by volume, reinforcing alignment with the monthly trend. Final execution 🎯 relies on candlestick precision for entry timing.
⚠️ Disclaimer: The information shared here is for educational and entertainment purposes only and should not be considered financial advice.
BadgerFX 🦡 – Honey Badger Don’t Care
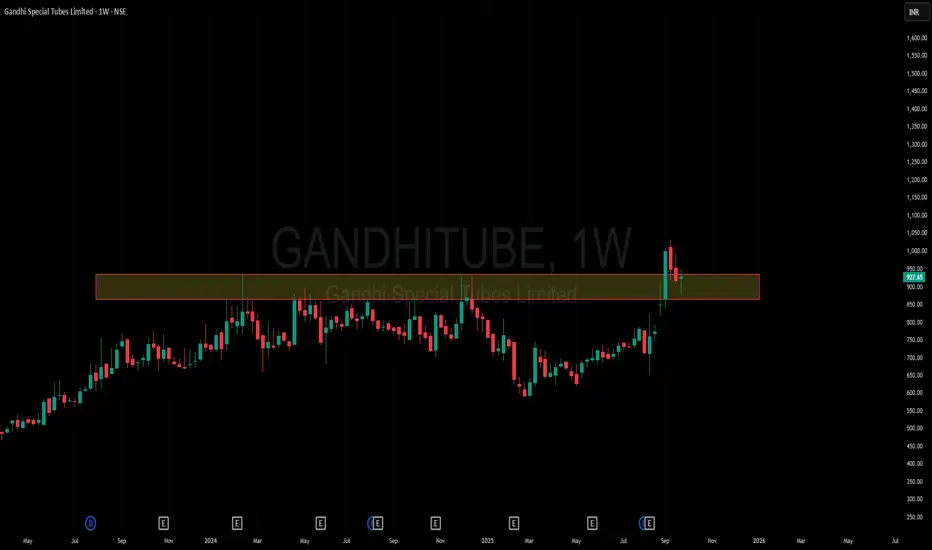
Amazing breakout on WEEKLY Timeframe - GANDHITUBECheckout an amazing breakout happened in the stock in Weekly timeframe, macroscopically seen in Daily timeframe. Having a great favor that the stock might be bullish expecting a staggering returns of minimum 25% TGT. IMPORTANT BREAKOUT LEVELS ARE ALWAYS RESPECTED!
NOTE for learners: Place the breakout levels as per the chart shared and track it yourself to get amazed!!
#No complicated chart patterns
#No big big indicators
#No Excel sheet or number magics
TRADE IDEA: WAIT FOR THE STOCK TO BREAKOUT IN WEEKLY TIMEFRAME ABOVE THIS LEVEL.
Checkout an amazing breakout happened in the stock in Weekly timeframe.
Breakouts happening in longer timeframe is way more powerful than the breakouts seen in Daily timeframe. You can blindly invest once the weekly candle closes above the breakout line and stay invested forever. Also these stocks breakouts are lifelong predictions, it means technically these breakouts happen giving more returns in the longer runs. Hence, even when the scrip makes a loss of 10% / 20% / 30% / 50%, the stock will regain and turn around. Once they again enter the same breakout level, they will flyyyyyyyyyyyy like a ROCKET if held in the portfolio in the longer run.
Time makes money, GREEDY & EGO will not make money.
Also, magically these breakouts tend to prove that the companies turn around and fundamentally becoming strong. Also the magic happens when more diversification is done in various sectors under various scripts with equal money invested in each N500 scripts.
The real deal is when to purchase and where to purchase the stock. That is where Breakout study comes into play.
LET'S PUMP IN SOME MONEY AND REVOLUTIONIZE THE NATION'S ECONOMY!
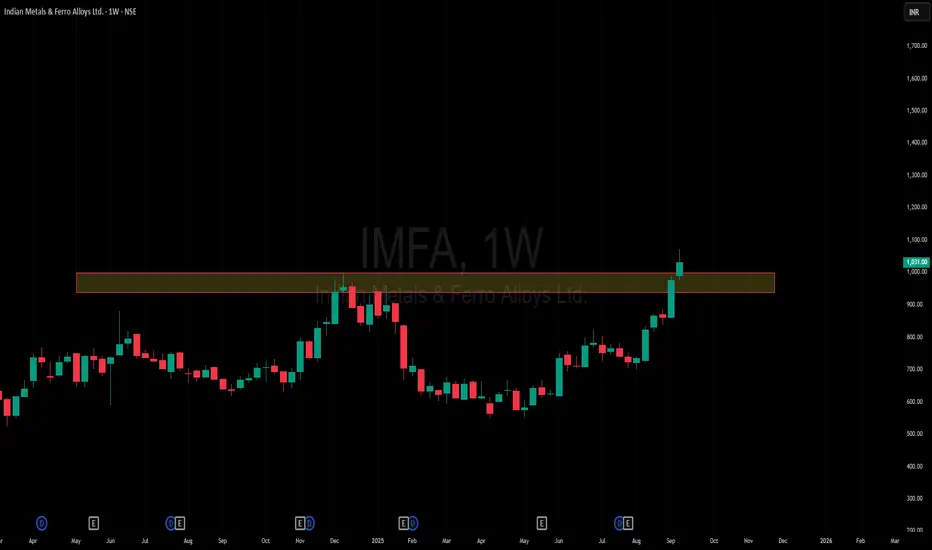
Amazing breakout on WEEKLY Timeframe - IMFACheckout an amazing breakout happened in the stock in Weekly timeframe, macroscopically seen in Daily timeframe. Having a great favor that the stock might be bullish expecting a staggering returns of minimum 25% TGT. IMPORTANT BREAKOUT LEVELS ARE ALWAYS RESPECTED!
NOTE for learners: Place the breakout levels as per the chart shared and track it yourself to get amazed!!
#No complicated chart patterns
#No big big indicators
#No Excel sheet or number magics
TRADE IDEA: WAIT FOR THE STOCK TO BREAKOUT IN WEEKLY TIMEFRAME ABOVE THIS LEVEL.
Checkout an amazing breakout happened in the stock in Weekly timeframe.
Breakouts happening in longer timeframe is way more powerful than the breakouts seen in Daily timeframe. You can blindly invest once the weekly candle closes above the breakout line and stay invested forever. Also these stocks breakouts are lifelong predictions, it means technically these breakouts happen giving more returns in the longer runs. Hence, even when the scrip makes a loss of 10% / 20% / 30% / 50%, the stock will regain and turn around. Once they again enter the same breakout level, they will flyyyyyyyyyyyy like a ROCKET if held in the portfolio in the longer run.
Time makes money, GREEDY & EGO will not make money.
Also, magically these breakouts tend to prove that the companies turn around and fundamentally becoming strong. Also the magic happens when more diversification is done in various sectors under various scripts with equal money invested in each N500 scripts.
The real deal is when to purchase and where to purchase the stock. That is where Breakout study comes into play.
LET'S PUMP IN SOME MONEY AND REVOLUTIONIZE THE NATION'S ECONOMY!
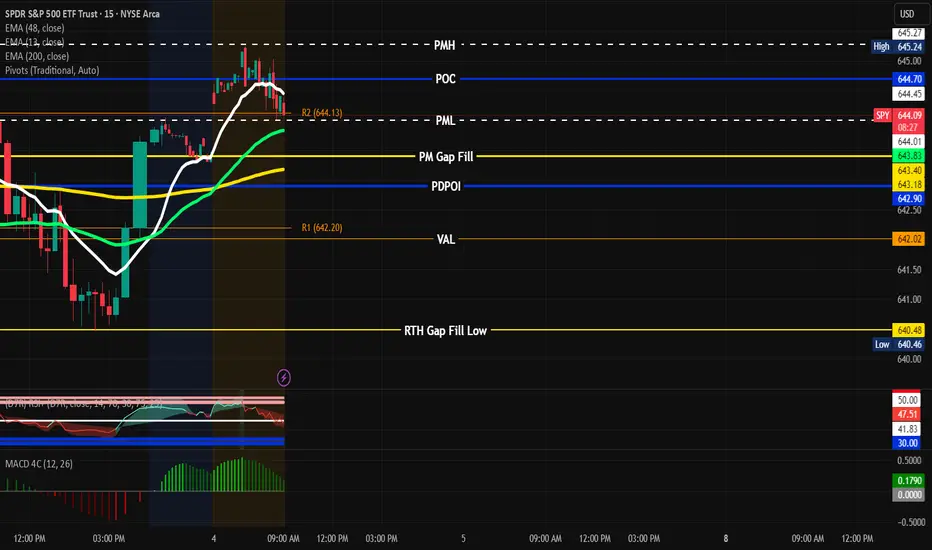
SPY setup 9/4/25PMH 645.27
PML 644.01
POI 645.24
PM Gap Fill 643.40
Range is between 6.43.17-645.27 Look for SPY to go back and retest PMH before coming back down to 644.70. If it breaks through look for it to go to PML 644.01 or Fill the Gap at 643.40. Wait for clear signs before hopping in. If it breaks, retest and hold PML look for PUTs to 642.90-642.20 T/P 1. If it breaks PMH and pullback and hold look to enter for CALL 646.10 T/P 1. You can also use the 9/13 EMA as entry. Use S/L and manage risk properly. Let’s Goooo! “Discipline is the tithe you pay, The reward is financial freedom.” - #You Got Options
Shorting BTCUSDT – Strong HTF Bearish Signals in PlayRecent Price Action:
- First Rejection (8/14): Bitcoin was rejected at the previous ATH (~$102.3K).
- Second Rejection: Price failed to surpass the secondary swing high (~$122.4K), leading to a sharp drop (liquidation of buy orders).
- Rebound Attempt: Price dipped to $106.8K, filling the CME gap and likely triggering short-term short liquidations over the weekend. However, the rebound lacked sustainability.
- Breakdown Confirmation: On Monday’s market open, BTC broke below key support, extending the drop to the 0.786 Fib level (~$114.6K).
Market Structure Shift (Higher Timeframe Confirmation):
- The breakdown invalidated the prior bullish structure on H4+ timeframes, confirming a bearish bias.
- The inability to hold above key levels and the liquidation-driven moves suggest weakening demand.
Short Setup Opportunity:
- Ideal Entry Zone: 116.8K - 117K
- SL: ~118k
- TP: ~112k
- Confluence: 0.618 Fib retracement from recent swing high.
Rejection at this zone would further validate bearish continuation.

A potential break and retest on MS.OptionsMastery:
🔉Sound on!🔉
📣Make sure to watch fullscreen!📣
Thank you as always for watching my videos. I hope that you learned something very educational! Please feel free to like, share, and comment on this post. Remember only risk what you are willing to lose. Trading is very risky but it can change your life!

A potential Swing Trade soon on SPY!?OptionsMastery:
🔉Sound on!🔉
📣Make sure to watch fullscreen!📣
Thank you as always for watching my videos. I hope that you learned something very educational! Please feel free to like, share, and comment on this post. Remember only risk what you are willing to lose. Trading is very risky but it can change your life!

DXY Update: Monthly Low Retest on the RadarIn our previous update, we mentioned that our target had been reached and even noted the potential for higher prices. However, we also emphasized the need to wait for fresh signals at that point. After hitting the target, the price faced a sharp drop followed by another sell-off rally.
At the current level, we’re seeing a slowdown in DXY’s selling momentum. However, this alone isn’t sufficient to determine direction. While momentum may be fading, if sellers remain dominant, we’ll see bearish signs on the chart. If buyers regain control, bullish signs will emerge. With this straightforward logic in mind, we’re currently watching for a potential return to the fractal low level at 97.921, which was swept on the monthly chart.
Since it’s monthly close day, sharp intraday pullbacks may occur. As July opens, we believe there’s a possibility of a retracement toward the 97.921 level.
We’ll share any volume-based confirmations in the comments under this post.

Brent Oil Breakdown – Rejection & Freefall From Channel HighsBrent Oil delivered a textbook reversal last week.
After weeks of climbing within a rising channel, price printed a strong rejection wick at the upper boundary (~$79.45), then followed through with a violent sell-off, slicing through structure and breaking the channel cleanly.
🔍 Key Levels:
• Rejection High: $79.45
• Structure Break: $74.89 (former support, now resistance)
• 4H Demand Zone: $66.00–$69.00
• Daily Demand Confluence: Aligned with 4H zone
On the 1H and 23min, we’re now seeing price trying to stabilise above $69.80 — right on top of the 4H and daily zone confluence.
📉 Bias:
Currently bearish below $74.89.
A clean retest of that level could offer continuation entries.
However, price is now in a high-probability reaction zone, so intraday longs are possible if price shows strength above $70.
⛽ Watch For:
• Bullish price action around $68.50–$70.00
• Weak retracements into $72–$73 for potential short entries
• Break below $66.00 could open floodgates back toward $63 and $60.00

Nasdaq - This starts the next +50% rally!Nasdaq - TVC:NDQ - might break out soon:
(click chart above to see the in depth analysis👆🏻)
Despite the quite harsh correction of about -25% which we saw in the beginning of 2025, the Nasdaq is clearly heading for new all time highs. It sounds almost incredible but if the Nasdaq breaks above the current confluence of resistance, a breakout rally of +50% will follow thereafter.
Levels to watch: $21.500, $33.000
Keep your long term vision!
Philip (BasicTrading)

Dogecoin - Don't forget the dog now!Dogecoin - CRYPTO:DOGEUSD - still remains quite bullish:
(click chart above to see the in depth analysis👆🏻)
Basically during every major bullrun on Dogecoin, we always saw a correction of at least -60%. Therefore the recent drop of -70% was not a surprise at all but rather a natural all time high rejection. If Dogecoin manages to now create bullish confirmation, the bullrun will continue.
Levels to watch: $0.2. $0.5
Keep your long term vision!
Philip (BasicTrading)

Meta Platforms - The rally is clearly not over!Meta Platforms - NASDAQ:META - can rally another +30%:
(click chart above to see the in depth analysis👆🏻)
Some people might say that it seem counterintuitive to predict another +30% rally on Meta Platforms while the stock has been rallying already about +750% over the past couple of months. But price action and market structure both tell us, that this will soon turn into reality.
Levels to watch: $850
Keep your long term vision!
Philip (BasicTrading)

Microsoft - This might be the ultimate breakout!Microsoft - NASDAQ:MSFT - will break the all time high:
(click chart above to see the in depth analysis👆🏻)
If you wonder why Microsoft has been rallying +15% this month, market structure will give you an answer. In fact, the recent bullish break and retest was totally expected, and if we take into account the recent quite strong bullish behaviour, an all time high breakout will follow soon.
Levels to watch: $450
Keep your long term vision!
Philip (BasicTrading)

Tesla - There's more after the +60% rally!Tesla - NASDAQ:TSLA - will blow even further:
(click chart above to see the in depth analysis👆🏻)
It is almost incredible to see such a large cap stock rally more than +60% in less than two months. But Tesla is clearly the exception and therefore we should expect the unexpected. What's quite likely is at least another rally of about 25% from here and a retest of the previous all time high.
Levels to watch: $250, $400
Keep your long term vision!
Philip (BasicTrading)

Ethereum - The most important analysis for 2025!Ethereum - CRYPTO:ETHUSD - is clearly shifting bullish:
(click chart above to see the in depth analysis👆🏻)
After four years of trading, Ethereum is now sitting at the exact same level compared to mid 2021. However, Ethereum has been creating a significant triangle pattern and with the recent bullish price action, a breakout becomes more and more likely. Then, the sky is the limit.
Levels to watch: $4.000
Keep your long term vision!
Philip (BasicTrading)

Xrp - New all time highs will come next!Xrp - CRYPTO:XRPUSD - is preparing for new all time highs:
(click chart above to see the in depth analysis👆🏻)
Xrp has clearly been trading sideways for the past 8 years. Meanwhile, market structure is respected perfectly and it seems to be just a matter of time until Xrp will create new all time highs. With the recent bullish break and retest, this scenario becomes even more likely.
Levels to watch: $3.0
Keep your long term vision!
Philip (BasicTrading)

Alibaba - This was just the obvious bottom!Alibaba - NYSE:BABA - will head much higher:
(click chart above to see the in depth analysis👆🏻)
Ever since Alibaba actually retested the previous all time low in 2022, we have been able to see the textbook creation of a rounding bottom formation. Even the recent break and retest was perfectly playing out and if Alibaba confirmes the potental breakout, a rally of +50% will most likely follow.
Levels to watch: $140, $220
Keep your long term vision!
Philip (BasicTrading)
