#BTC/USDT: Head & Shoulders Breakdown – $95K Incoming?Hey Traders!
If you’re finding value in this analysis, smash that 👍 and hit Follow for high-accuracy trade setups that actually deliver!
Bitcoin just broke below the neckline of a clear Head & Shoulders pattern on the 4H timeframe — a classic bearish signal.
As long as price stays below the neckline and fails to reclaim the $106.5K zone, we could be heading for a deeper correction toward the $95K–$98K support range.
Key Levels:
Breakdown Zone: ~$103.9K
Downside Target: $95K–$98K
Invalidation: Reclaim above $106.5K
Market is showing consistent weakness — small bounces are quickly sold off.
Let the pattern play out and manage your risk accordingly.
What do you think — short-term dip or deeper breakdown loading?
Breakdown

Breakdown Alert: Crypto Market Cap Tests Major Demand ZoneThe total crypto market cap is testing a key support zone around $3.23T. This area has acted as a demand zone in the past, and now price is hovering right above it.
The current structure suggests a possible breakdown–retest–continuation setup. If price retests this zone from below and fails to reclaim it, further downside toward $3.0T could be likely.
This idea is based on price action and structure only — no indicators used.
❗ This is a personal analysis for educational purposes only. Not financial advice.
Feel free to share your thoughts or technical perspective in the comments

"SOL Market Cap Breakdown Setup| Bearish Retest Targeting 83.3B"SOL Market Cap is showing signs of a potential breakdown after a series of lower highs and a bearish retest of previous support. Price is currently retesting the breakdown level. If confirmed, the next support zone is near 83.3B.
This is a technical analysis-based observation, not financial advice. Always manage risk and confirm with your own strategy before making any decisions.

DOGE|Bearish Triangle Formation On30-Min Chart-Breakdown Ahead?📉 DOGE Bearish Triangle Breakdown | 30-Min Chart
This chart highlights a classic *bearish triangle formation* in DOGE's market cap on the 30-minute timeframe. The pattern shows a series of lower highs with horizontal support around the 32.45B zone.
🔍 Key Observations:
- Pattern: Bearish Triangle
- Resistance: ~34.7B
- Support Zone: ~32.45B
- Target Zone (Post-Breakdown): ~31.3B
A breakdown below the support level could signal further downside movement. However, confirmation is key — traders should watch for volume and candle close below support.
🕒 Timeframe: 30-Minute Chart
📆 Analysis Date: May 29, 2025
---
⚠ *Disclaimer:*
This analysis is shared purely for *educational purposes* and does not constitute financial advice. Please do your own research and risk management before making any trading decisions.

EURGBP - NEW BREAKDOWNHello Traders !
The EURGBP reached the resistance level (0.87176 - 0.87660) and failed to break it !
The price broke the support level (0.84736 - 0.84322).
So, I expect a bearish move📉
______________
TARGET: 0.83450🎯

BTC DOMINANCE AT CRUCIAL LEVEL! When Alt season? 🚀 Hey Traders! 👋
If you’re finding value in this analysis, smash that 👍 and hit Follow for high-accuracy trade setups that actually deliver! 💹🔥
Bitcoin dominance is once again hovering around the key resistance zone (~64%) that previously triggered a sharp rejection and boosted altcoins. 🚨
🟢 What we're watching:
Dominance bounced back after a breakdown from the rising wedge 📉
It's now retesting the breakdown zone (red resistance)
A rejection here = Altcoin Rally 🎯
A clean breakout above = Altcoins stay weak ⚠️
⏳ We’re at a decision point. Altcoin bulls are watching this zone very closely.
🧠 Our take:
Until BTC.D rejects from this level, don’t expect a full-blown Altseason. A strong red candle from here could open the floodgates for mid and low caps to run wild again. 🚀
📌 Stay patient, stay positioned. The move will be big—just a matter of “when.”

USDCAD - NEW BREAKDOWN !Hello Traders !
After a huge bearish move, The USDCAD price broke the support level (1.37506 - 1.37814).
This key level becomes new resistance!
So, I expect a new bearish move📉
_______________
TARGET: 1.36480🎯

GBPJPY - Important BreakdownHello Traders !
The GBPJPY failed to create a new higher high.
The price broke the support line!
So, I expect a bearish move📉
________________
TARGET: 190.680🎯

NATGAS - NEW BREAKDOWN !Hello Traders !
The Naturalgas price failed to create a new higher high!
The higher low is broken (change of character).
So, I expect a bearish move📉
_____________
TARGET: 3.0950🎯

CHFJPY - BEARISH MOVEHello Traders !
On Tuesday 13 May, The CHFJPY reached a strong resistance level (176.482 - 176.010).
The price broke the higher low (change of character).
So, I expect a bearish move📉
________________
TARGET: 173.280🎯

CADJPY - Bearish Rising WedgeHello Traders !
The CADJPY price formed a rising wedge pattern.
The price broke the support line.
So, I expect a bearish move📉
_______________
TARGET: 103.655🎯

GOLD - Bearish Double TOPHello Traders !
The GOLD failed to create a new higher high !
The price formed a double top pattern.
Currently, The neckline is broken !
So, I expect a bearish move📉
________________
TARGET: 3022🎯

EURCAD - Bearish Double TOPHello Traders !
The EURCAD failed to break the resistance level (1.59934 - 1.59334).
The price formed a double top pattern.
Currently, The neckline is broken !
So, I expect a bearish move📉
________________
TARGET: 1.54350🎯

NZDUSD is preparing for a reversal and a fallNZDUSD is in consolidation and preparing to exit it. Ahead is possible breakout of trend support and fall to 0.5757
The reason is as follows: change of fundamentals background (positive signals on tariff war), dollar growth and market reversal.
Scenario: break of consolidation support at 0.5885, price consolidation below this level - this will be a signal ready to start distribution, i.e. downward movement.
Primary target 0.5 fibo, secondary target 0.7 fibo

I'm shorting thisTwo weekly timeframe for a better understanding. Looks like a large bearish flag forming. Price just bounce off the bottom of the flag. But I think is a dead cat bounce. Is hitting a resistance level 35-36. Doesn't look too sting to break it up. SL triggers if a weekly candle breaks up the resistance and closes above it.

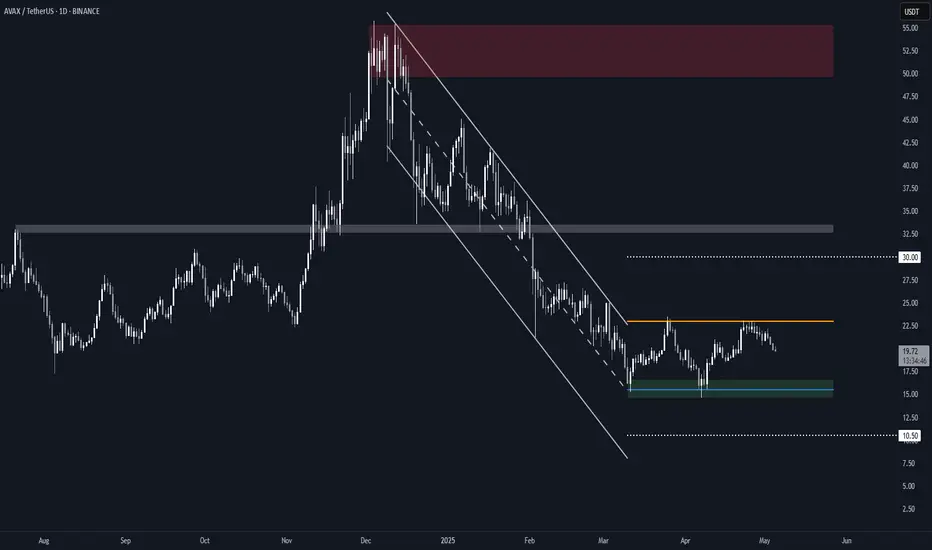
Avalanche (AVAX) RectangleBINANCE:AVAXUSDT is trading within a well-defined rectangle, after breaking out of a steep falling channel earlier this year.
Key Observations
• The current range has two clear touches on both support ($15.50) and resistance ($23.00), forming a valid rectangle structure.
• This follows a sideways channel breakout, suggesting a consolidation phase which is often a precursor to a larger move.
Range Levels
• Resistance – $23.00: Capped price twice in April, marking the upper bound of the rectangle.
• Support – $15.50: Held firmly on two separate pullbacks.
• Midrange Bias – As long as AVAX remains within this box, directional conviction remains limited.
Breakout/Breakdown Scenarios
• Bullish Breakout: If AVAX closes decisively above $23.00, the measured target would be ~$30, based on the rectangle height projected upward (linear scale).
• Bearish Breakdown: If it loses $15.50 support, the downside target becomes $10.50, calculated using the same rectangle height on log scale (to reflect proportional downside risk).
Until either side breaks, this remains a range-trading environment.
GOLD - Bearish Head and ShouldersHello Traders !
The GOLD price formed a head and shoulders pattern.
Currently, The neckline is broken !
So, I expect a bearish move📉
_______________
TARGET: 3170🎯

EURAUD - Bearish Head and ShouldersHello Traders !
The EURAUD failed to create a new higher high!
The price formed a head and shoulders pattern.
At the moment, The neckline is broken !
So, I expect a bearish move📉
_______________
TARGET: 1.71900🎯

NZDCAD - Bearish Triple TOPHello Traders !
On Monday 21 April, The NZDCAD reached the resistance level (0.83146 - 0.82973).
The price formed a triple top pattern.
Currently, The neckline is broken !
So, I expect a bearish move📉
______________
TARGET: 0.80610🎯

SILVER - BEARISH SCENARIOHello Traders !
The Silver price failed to create a new higher high !
Let's expect the bearish scenario:
If the market breaks the higher low and closes below that,
We will see a bearish move📉
TARGET: 31.23🎯

USOIL - Bearish Double TOPHello Traders !
The USOIL price formed a double top pattern.
Currently, The neckline is broken !
So, I expect a bearish move📉
________________
TARGET: 59.410🎯

AUDNZD - BEARISH MOVEHello Traders !
After a huge bearish move, The AUDNZD broke the support level (1.07312 - 1.07522).
This key level becomes new resistance!
So, I predict a bearish move📉
_______________
TARGET: 1.06100🎯

SPY/QQQ Plan Your Trade Update : EPP Flag Setup CompleteI created this video to highlight the current EPP Flag setup in the SPY/ES.
It is my opinion that the market are about ready to ROLL OVER into a downward trend because of this current EPP setup.
Once the FLAG forms (in this case a BULLISH FLAG), the next phase is a BREAKDOWN INTO CONSOLIDATION.
It is my belief the current FLAG will prompt a breakdown in price - moving into a lower consolidation range.
I'm highlighting this EPP pattern to help everyone learn how to use them more efficiently.
Get ready. If I'm right, we're going to see a big move downward over the next 2-4+ days.
Get some...
#trading #research #investing #tradingalgos #tradingsignals #cycles #fibonacci #elliotwave #modelingsystems #stocks #bitcoin #btcusd #cryptos #spy #gold #nq #investing #trading #spytrading #spymarket #tradingmarket #stockmarket #silver
