SPX500 H4 Buy Setup Bullish Channel Hold + Order Block RejectionSPX500 – H4 BUY Analysis (Bullish Continuation)
Market Context:
Price is moving within a well-defined bullish channel, keeping the higher-timeframe bias bullish as long as the channel low holds. Previously, price respected an internal bullish Order Block, from which strong bullish displacement was observed, confirming institutional buying interest.
Smart Money Structure:
After the Order Block retest, price delivered a strong bullish reaction, confirming active buyers. A CHOCH (Change of Character) followed, indicating a shift of short-term control to the buyers. This was further validated by a clear BOS (Break of Structure), confirming bullish continuation.
Current Price Action:
Following the BOS, price pulled back into a fresh bullish Order Block. At this zone, a clear rejection is visible, highlighting a high-probability demand area.
Trade Plan – BUY:
Buy from the Order Block rejection zone, with the stop loss placed below the Order Block. The upside target is 7050.0, aligned with the channel upper boundary and previous highs.
Why This Setup Is High Probability:
The bullish channel remains intact, Order Block retest and reaction are confirmed, CHOCH and BOS support trend continuation, price has pulled back into demand, and rejection shows buyers are active.
Invalidation:
If an H4 candle closes below the Order Block, the setup becomes invalid.
Disclaimer
This analysis is for educational purposes only and does not constitute financial advice. Market conditions can change at any time. Always manage risk properly and make trading decisions based on your own analysis and risk tolerance.
Breakofstructure

(USOIL) 2H – Bullish Continuation After Trend ReversalThis 2-hour chart of WTI Crude Oil (USOIL) shows a clear transition from a prior downtrend into a structured bullish recovery. After forming a base near the mid-$55 area, price breaks structure (BOS) and establishes a steady uptrend, guided by an ascending channel.
The Ichimoku Cloud supports the bullish bias, with price trading above the cloud and the cloud turning positive. A clean pullback into a demand zone around 57.0–57.5 aligns with previous consolidation and cloud support, suggesting a potential buy-the-dip area.
Price is currently consolidating above a change in structure (CISD), indicating strength. Upside projections highlight two key resistance targets:
1st target: around 59.10
2nd target: near 60.45
As long as price holds above the demand zone and trend channel support, the bullish continuation scenario remains valid.

BTCUSD.P — Wick Above High ≠ Bullish Break of Structure📌 BTCUSD.P — Wick Above High ≠ Bullish Break of Structure
Timeframe: 15m
Market: BTC Perpetual (Bybit)
🧠 Key Observation
Price did not break structure bullishly here.
Although BTC wicked above the prior high, there was no full-bodied close above the previous high’s wick. That distinction matters.
A wick alone shows reach.
Structure requires acceptance.
🔍 What This Means
The prior high was tested and liquidity was taken
Buyers failed to secure a close above resistance
Price immediately stalled rather than expanding
This behavior is consistent with a liquidity sweep, not a confirmed bullish shift in market structure.
⚠️ Why Early Longs Are Dangerous Here
Entering long on the first touch or wick break:
Assumes continuation before confirmation
Exposes the trade to a sweep-and-reverse scenario
Treats intent as fact
In this context, an early long can easily become exit liquidity.
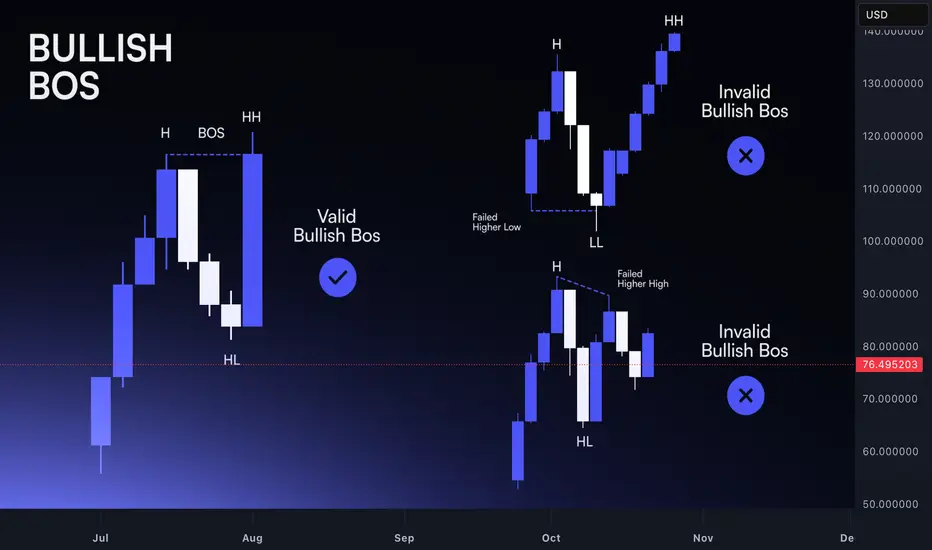
✅ What a Real Bullish Break Would Require
For this to qualify as a valid Bullish BoS:
A decisive candle body close above the previous high’s wick
Follow-through or acceptance above the level
No immediate reclaim back below resistance
Until then, structure remains unbroken.
🧭 Execution Guidance
Patience > prediction
Let the market prove acceptance
If price reclaims the level with strength, bias can flip
If price rejects, the sweep thesis gains validity
Structure is not about being early.
It’s about being right after confirmation.
🧾 Final Thought
Wicks hunt liquidity.
Bodies establish control.
Knowing the difference keeps you solvent.
❗ Disclaimer
Educational purposes only.
Not financial advice.

Break of Structure: Identifying Real Trend Shifts Markets move in phases, and structure is the clearest way to read those transitions. A trend doesn’t reverse because price slows down or because a candle looks different. It reverses when the underlying pattern of highs and lows breaks.
Understanding this sequence is what separates disciplined analysis from reactive guessing.
In an uptrend, buyers defend higher lows and push price into higher highs. As long as this structure holds, the trend is intact. Noise may create deep pullbacks or temporary hesitation, but the narrative remains unchanged.
The first sign of vulnerability appears when price fails to create a meaningful higher high. Momentum stalls, and the next push upward shows less conviction.
The real shift comes when a higher low is taken out. This is the break of structure. It shows that buyers no longer control the market, and sellers have absorbed enough liquidity to push through a prior defensive point.
This is not a prediction; it’s an objective change in the market’s behaviour. A single candle doesn’t define it. The sequence does.
For downtrends, the logic is the same in reverse. Lower highs and lower lows define control. When price fails to print a clean lower low and then breaks a prior lower high, the trend loses integrity. Structure reveals the turning point before sentiment catches up.
However, not every break is a real shift. Crypto produces countless intraday spikes that violate levels without altering the broader narrative.
The difference lies in context. A valid break is supported by:
– Clear momentum into the break
– Liquidity taken before the shift
– Follow-through after the level is broken
– A retest that confirms the new direction
These factors filter out noise and highlight genuine transitions. Watching price break structure is not enough; you must also assess whether the move fits within the larger story of the trend.
A break of structure doesn’t mean instant reversal. It means the previous trend has ended. The next phase might be consolidation, re-accumulation, or immediate reversal, but the bias shifts the moment structure changes.
Traders who read structure objectively adjust earlier and avoid fighting a direction that no longer has control.
Once you internalize how highs and lows interact, spotting real shifts becomes a structured process instead of an emotional reaction. Structure turns confusion into clarity and gives you a reliable framework for navigating both trends and transitions.
GBPUSD Retracement Idea for a new Lower HighHi Traders!
Since my last idea GU reached my short target around 1.30000. I'm now looking for price to retrace to a previous bearish BOS area around 1.32500-1.33000. If price can create a new lower high in that area we could possibly see more bearish movement. In addition, if DXY can hold around 99.000-99.500, and continue reversing to the upside I'd have a new swing target for GU at the next Daily OB around 1.29000-1.28500.
1st alert set just below 1.32500 in case price doesn't make it to my target.
*DISCLAIMER: I am not a financial advisor. The ideas and trades I take on my page are for educational and entertainment purposes only. I'm just showing you guys how I trade. Remember, trading of any kind involves risk. Your investments are solely your responsibility and not mine.*

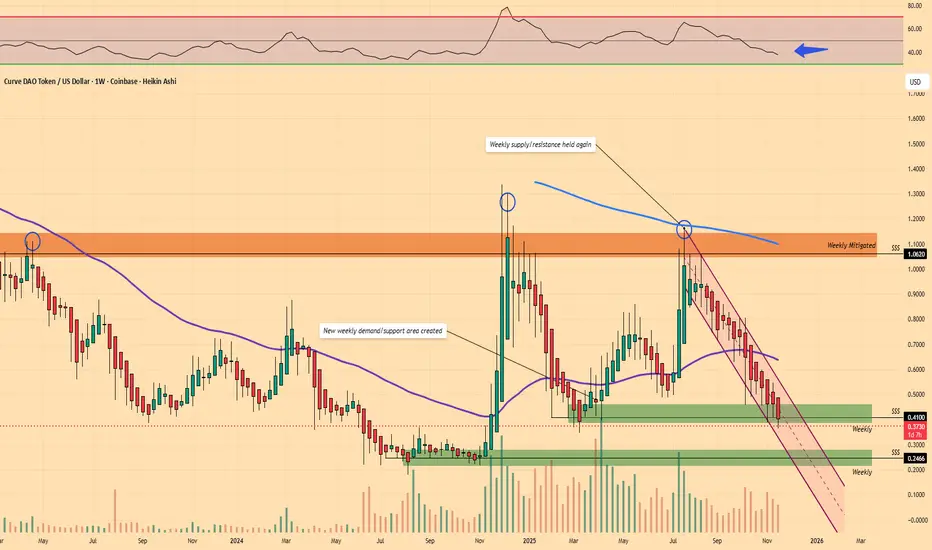
$CRV / Curve Finance - DeFi Play?Called the move back in May and we are back (due to the weekly resistance/supply holding) retesting a fresh weekly demand/support zone trading below the 50MA.
Hello old friend.
..still a good place to accumulate spot here (once I see buyers) for a quality project.
Market Structure 101: Navigating Price ActionMost traders jump directly into indicators, oscillators, or patterns. Yet every chart has a deeper foundation that determines direction long before any tool is applied. Market structure is that foundation. When you understand how price forms highs, lows, and transitions between them, you stop reacting to noise and start reading the market’s intent. It is the base layer that allows you to build a clear, consistent bias.
Price moves because buyers and sellers interact around key levels. Structure highlights where momentum strengthens, weakens, or reverses. By tracking how highs and lows evolve, you can identify trend, consolidation, and shifts in direction with far more clarity than any indicator can offer. Market structure is objective. It gives you a rule-based lens to interpret movement across all timeframes.
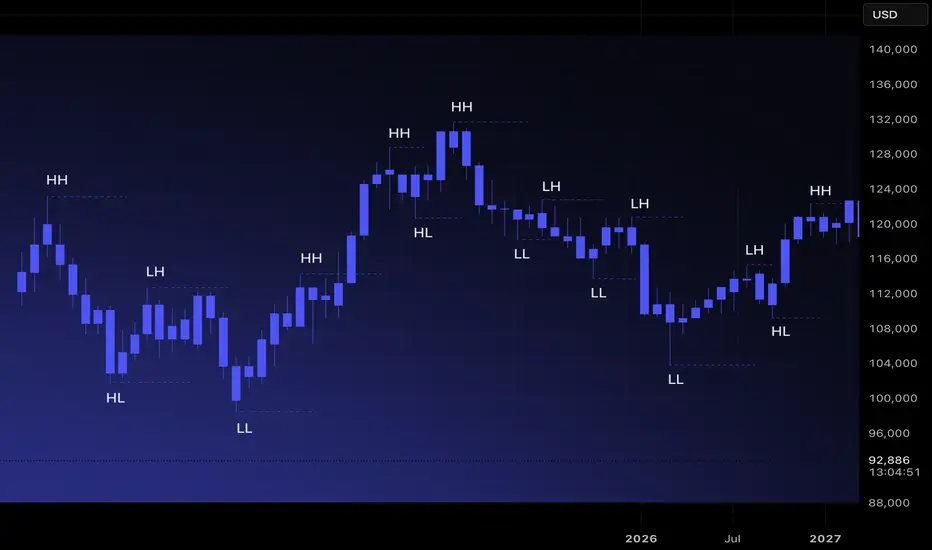
Understanding Highs and Lows
There are four structural components every trader must recognize.
Higher High (HH): Price breaks above a previous high, showing buyers in control.
Higher Low (HL): Price pulls back but stays above the prior low, confirming trend continuation.
Lower High (LH): Price rallies but fails to reach previous highs, indicating weakening demand.
Lower Low (LL): Price breaks below the previous low, signaling sellers taking control.
These sequences are the building blocks of trend identification. When mapped correctly, they remove guesswork and reveal underlying momentum.
Identifying Uptrends and Downtrends
Uptrend: A sequence of HHs and HLs. Buyers consistently push price higher and defend higher floors.
Downtrend: A sequence of LHs and LLs. Sellers control direction, rejecting higher prices and driving the market downward.
A trend remains intact until structure breaks. This is why experienced traders avoid predicting reversals and instead follow structural evidence. When the market prints new HHs and HLs, the bias remains long. When LLs and LHs appear, the bias rotates short.
Ranges and Consolidation
Markets do not trend all day. Much of the time, they move sideways. A range occurs when highs and lows stay relatively equal, creating a horizontal zone with equal highs and equal lows. This is where compression happens. Liquidity builds above the range highs and below the range lows, and trend often resumes only after one side of the range is taken.
In ranges, structure becomes neutral. Bias is formed only when price breaks out and retests with confirmation.
Break of Structure(BOS) and Trend Shift
A break of structure occurs when the market violates the pattern of the existing trend. In an uptrend, a break occurs when price prints an LL. In a downtrend, a break occurs when price forms an HH. This signals a potential shift in momentum.
Breaks of structure matter because they identify turning points without relying on subjective signals. They show where one side loses control and the other gains traction. They also create clear invalidation points for risk management.
How to Read Structure Across Timeframes
Market structure becomes even stronger when used across multiple timeframes. The higher timeframe sets the primary bias. The lower timeframe provides entry precision.
Weekly or Daily: Structural trend and major zones.
4H or 1H: Execution windows and key shifts.
15m and 5m: Entry confirmation.
When all levels of structure align, the probability of a clean move increases significantly.
Avoiding Common Mistakes
Many traders misread structure by focusing on every small fluctuation. Structure is defined by meaningful swings, not micro noise. Another common error is assuming a single HH or LL immediately reverses a trend. Context matters. Breaks followed by continuation and retests confirm the shift. A disciplined trader waits for structure to become clear instead of acting on isolated candles.
Turning Structure Into a Bias
Structure simplifies decision-making.
If the market is printing HH and HL formations, you prioritize longs.
If it is printing LH and LL formations, you seek shorts.
If highs and lows are equal, you wait for a breakout.
LAST BIT OF THE LEG TO THE UPSIDE THEN DUMPOANDA:XAUUSD
Currently, I have a pending long position waiting to trigger at 4090.250. This level represents the 50% retracement between the recent Higher High (HH) and Higher Low (HL) — a zone where price often finds strong support during a healthy uptrend. The logic here is that the market may retrace halfway through its previous impulsive leg before resuming its upward momentum.
My stop loss is placed just below the last Higher Low at 4074.400, specifically at 4071.400.
This placement gives the trade some breathing room to absorb minor fluctuations, while still maintaining a disciplined exit point if the market structure breaks.
It’s a well-structured OANDA:XAUUSD
Currently, I have a pending long position waiting to trigger at 4090.250. This level represents the 50% retracement between the recent Higher High (HH) and Higher Low (HL) — a zone where price often finds strong support during a healthy uptrend. The logic here is that the market may retrace halfway through its previous impulsive leg before resuming its upward momentum.
My stop loss is placed just below the last Higher Low at 4074.400, specifically at 4071.400.
This placement gives the trade some breathing room to absorb minor fluctuations, while still maintaining a disciplined exit point if the market structure breaks.
It’s a well-structured stop — tight enough to protect capital, but not so close that normal volatility knocks the trade out prematurely.
If the trade activates and begins to move in my favor, the profit target is set near 4126, which aligns closely with the prior Higher High zone. This level represents the next key resistance area, and taking profits there is a smart way to capture gains before the market potentially pauses or reverses.
Expected Market Behavior After the Target
Once price reaches the 4126 region, I anticipate a potential pullback or correction. This could happen either rapidly or as a gradual decline, depending on market momentum and volume conditions at the time.
The corrective zone I’ll be watching is between 3950–3960, an area that may offer another opportunity for strategic LONG entries once price stabilizes.
This projected decline aligns with the natural ebb and flow of market cycles — impulsive moves followed by retracements. Traders should be cautious around this region, as volatility may increase and sentiment could shift quickly.
Key Levels Recap
Level Type Description
4090.250 Entry 50% retracement from HH–HL, ideal long setup zone
4071.400 Stop Loss Below HL (4074.400), invalidation point for the setup
4126.000 Target Retest of the HH / resistance area
3950–3960 Watch Zone Potential correction target after reaching 4126
Final Notes & Trader Caution
This setup has a clear structure, logical entry, and disciplined stop — all the hallmarks of a professional plan. However, it’s crucial to emphasize:
⚠️ Do not enter emotionally.
Wait patiently for price to retrace into your zone. If the market fails to return to that level and continues higher, let it go — there will always be another setup. Emotional chasing often leads to poor entries and unnecessary losses.
Monitor price action closely as it approaches 4126. If signs of exhaustion (like equal highs or divergence) appear, that’s your cue that the next leg down toward 3950/3960 may be developing.stop — tight enough to protect capital, but not so close that normal volatility knocks the trade out prematurely.
If the trade activates and begins to move in my favor, the profit target is set near 4126, which aligns closely with the prior Higher High zone. This level represents the next key resistance area, and taking profits there is a smart way to capture gains before the market potentially pauses or reverses.
Expected Market Behavior After the Target
Once price reaches the 4126 region, I anticipate a potential pullback or correction. This could happen either rapidly or as a gradual decline, depending on market momentum and volume conditions at the time.
The corrective zone I’ll be watching is between 3950–3960, an area that may offer another opportunity for strategic LONG entries once price stabilizes.
This projected decline aligns with the natural ebb and flow of market cycles — impulsive moves followed by retracements. Traders should be cautious around this region, as volatility may increase and sentiment could shift quickly.
Key Levels Recap
Level Type Description
4090.250 Entry 50% retracement from HH–HL, ideal long setup zone
4071.400 Stop Loss Below HL (4074.400), invalidation point for the setup
4126.000 Target Retest of the HH / resistance area
3950–3960 Watch Zone Potential correction target after reaching 4126
Final Notes & Trader Caution
This setup has a clear structure, logical entry, and disciplined stop — all the hallmarks of a professional plan. However, it’s crucial to emphasize:
⚠️ Do not enter emotionally.
Wait patiently for price to retrace into your zone. If the market fails to return to that level and continues higher, let it go — there will always be another setup. Emotional chasing often leads to poor entries and unnecessary losses.
Monitor price action closely as it approaches 4126. If signs of exhaustion (like equal highs or divergence) appear, that’s your cue that the next leg down toward 3950/3960 may be developing.

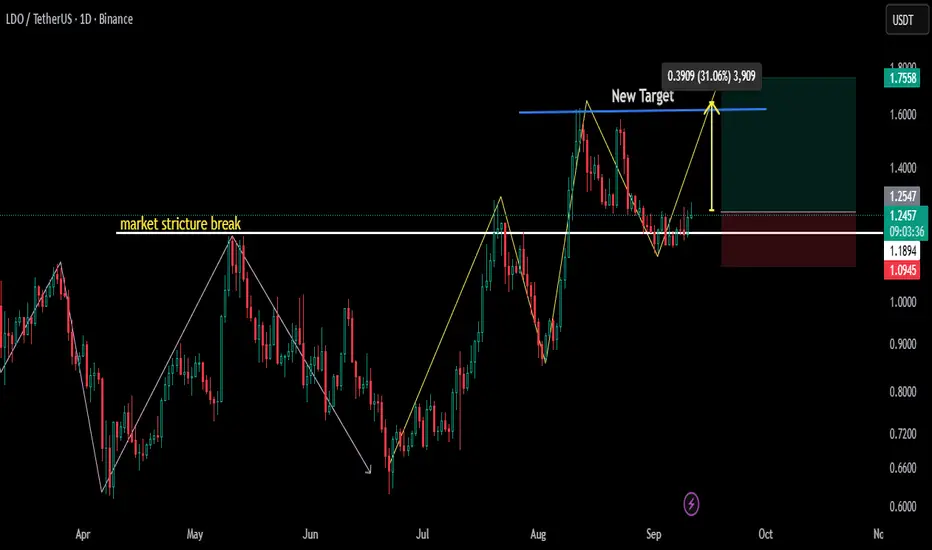
Market Structure Breaks LDOUSDT 1Day charts time for bullsPreviously market are in down trend in daily charts lower highs and lower lows now market structure breaks and time for uptrend ..
STOPLOSS .. Below higher low
PAIR... LDOUSDT
TREND,, Market structure Breaks
GBPUSD Bullish or Bearish?Hi Traders!
When analyzing this chart, price made a move to the downside making a low at 1.34000, came up to test 1.36000 to then revisit a daily OB at 1.32000 creating a bearish BOS. However, price didn't close below the previous daily OB low, and pushed back up to the resistance level at 1.36000. Price is now sitting in a range.
If a long presents itself, I would like to see a daily CHOCH happen, price closed above 1.36000 with strength (not just a wick), follow through with bullish confirmation, and 1.36000 retest/new support. Therefore, IMO, this move can still be viewed as a retracement within a bearish structure. For now, I'm waiting for price to show me a solid direction.
Good Luck to all!
*DISCLAIMER: I am not a financial advisor. The ideas and trades I take on my page are for educational and entertainment purposes only. I'm just showing you guys how I trade. Remember, trading of any kind involves risk. Your investments are solely your responsibility and not mine.*

Break of Structure (BoS): When the Trend Announces Itself“Structure is the language of the market. Learn it, and price speaks to you.”
Every trader looks at charts hoping for clues — and structure is the clearest one.
A Break of Structure (BoS) is a simple but powerful concept: it shows when the market confirms a continuation of the trend.
What is BoS?
When price breaks a previous high in an uptrend → confirms bullish continuation.
When price breaks a previous low in a downtrend → confirms bearish continuation.
BoS is different from ChoCH:
ChoCH signals potential reversal .
BoS signals trend continuation .
How to Spot BoS
Identify the key swing highs and lows.
Wait for price to decisively break them.
Confirm the break on the timeframe aligned with your bias (e.g., H4 for trend, M15 for setups).
Practical Tip
A BoS on M15 aligned with H4 bias is often where setups start forming.
Never assume a break is real without observing structure alignment and volume/confirmation.
Price doesn’t lie. Structure doesn’t cheat.
Once you see the break, the market has announced its intentions.
📘 Shared by @ChartIsMirror
If this resonated, comment below — which part of structure analysis should I break down next?

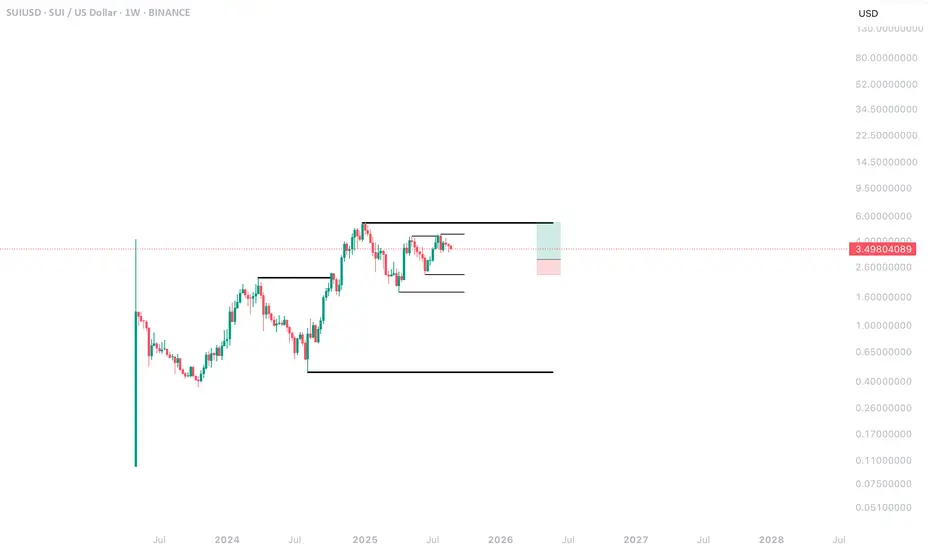
SUI Weekly AnalysisBeen following SUI for a while now and bullish formation still intact.
Being patient for the “right” trade.
What does the “right” trade look like?
I’m looking for price to enter or come close to the last higher low in the most recent fractal. You can see me tracing HH & HL within a higher timeframe to verify direction.
To be more specific, I’m looking to enter around the last sell (supply) on the 4HR/1HR. I should see either a BOS or no new lows being made inside my defined range.
An analogy I like to use is I must trade like Jerome Powell cuts rates. I need to first see evidence that the “economy” (price) is changing.
Risk management is rule #1. If it doesn’t fit, be patient. There will always be another opportunity. ALWAYS!!!
SOL - Buy it before it's too late!As simple as the chart looks, everything on it is clear with strong targets expected in a short time.
The blue line: a close above it means BOS (Break Of Structure), signaling continuation of the upward move.
🔸Notice: this is the third attempt to break it.
In trading, resistance that the price tests multiple times weakens over time, and when it finally breaks, it usually does so with a huge green candle.
The price has also broken the daily 0.618 Fibonacci level, crossed above the 25 EMA, and made a retest of it.
Your minimum target from here is $400.
It’s a beautiful chart, strong project, and a leading coin in the market with big targets ahead… all that’s left is for you to buy it.
Best Regards:
Ceciliones🎯

Break of Structure VS Liquidity Grab. How to Identify Valid BoS
The main problem with break of structure trading is that you can easily confuse that with a liquidity grab.
But don't worry.
There is a secret SMC price model that will help you to confirm a break of structure in a second.
Learn smart money concepts trading secrets and a simple strategy to trade break of structure on any forex pair.
Let's study a break of structure that I spotted on AUDUSD forex pair.
We see that the market is bullish on a daily time frame and the price has just violated a previous high with a break of structure.
The issue with that is the fact that such a violation can easily be a liquidity grab and a bullish trap .
Buying the market immediately after a BoS, we can incur a huge loss .
We need something that would help us to accurate validate that.
Fortunately, there is a simple price model in SMC that will help.
After you spotted a break of structure on a daily time frame,
use a 4h time frame for its validation.
After a BoS on a daily time frame, the market usually starts retracing , setting a new local high.
To confirm that it is not a trap, you will need a break of THAT structure on a 4H time frame.
It will increase the probabilities that the entire bullish movement that you see on a daily is not a manipulation.
Here is what exactly we need.
After the price violated a daily structure and closed above that, we see a minor intraday retracement on a 4h time frame.
A bullish violation of the last high there is our BoS confirmation and a clear indicator of the strength of the buyers.
You can execute a buy trade, following a simple strategy then.
Set a buy limit order on a retest of a broken high on a 4H,
a stop loss should be below the last higher low,
a take profit is based on the next supply zone on a daily.
To avoid the traps, a single time frame is not enough for profitable trading break of structure.
Learn to integrate multiple time frames in smart money concepts trading. It will help you make thousands of pips weekly.
❤️Please, support my work with like, thank you!❤️
I am part of Trade Nation's Influencer program and receive a monthly fee for using their TradingView charts in my analysis.

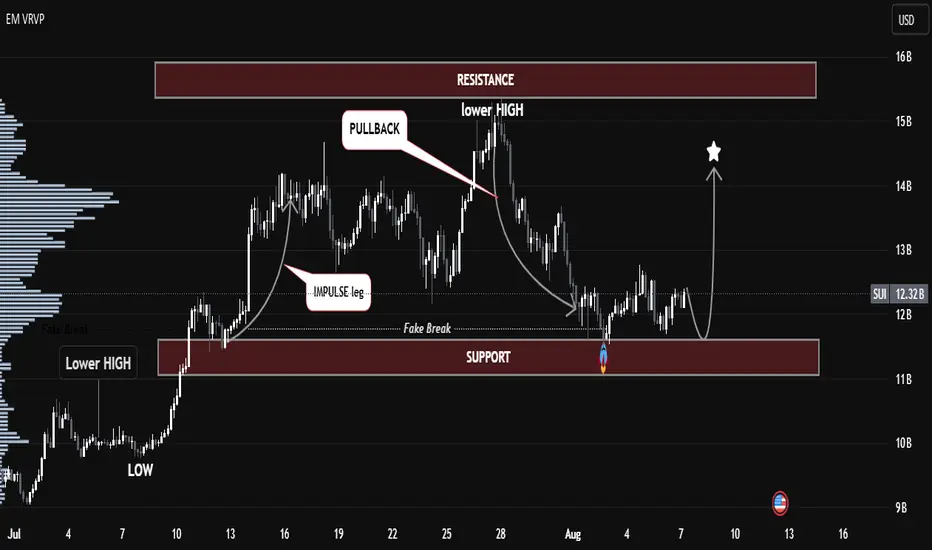
SUI/USDT – Smart Money Accumulation at Key Demand Zone📊 SUI/USDT – Smart Money Accumulation at Key Demand Zone | Bullish Outlook Ahead 🚀
The current SUI/USDT structure highlights a textbook Smart Money accumulation phase playing out at a key support zone, following a clear impulse–pullback–lower high formation.
🔍 Key Technical Insights:
🔻 Lower Highs Formation: A strong bearish structure led price back into the previous demand zone, sweeping liquidity below the support.
🎭 Fake Break Identified: Price action broke below the support briefly, indicating a liquidity grab (stop-hunt), often a precursor to bullish reversals.
🌀 Volume Node Alignment: Strong volume interest is building at the current support area, adding confluence for potential accumulation.
⚡ Projection Path: If the demand holds, expect a potential bullish reversal, targeting the previous resistance zone between 14–15B.
🧠 SMC Concepts in Play:
Fake Breakout = Liquidity Sweep
Impulse Leg = Institutional Activity
Pullback = Re-Entry for Smart Money
📈 Bullish Scenario:
Watch for confirmation around the support zone (~11B). A higher low or bullish engulfing pattern could trigger a rally toward 14B–15B resistance.
🛑 Bearish Invalidator:
A clean break and close below the 11B zone would invalidate the current bullish thesis.
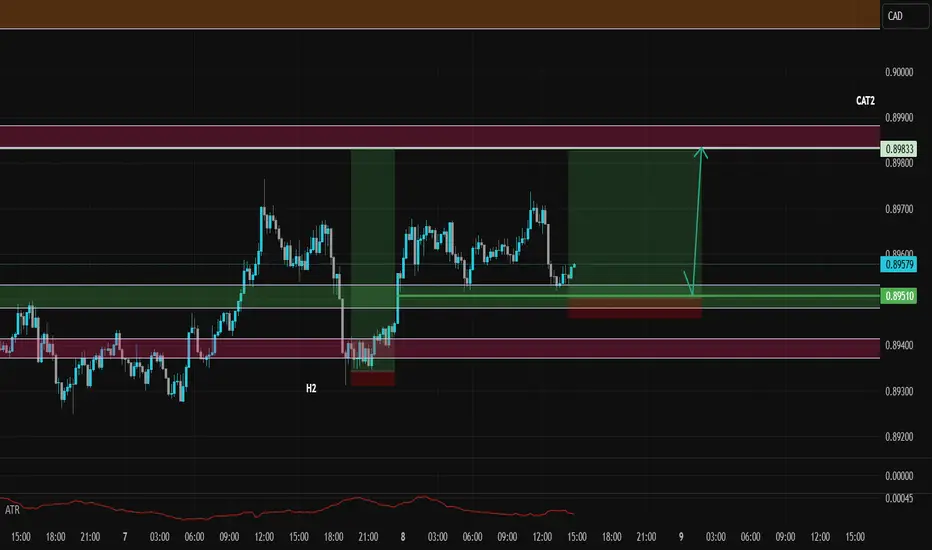
Sniper Entry on AUDCAD - SMC Concepts - Trade Code RevealedAlright snipers, here it is!
From today onwards, I will publish my live trades. My A+ setups.
In this one, I follow the H2 game ( Bullish) as there is no other game played at the moment on this pair contradicting my story.
Story says, H8 bullish, H2 bullish, BOS confirmed. Now market is mitigating towards an imbalance left behind and visible on m15/m8.
I am expecting this last point of true mitigation to be reached, inducing the last swing buyers who believe the market has to go up.
Also a very important info: market will break through the low of Asia and low of Europe sessions before taking off (0.89519)
No sign of reversal move either, H8 candles are closing above the H8 S/R. No sign of H2 or m30 reversal candlestick pattern (Rejection + Acceleration or Supply Zone). So we're good to go.
Enjoy this trade! See you on the one...
GBPUSD Technical Breakdown – High-Probability Rejection Play📉 GBPUSD Technical Breakdown – High-Probability Rejection Play
🔥 Clean Structure | Strong Confluences | Smart Money Insight
This GBPUSD setup is a textbook example of price action meeting institutional behavior.
🧠 Key Observations:
• Break of Structure (BOS) identified multiple times confirming clear trend shifts.
• Price tapped into a well-defined resistance zone and showed an aggressive rejection, validating seller presence.
• Liquidity grab from the highs led to an immediate drop, marking the start of bearish momentum.
🎯 Target Zones:
• First TP: 1.33009
• Second TP: 1.32375
• Final Target: 1.31443 (aligned with major support zone and BOS retest)
🛡 Why This Setup Matters:
• Strong rejection from premium zone
• BOS confirms direction
• Volume and structure align for high RR potential
• Clean imbalance fill expectations
✅ Plan:
Sell from rejection zone with SL above the wick high. Trail stops as price approaches each target.

XAUUSD Bearish SMC Analysis – Institutional RejectionXAUUSD Bearish SMC Analysis – Institutional Rejection from Supply Zone
Gold (XAUUSD) is showing a clear bearish structure after rejecting a major supply zone at premium pricing. This setup is aligned with Smart Money Concepts (SMC) and reflects how institutions manipulate liquidity and order flow before major price moves.
🔍 Market Structure Context:
The market had been trending upward with higher highs and higher lows, until it approached a key premium supply zone near $3,420.
At this level, price stalled, creating internal Equal Highs (liquidity) — a common trap used by institutions to grab orders before reversing.
🔄 Change of Character (CHoCH):
A clear CHoCH was printed when price broke below the most recent higher low, signaling a shift from bullish to bearish structure.
This change marked the first early signal that institutional order flow has flipped bearish, and distribution is underway.
📉 Break of Structure (BOS):
Following the CHoCH, the market confirmed intent with a clean BOS to the downside.
This structural break confirms bearish control and validates short bias.
🧲 Liquidity Engineering:
Equal Highs were swept at the top, indicating a liquidity grab before institutions drove price downward.
This move traps breakout buyers and provides large players with sell-side execution at premium pricing.
🧱 Fair Value Gap (FVG) & Supply Zone Mitigation:
After BOS, price retraced into a Bearish Fair Value Gap (FVG) and the origin of the supply zone, offering a high-probability entry.
The rejection from this zone showed imbalance was respected and no bullish continuation existed — further validating the short setup.
🔍 Confluences for the Bearish Bias:
Confluence Confirmation
CHoCH Structure flipped bearish
BOS Bearish continuation confirmed
Liquidity Sweep Equal highs taken
FVG Retest Smart Money re-entry signal
Supply Zone Mitigation Institutional reaction confirmed
📘 Educational Summary:
This setup exemplifies a complete Smart Money bearish reversal model:
Premium pricing ✅
Liquidity taken ✅
Structure flipped (CHoCH + BOS) ✅
Supply & FVG respected ✅
It reflects how institutions build positions quietly, using engineered liquidity to trap retail traders, and then drive price with high-volume imbalance moves.

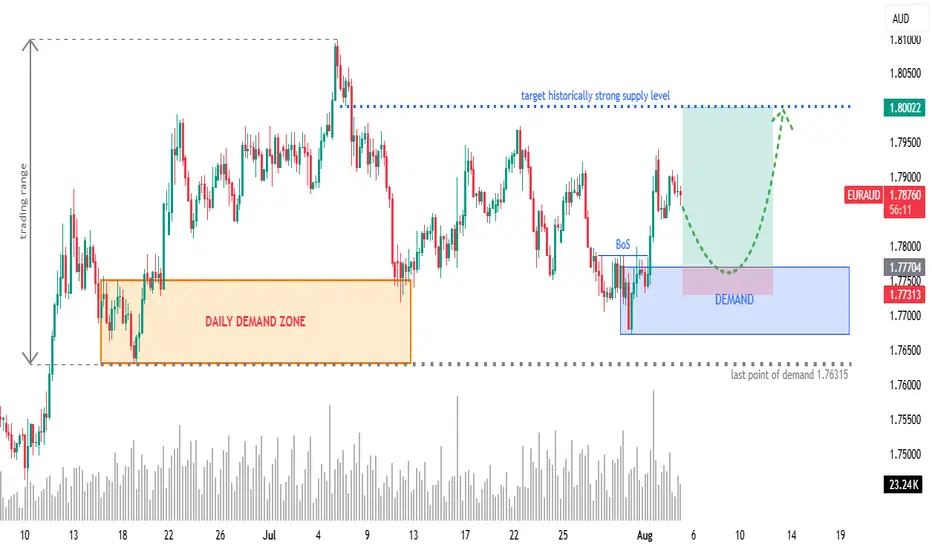
EURAUD 4H: Long Setup from Fresh Demand ZoneOverview:
OANDA:EURAUD retracing into a newly formed 4H demand zone after a bullish Break of Structure (BoS). Eyes on continuation towards a historically significant supply zone at 1.8000.
🧩 Setup Details
• Asset & Timeframe: EURAUD, 4H
• Bias: Bullish
• Entry Zone: 1.77300 – 1.77700 (DEMAND area)
• Targets:
🎯 T1 = 1.7900 (minor reaction level)
🎯 T2 = 1.8000 (historical supply level)
• Stop-Loss: Below 1.77300 (last valid demand)
• Risk-Reward: Approx. 1:6+
🧠 Why Now? (Trade Rationale)
• ✅ Fresh 4H Demand Zone: Price is retracing into a clear demand zone after rejecting lower prices.
• ✅ Break of Structure (BoS): Bullish BoS confirms shift in order flow.
• ✅ Volume Confirmation: Increasing demand near current price levels.
• ✅ Clear Liquidity Sweep: Price likely swept short-term lows before BoS.
• ✅ Target Supply Zone: 1.8000 is a well-respected historical supply/resistance level — clean magnet for price.
⏱ Multi-Timeframe Context
• Daily Chart: Price is reacting off a larger DAILY DEMAND ZONE. Trend bias is bullish.
• 4H Chart: Structure break + demand formation suggest continuation.
• 1H/Entry Level: Monitor price action in the blue zone for lower-timeframe confirmation (e.g. bullish engulfing, flip zones, LQ sweep, etc.) and potentially greater risk-reward.
📉 Risk Management & Duration
• Stop below 1.76315 keeps you protected from deeper invalidation.
• Trade Duration: Short to mid-term (1–4 days).
• Position Size: Scale based on volatility; ideal for swing trade conditions.
📌 Trade Plan Summary
📍 Watch for bullish PA on re-entry into demand (1.77300–1.77700)
📍 Set SL below 1.76315
📍 TP1 at 1.79000 — partials advised
📍 TP2 at 1.80000 — strong historical level
📍 Adjust SL to BE on momentum breakout
Trend Exhaustion Detected – Bearish Structure AheadUS100 (NASDAQ) 30-minute chart as of July 26, 2025, with technical insights based on the visible elements.
🔍 1. Trend Analysis
Primary Trend: Uptrend (bullish structure)
The price has been respecting a rising parallel channel, marked by:
Ascending support (lower boundary)
Ascending resistance (upper boundary)
Market structure shows:
Higher Highs (HH)
Higher Lows (HL)
✅ This indicates continuation of bullish momentum until structure breaks.
📐 2. Market Structure Elements
Structure Type Label on Chart Price Zone (approx.)
Break of Structure (BOS) BOS (center-left) ~22,950
Higher Low (HL) HL (2x) ~22,700 (1st), ~23,050 (2nd)
Higher High (HH) HH (2x) ~23,150 and ~23,300
Resistance Labelled ~23,300–23,320
Demand Zones Labelled ~22,450–22,700
🔁 Break of Structure (BOS)
The BOS occurred after a prior swing low was broken, followed by a new higher high, confirming a bullish shift.
🧱 3. Support / Resistance Analysis
🔼 Resistance Zone
The price is testing strong resistance around 23,300–23,320
Multiple rejections in this area
Trendline resistance also aligns here
A rejection arrow is drawn, indicating potential bearish reaction
🔽 Support Zone (Immediate)
23,180–23,220: highlighted green box is a local support block
If broken, likely to revisit 23,000–23,050, or even down to 22,900 range
🟩 4. Demand Zones
Zone 1:
22,450–22,600: Strong bullish reaction historically — likely to act as a key demand if a deeper pullback occurs
Zone 2:
22,850–22,950: Validated with prior accumulation & BOS event
🧠 5. Key Observations
Price is at a critical inflection zone:
Testing a resistance zone
At the upper trendline of an ascending channel
A bearish reaction is projected (black arrow)
Possibly targeting the green support zone around 23,180–23,220
If that fails, demand at ~23,000 will likely be tested
Ichimoku Cloud:
Currently price is above the cloud → still bullish
Cloud is thin → potential weakness or upcoming consolidation
⚠️ 6. Trading Bias & Setup Ideas
✅ Bullish Bias (if price holds above ~23,180)
Long entries can be considered on bullish reaction from support
Target: retest of 23,300–23,350 or even breakout continuation
❌ Bearish Bias (if breakdown below support)
Short entry valid below 23,180 with:
TP1: 23,050
TP2: 22,900
A breakdown from the ascending channel would signal trend exhaustion
🔚 Conclusion
Current Price: 23,298.4
Trend: Bullish, but at resistance
Next move: Watch for reaction at resistance and support box below
Bias: Neutral-to-bullish unless the structure breaks below ~23,180

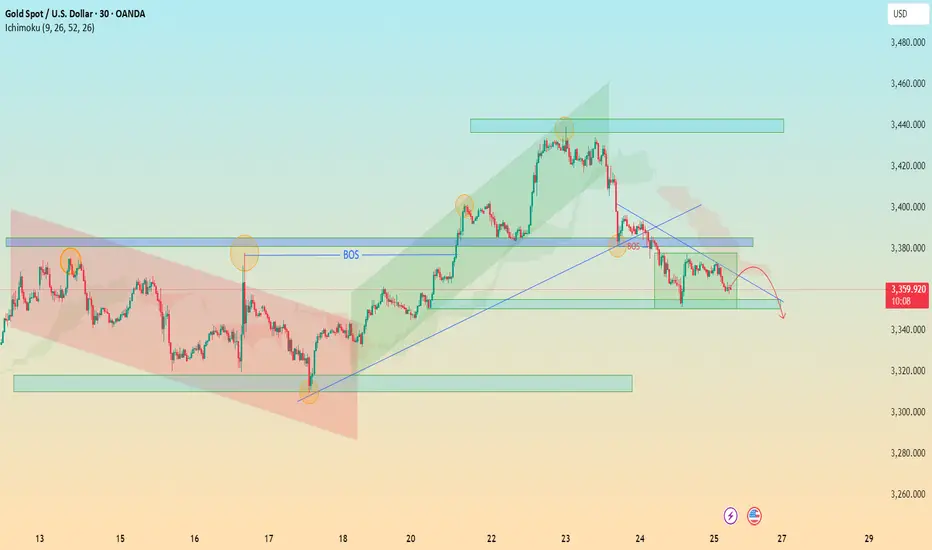
XAUUSD: Demand Rejection or Breakdown? All Eyes on 3,300 ZoneChart Analysis Breakdown (30m TF – Gold/USD)
1. Market Structure Overview
Bearish Trend Dominance:
The price has shifted into a bearish structure after a Break of Structure (BOS) to the downside, indicating bearish control after failing to sustain higher highs.
Lower Highs & Lower Lows:
A consistent formation of LHs and LLs confirms bearish momentum.
2. Key Zones & Reactions
🟩 Demand Zone (~3,300–3,310):
Current price is reacting from a clearly defined demand zone.
Strong buying wick indicates interest and potential short-term bounce.
This zone has historical significance — previous reversal point.
🟥 Supply Zone (~3,420–3,445):
Price reversed sharply from here.
This is a key liquidity zone; expect heavy resistance if price retraces.
🔵 BOS Areas Marked:
Confirmed transitions in structure:
Bullish BOS followed by a bearish BOS — great illustration of shift in control.
🟨 Consolidation Blocks:
Highlighted ranging periods show distribution/accumulation phases before breakouts.
3. Trendlines & Channel Patterns
📉 Descending Trendline:
Acts as dynamic resistance.
If price retraces to this level (around 3,330–3,340), expect potential rejection unless broken cleanly.
📈 Previous Bullish Channel (Broken):
Price moved out of a bullish ascending channel, confirming bearish intent.
4. Ichimoku Cloud Context
Price is below the Kumo cloud, suggesting bearish bias remains intact.
Future cloud is bearish.
However, short-term pullback into cloud possible (especially if demand zone holds).
📊 Forecast & Trade Idea
Scenario 1: Bullish Rejection from Demand
Price may bounce towards 3,340 (previous S/R + trendline retest).
Watch for reaction at this level.
Scenario 2: Clean Break of Demand Zone
Opens path toward deeper downside (e.g., 3,280 or even lower).
Could trigger liquidity grab before reversal.

"XAU/USD Hits Major Demand – Is a Relief Rally Brewing?"🟡 XAU/USD (Gold) – Demand Zone Rejection in Play | Bullish Correction Ahead?
Timeframe: 30-Minute | Date: July 25, 2025
Created by: AllyPipsExpert
Indicators: Ichimoku Cloud, BOS (Break of Structure), Dynamic S/R, Trendlines
---
🔍 Technical Analysis & Key Insights:
🔸 1. Market Recap – Distribution & Downtrend Confirmation:
After the Break of Structure (BOS) near 3385, gold confirmed a bearish reversal following the distribution phase at the top resistance zone around 3445–3460.
Bearish momentum was sustained by a descending trendline, paired with a bearish Kumo (Ichimoku cloud) crossover.
🔸 2. Major Zone Tagged – Key Demand Area Tested:
Price has now reached the critical demand block at 3320–3340, a zone that previously initiated bullish impulse on July 18–19.
The current bullish projection (in blue) reflects potential short-term recovery or correction phase, following oversold conditions and historical support strength.
🔸 3. Bullish Reversal Potential – Short-Term Retracement?
The blue arrow reflects a likely bullish retracement toward 3360–3380, aligning with trendline retest and potential Kumo rejection.
Expect sellers to re-enter if price retests former BOS/imbalance zone, creating scalp or swing sell setups on confirmation.
---
🔧 Confluences & Technical Highlights:
Confluence Point Description
Demand Zone Strong previous accumulation at 3320–3340
BOS Retest Area Key liquidity level now acting as resistance
Ichimoku Cloud Price below cloud = bearish bias maintained
Descending Trendline Reinforces bearish structure unless broken
Price Action Rejection wick at demand + potential short squeeze
---
🎯 Trade Outlook:
🧭 Bias: Short-Term Bullish Rebound → Long-Term Bearish Continuation
🟩 Support: 3320 – 3340
🟥 Resistance: 3360 – 3385 (BOS & Trendline zone)
🔁 Scenario: Bounce → Retest → Continuation lower (unless breakout confirmed)
---
📘 Why This Chart Could Be Featured:
✅ Multi-layered Analysis: BOS, zones, cloud, price action, and psychological zones used together.
✅ Forward-Looking: Projects the next logical market reaction instead of just explaining the past.
✅ Clean, Structured, Educational: Layout and visuals guide the viewer through logical trade steps.
✅ Value-Packed: Provides actionable levels and flexible scenarios — helpful to traders of all levels.

XAU/USD Bearish Retest in Motion – Watch 3340 for Breakout 🔍 XAU/USD (Gold) – Bearish Reversal Outlook
Timeframe: 30-Minute
Date: July 25, 2025
Indicators Used: Ichimoku Cloud, BOS (Break of Structure), Trendlines, Support & Resistance Zones
---
⚙ Technical Breakdown:
1. Previous Market Structure – Accumulation to Expansion:
Descending Channel (Red Box): Market moved within a bearish channel until the breakout occurred.
Key Break of Structure (BOS) around 3365 level signaled the beginning of bullish momentum — a textbook shift from accumulation to expansion phase.
Rally towards 3445 zone: Strong impulsive wave followed by higher highs and higher lows within a green rising channel.
2. Bull Trap and Structural Breakdown:
At the 3445-3460 resistance zone, price failed to maintain momentum and formed a double top / distribution setup.
The second BOS near 3385 confirmed a shift from bullish to bearish market structure.
Ichimoku Cloud also flipped bearish — price is now trading below the cloud, signaling potential continued downside.
3. Current Consolidation and Bearish Retest:
Price is now trapped in a bearish flag / rectangle pattern between 3360 – 3380.
Recent rejections from the descending trendline and overhead supply zone indicate weak bullish attempts and presence of strong selling pressure.
4. Anticipated Move – Bearish Continuation:
The projected red path suggests a retest of the diagonal resistance, followed by a breakdown toward key demand zone at 3340 – 3320.
If that zone fails, we may see a deeper move toward 3280.
---
📌 Key Technical Zones:
Zone Type Price Level (Approx.) Description
Resistance 3445 – 3460 Double Top / Strong Supply
Support 3340 – 3320 Historical Demand Zone
Short-term Resistance 3375 – 3385 BOS Retest + Trendline
---
🎯 Trading Insight:
📉 Bias: Bearish
⚠ Invalidation Level: Break above 3385 with volume
📊 Potential Target: 3340 → 3320
🧠 Trade Idea: Look for short entries on weak retests near descending trendline or cloud rejection.
---
🏆 What Makes This Chart Unique for Editors’ Picks:
✅ Multiple Confluences: Structural shifts (BOS), trendlines, Ichimoku, and classic patterns (channels, flags).
✅ Clear Visual Storytelling: Logical flow from bearish to bullish and back to bearish structure.
✅ Forward Projection: Predictive outlook based on strong technical context — not just reactive analysis.
✅ Educational Value: Useful for beginners and intermediate traders alike to understand structure transitions and key levels.