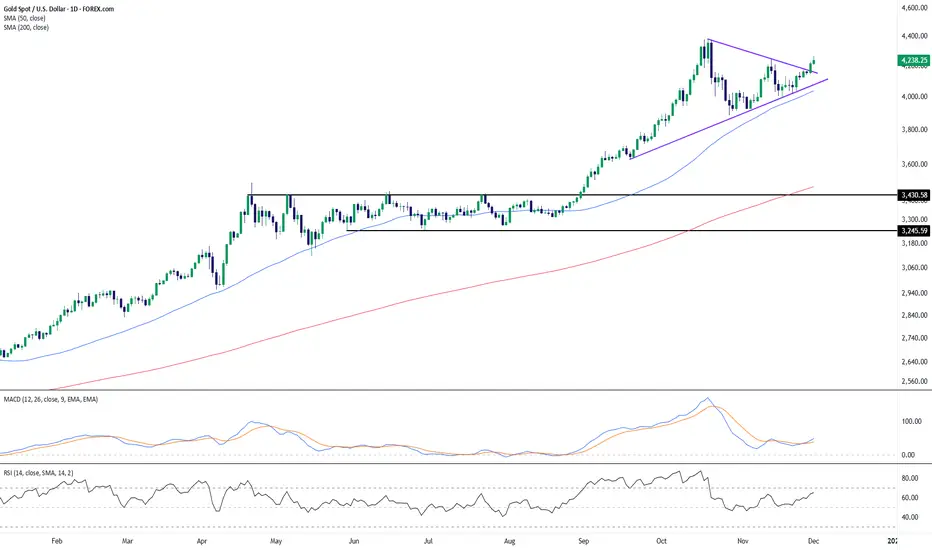
Gold Breaks Out of Triangle Structure as Trend Strength Remains Gold has pushed through the upper boundary of a contracting triangle formation, marking a continuation of the broader uptrend that has been intact since early in the year. The breakout follows several weeks of compression, with progressively higher lows aligning along a rising trendline, while buyers repeatedly tested the upper diagonal boundary.
The moving averages reinforce the constructive bias: price continues to trade well above both the 50-day SMA and the 200-day SMA, with the 50-day maintaining a strong upward slope. This places the current move firmly within a longer-term bullish structure, and the recent expansion in distance from the 50-day SMA highlights renewed upward momentum following the consolidation phase.
Momentum indicators are also showing early signs of improvement. The MACD lines have begun curling higher after a period of easing, suggesting that downside momentum has faded. RSI has climbed back into the mid-60s, reflecting strengthening buying interest without yet indicating overstretched conditions.
Overall, the breakout from the triangle aligns with the prevailing uptrend and indicates a return of bullish pressure. As always, how price behaves on any retest of the breakout area—or near the rising trendline—may provide additional insight into the durability of this momentum shift.
-MW
Breakout!
Welcome to BEAR SEASONAs the timeline clearly indicates, we've entered bear season. Good luck to everyone. I've opened my Short, lit a cigarette, and sipped my cappuccino, watching with pleasure as the stoves go out.

EURUSD Long: Channel Support Intact, Path Open Toward 1.1625Hello, traders! EURUSD is trading within a developing ascending channel, where price action continues to respect both the higher lows and the upper boundary of the structure. This upward movement formed after buyers defended the Demand Zone around 1.1550, which acted as a strong pivot area and triggered a bullish reversal via a clear inverse Head and Shoulders pattern. This pattern gave buyers the momentum needed to break back above the mid-range structure.
Currently, after reclaiming this level, EURUSD made a steady climb inside the ascending channel. However, price is now approaching the 1.16250 Supply Zone, which has previously acted as a strong reaction area where multiple breakouts and fake breakouts occurred. This remains the key short-term barrier that buyers need to overcome for further upward continuation.
My scenario: if buyers maintain structure above the Demand Zone at 1.15900 and hold the ascending channel’s support, EURUSD may continue pushing toward the 1.16250 level. This zone, aligned with the channel’s upper boundary, is the main target for the current bullish leg. A clean breakout above this resistance could open the door for a stronger bullish extension. However, if price reaches the Supply Zone and shows weakness or rejection, a corrective pullback toward the channel’s lower boundary is possible while still preserving the bullish structure. As long as EURUSD holds above the Demand Zone and respects the channel, the bullish scenario remains valid. Manage your risk!

XAUUSD Short: Rejection Pattern Points Toward 4,110 SupportHello, traders! XAUUSD continues to move within a broader ascending channel, where the price is forming higher pivot points along the Demand Line while consistently reacting to the descending Supply Line above. This structure indicates ongoing compression between buyers and sellers. Recently, Gold approached the upper Supply Line, where the price once again failed to break through, forming another lower high. This confirms that sellers are still defending the supply zone around $4,190–$4,200, keeping upward momentum limited. Before that, the price made several breakout attempts above the mid-range resistance, but many of them turned into fake breakouts, indicating liquidity grabs. Each rejection pushed Gold back toward the Demand Line, where buyers repeatedly created strong pivot points and revived the bullish momentum.
Currently, XAUUSD is trading close to the resistance area, and the chart suggests a potential pullback. If sellers maintain their pressure, the price may decline toward the $4,110 demand level, which aligns with both historical support and the upward Demand Line.
My scenario, if the price respects the Supply Line and fails to break higher, a bearish correction toward the $4,110 support zone becomes likely. However, if buyers manage to break above the descending Supply Line with strong momentum, the bearish idea becomes invalid, and Gold may continue its bullish expansion. Manage your risk!

Walmart Stays Strong, Ready for the Next LeapWalmart is proving once again why it remains one of the strongest companies in the world. Even as many retailers struggle, Walmart continues to grow, innovate, and win the confidence of investors.
Its stock is already up 22% this year, beating the S&P 500, and many signs show that the company could stay strong in 2026 as well.
◉ Why Walmart Is Winning
Walmart has become a perfect mix of traditional retail and modern technology.
Strong results:
● Revenue up 5.8% year over year
● Operating income up 8%
● EPS rising from $0.58 to $0.62
Market share growth:
Walmart gained more customers in grocery and general merchandise. Even higher-income shoppers have been spending more at Walmart.
E-commerce strength:
Online sales grew 27% as Walmart expands its online offerings and reaches customers beyond its stores.
Growing advertising business:
Walmart’s ad sales increased 53% in the latest quarter, turning it into a serious player in retail advertising.
◉ Technology Is Shaping Walmart’s Future
Walmart is investing heavily in technology to stay ahead:
● Partnering with OpenAI to let customers use ChatGPT for shopping and checkout
● Training developers to code faster with AI
● Automating supply chains and warehouses
● Buying Vizio to strengthen its advertising ecosystem
These changes are helping Walmart protect its low-price model while moving closer to becoming a tech-driven retailer.
◉ Leadership and Listing Changes
Two important updates were recently announced:
● CEO Doug McMillon is stepping down after ten years
● John Furner, head of Walmart U.S., will become the new CEO
Walmart also announced that it will move its stock listing from the New York Stock Exchange to the Nasdaq. This connects Walmart more closely with tech-focused indexes and funds.
◉ Dividend Stability
Walmart is a Dividend King, raising its dividend every year for more than 50 years. This adds strong stability for long-term investors.
◉ Technical Outlook
● From a technical point of view, the stock recently broke out of an ascending triangle pattern and touched a new all-time high.
● If this momentum continues, Walmart could see another strong rally in 2026.
◉ Final Thoughts
Walmart is winning today and building an even stronger position for the future. With solid financials, strong e-commerce growth, expanding advertising revenue, and steady leadership changes, the company is well-placed for 2026 and beyond.

BTCUSD: Channel Momentum Points Toward $93,700 TargetHello everyone, here is my breakdown of the current Bitcoin setup.
Market Analysis
BTCUSD has shifted from a prolonged bearish phase into a clear bullish recovery after breaking out of the major downward channel. The price confirmed the end of the bearish structure once it broke above the descending trendline and reclaimed the Support Zone around $89,800–$90,200, which previously acted as a strong demand area during the selloff. After the breakout, Bitcoin established a new upward channel, forming higher highs and higher lows, indicating that buyers are currently in control. The price is now moving steadily along the channel's Support Line, respecting its structure and maintaining bullish momentum. Recent price action also includes several breakout confirmations, showing that buyers successfully defended the Support Zone and turned it into a base for further growth.
Currently, BTCUSD is approaching the $93,000–$93,700 Resistance Zone, which remains the main obstacle for buyers. This level acted as strong resistance earlier and aligns with the mid-upper region of the ascending channel, making it a key reaction area where sellers may attempt to slow down the bullish trend.
My Scenario & Strategy
My scenario remains bullish as long as Bitcoin stays above the $90,200 support zone and continues to trade within the upward channel. The structure suggests that buyers may attempt another push toward the $93,700 resistance, where the next major reaction is expected.
Therefore, a clean breakout above $93,700 would confirm further bullish continuation and open the path toward higher targets, potentially extending the uptrend to the upper channel boundary. However, if BTC reaches the resistance and shows signs of rejection or weakening momentum, we may see a pullback toward the channel’s Support Line — yet the broader bullish structure will remain valid as long as the zone around $90,200 holds. For now, the market supports a long bias, with the primary objective being a retest of the $93,700 resistance zone, which stands as the key level buyers are aiming for.
That’s the setup I’m tracking. Thank you for your attention, and always manage your risk.

EURUSD: Sellers Target Move Toward 1.15200 SupportHello everyone, here is my breakdown of the current EURUSD setup.
Market Analysis
EURUSD continues to trade within a corrective market structure after a strong bullish impulse that formed an Upward Channel earlier in the month. Once price broke below that channel, the pair shifted into a broader consolidation, forming a descending Triangle pattern defined by a Triangle Resistance Line above and a Triangle Support Line below. After dropping from the 1.16000 Resistance Zone, the market produced a clear fake breakout above this level, signaling strong seller presence. This rejection aligned with the Triangle Resistance Line, confirming it as a firm boundary preventing further upside. On the downside, EURUSD also created a fake breakout at the Triangle Support Line, showing that buyers remain active around the 1.15200 Support Zone.
Currently, price is trading in the middle of this triangle structure, moving away from resistance and showing early signs of bearish momentum building toward the lower boundary. The broader picture reflects a balanced but weakening market, where sellers still hold the advantage as long as price remains under the 1.16000 Resistance.
My Scenario & Strategy
My scenario is bearish, based on the repeated rejections from the 1.16000 Resistance and the overall pressure along the Triangle Resistance Line. As long as EURUSD stays below this key zone, the probability favors further downside movement inside the triangle. My expectation is for price to make another minor pullback toward the 1.15850–1.15900 area, where short-term liquidity may form, before resuming the decline toward the 1.15200 Support Zone. This level aligns with the Triangle Support Line and represents the main downside target for the current move.
Therefore, a clean breakout below 1.15200 would signal stronger bearish continuation and open the path for deeper declines. However, if price rejects the support again and forms higher lows, we may see another corrective bounce back into the triangle — but the bearish bias holds as long as the 1.16000 Resistance remains intact. For now, the market supports a short scenario with a focus on a move toward the 1.15200 support area.
That's the setup I'm tracking. Thank you for your attention, and always manage your risk.

BTC Buyers Hold Control — Targeting $95,700 Resistance RetestHello traders! Here’s my technical outlook on BTC/USD based on the current market structure. After breaking out of the Buyer Zone near $86,400–$88,000, the price entered a sustained upward channel, forming higher highs and higher lows along the Support Line. However, BTC recently approached the Resistance Line inside the channel and showed signs of exhaustion, indicating that buyers are losing momentum as the price nears the local Seller Zone around $94,000–$95,700. The chart currently shows the market trading within a rising corrective structure, with bulls trying to hold the Support Line to maintain the short-term uptrend. As long as the price stays above the Buyer Zone and respects the channel’s Support Line, the bullish scenario remains valid. The structure suggests a potential pullback from Resistance toward the mid-channel area before buyers attempt another move upward. A continuation of this trend may push BTC/USD toward the TP1 target at $95,700, where the previous rejection occurred. A clean breakout above this level would open the door for stronger bullish expansion. However, a breakdown below the Support Line or a drop back into the Buyer Zone could weaken the trend and expose the price to deeper declines. Please share this idea with your friends and click Boost 🚀

NZD/USD Building Bullish Structure From DemandDespite recent corrective moves, NZD/USD is developing a strong bullish foundation as price continues to respect the major demand zone at the bottom of the chart. Each rejection from this zone shows clear evidence of institutional buying, with long wicks and aggressive recoveries indicating that sellers are losing power.
The rounded-top and earlier distribution worked mainly as a liquidity sweep, pulling price back into areas where large buyers were waiting. Now, price is forming a higher-low structure, suggesting accumulation rather than continuation of the downtrend. The presence of the Fair Value Gap (FVG 4H) below acts as a completed rebalancing area, giving room for a clean bullish expansion.
If price maintains stability above the buyer zone (0.5690–0.5700), we can expect a progressive move toward the mid-range resistance at 0.5740, and eventually a push back into the upper supply zone around 0.5800, which becomes the primary bullish target. Fresh liquidity is building above recent highs, providing the fuel needed for an upside continuation.
Overall, the market shows signs of accumulation, higher lows, and smart-money support, favoring a bullish continuation as long as price remains above the major demand zone.

EURUSD Retracement Before Bullish ContinuationQuick Summary
Although the overall outlook remains bullish, the EURUSD may go down first to collect liquidity below the Tokyo Low. This zone aligns with equal lows and a clean order block after, making 1.15855 a strong area for a continuation buy if a clear rejection or choch forms.
Full Analysis
The bullish structure on the EURUSD is still intact, but before continuing upward, the pair may need to sweep the liquidity sitting beneath the Tokyo Low, The area below the Tokyo Low also aligns with equal lows, which naturally attract liquidity and making this zone even more likely to be tested
The level around 1.15855 stands out as a probable point for bullish continuation once liquidity has been taken. However, entering directly at the level is not ideal. It is safer and more effective to wait for a clear sign of reaction such as a strong rejection or a confirmed choch on a lower timeframe. These signals help validate that the market is ready to shift from sweep to expansion upward.

USD/JPY — Poised for Bullish Reversal at Key Demand ZoneUSD/JPY is currently testing a major demand zone, a level where price has historically found strong buying interest. This area has acted as a structural support multiple times, making it a high-probability zone for a bullish reversal.
The recent price action shows slowing downside momentum, with smaller candles and wicks rejecting lower levels — signaling that buyers are stepping in. If the market holds this zone, we could see:
A bullish engulfing candle or pin-bar formation confirming rejection.
A strong upward impulsive move targeting previous swing highs.
Increased buying momentum as traders enter at a low-risk point.
For traders looking to go long, this setup allows for strategic entry near the support zone, with a stop-loss just below the demand area to manage risk. The upside potential aligns with prior highs, making it an attractive risk-to-reward opportunity.
Key Point: Wait for confirmation via a bullish candlestick pattern or a retest of the zone before entering to maximize probability of success.

RANGE BREAKOUT WITH RETEST & DOWNSIDE CONTINUATION SETUPRANGE BREAKOUT WITH RETEST & DOWNSIDE CONTINUATION SETUP
The EUR/GBP chart displays a well-defined market structure transition from accumulation ranges into a broader bearish cycle. Initially, the price moved through multiple tight ranges, indicating accumulation and liquidity building on both sides. Each breakout from these ranges created short-term bullish impulses, but the upward momentum consistently weakened as price approached the strong supply zone.
Once price tapped the major supply zone, selling pressure increased sharply, marking the start of a clean descending channel (seller zone). This channel represents controlled distribution by sellers, which pushed the market back below the previous mid-range support.
The most important structural event is the bearish breakout from the central range support. After the breakout, price returned for a textbook retest, where previous support flipped into resistance — a classic confirmation of bearish continuation.
The market is now positioned between key liquidity levels, and unless the retest zone is reclaimed, probability favors a continuation move towards the next support level. If this level breaks, further decline toward the lower support base becomes the next logical target.
Overall sentiment remains bearish, with sellers controlling the flow, and any long positions remain risky unless the market reclaims the broken support area and breaks structure to the upside.

AUDUSD STRONG BREAKOUT|LONG|
✅ AUDUSD is breaking structure as it trades out of the demand block, signalling a continuation toward the upside liquidity pocket. With momentum shifting, the pair aims to draw toward the next clean inefficiency above before reaction. Time Frame 4H.
LONG🚀
✅Like and subscribe to never miss a new idea!✅

Bitcoin Bullish Bitcoin will go long after breakout and retest with pin bar above 50 fib levels.
NOTE: This analysis involved technical analysis only no fundamental analysis involved.

XAUUSD Sell Opportunity at ResistanceFOREXCOM:XAUUSD is now pushing into a key resistance zone, an area that has acted as a strong barrier in the past and triggered notable sell-offs. This level also aligns with a previous supply zone, where sellers once stepped in aggressively, making it a prime spot for anyone looking for potential short opportunities. With its historical importance, the way price reacts here could shape the next major move.
If bearish signals appear such as rejection wicks, bearish candlestick patterns or signs of weakening buying pressure, I expect price to drop toward the 4,230 level. However, if price breaks cleanly above this resistance, the bearish outlook may no longer hold and it can open the door for further upside momentum. This is a crucial zone where price action is likely to reveal a clearer direction.
This is just my personal view on support and resistance zones, not financial advice. Always confirm your setups and manage your risk properly.
Good luck out there!

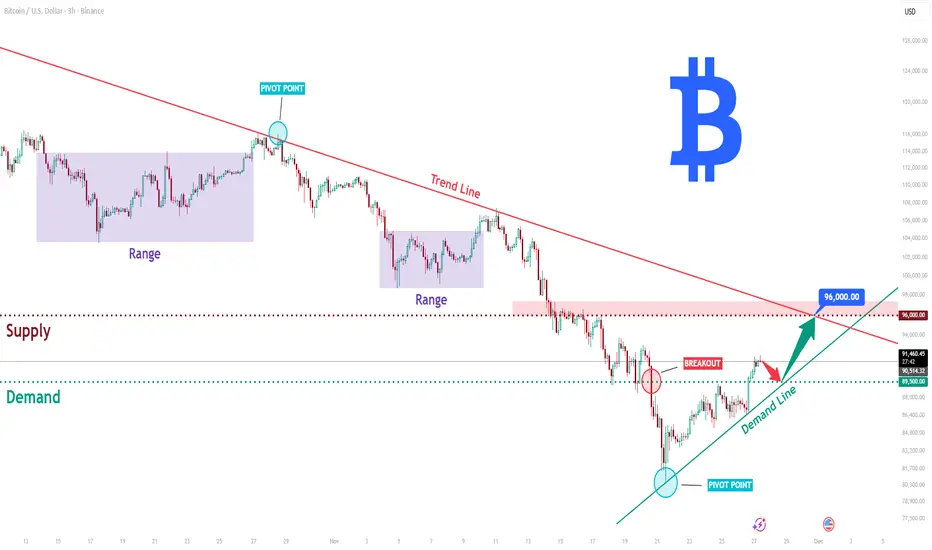
BTCUSD Long: Compression Near Trend Line, Possible Move to $96KHello, traders! BTCUSD continues to move within a broader descending structure, where the price has consistently respected the major downward trend line. Each approach to this trend line has resulted in a new lower high, confirming seller control in the medium-term outlook.
Currently, after the decline, Bitcoin tested the Demand Zone around $89,500, where buyers formed an important pivot point, triggering a noticeable upward impulse. This reaction confirmed strong demand and pushed the price toward the key compression area between the Demand Line and the main descending Trend Line.
My scenario, if buyers maintain pressure and break above the descending trend line, BTCUSD may extend its bullish correction toward the $96,000 supply zone. However, if the demand level fails to hold, this scenario becomes invalid, opening the path toward deeper support levels. Manage your risk!
XAUUSD: Channel Push Points to $4,220 as Next TargetHello everyone, here is my breakdown of the current Gold setup.
Market Analysis
Gold remains in a broader bullish structure, but the recent price action is developing inside a well-defined ascending channel, where price is currently moving from the lower boundary toward the upper one. After a sharp correction, XAUUSD found strong support at the $4,040 level, which aligns with the bottom of the channel and produced a fake breakout, signaling lack of bearish continuation.
Currently, price has started a new upward swing, respecting both the channel structure and the mid-line trend dynamics. However, despite the recovery, XAUUSD is still trading below the major $4,220 resistance, which previously acted as a strong reaction zone and remains the key obstacle for buyers.
My Scenario & Strategy
My scenario is bullish, as long as price stays above the support zone around $4,040 and maintains structure inside the ascending channel. I expect Gold to continue climbing toward the $4,220 resistance, where the upper channel boundary also converges, forming a strong confluence area.
Therefore, a clean breakout above $4,220 would open the way for higher targets and continuation of the broader trend. However, if price reaches this zone and shows strong rejection or weakness, we may see a pullback into the channel — but the bullish structure remains intact as long as the lower boundary holds. For now, the market supports a long bias, with the key objective being a retest of the $4,220 resistance zone, which is the next major level buyers are aiming for.
That's the setup I'm tracking. Thank you for your attention, and always manage your risk.

EURUSD Downside Outlook: Price Eyes Retest of 1.1540 Buyer ZoneHello traders! Here’s my technical outlook on EUR/USD based on the current market structure. After testing the Seller Zone near 1.16000–1.16200, the price once again faced rejection, forming a fake breakout around the descending Resistance Line. This confirms that sellers are still defending this area and keeping the pair inside a broader bearish structure. From there, EUR/USD pulled back toward the Buyer Zone, located between 1.15400–1.15000, which has acted as a reliable support area multiple times. The market is now moving inside a corrective pattern, showing weakening bullish momentum as it approaches support. As long as the pair trades below the Seller Zone and the descending trendline, bearish pressure remains dominant. The chart suggests a likely continuation toward the TP1 target at 1.15400, where buyers previously stepped in and produced notable recoveries. A clean bounce from this zone may trigger another short-term bullish correction — but without a breakout above 1.16000, any upside is likely to remain limited. A breakdown below 1.15400 could open the way for deeper declines toward lower support levels, while a confirmed breakout above the Seller Zone would shift short-term sentiment. Please share this idea with your friends and click Boost 🚀

EURUSD Bullish Setup After Corrective Drop Toward 1.15364Quick Summary
EURUSD may retrace lower toward 1.15364 on the H4 chart. This zone is expected to act as a potential demand area and could offer a buying opportunity, but only if the price shows a clear rejection signal or the price left a liquidity void behind that supports a bullish reaction
Full Analysis
On the H4 timeframe, EURUSD appears to be setting up for a corrective move to the downside before potentially resuming its upward structure. The level around 1.15364 stands out as an important zone where buyers may step back in, as it aligns with previous demand
However, the entry from this area isn’t confirmed yet
If price reaches the zone gradually and forms a strong rejection candle or any clear reaction that shows buyers absorbing liquidity, this could offer a clean long setup
On the other hand, if the market drops sharply into the level... and left a liquidity void behind that type of move can often produce a stronger bullish bounce, making it a valid buying point as well, provided there is a visible reaction

EURUSD Bullish Continuation Toward Key Sell ZoneQuick Summary
EURUSD is showing strong bullish momentum and is expected to continue rising toward 1.15715, where a potential sell setup may form pending a clear rejection trigger.
A secondary confirmation for selling comes from GBPUSD, which must break the 1.31559.
Full Analysis
Continuing the broader outlook on EURUSD, the recent upward movement is developing in a healthy and structurally consistent manner. The bullish progression indicates strong buy program, and as long as price maintains its higher-low structure, the market remains poised to reach the next significant level at 1.15715.
This area represents a notable reaction point where sellers may step in, making it a potential short opportunity. However, the sell setup should only be taken with a clear trigger, such as a sharp wick rejection, or a shift in short-term market structure. Without confirmation, price may simply sweep liquidity and continue higher.
An additional layer of confluence comes from GBPUSD.
If GBPUSD breaks 1.31559, this would signal of weakness.this will create a much stronger environment for EURUSD to form a valid sell reaction from 1.15715.

XAUUSD continues to rise after the Adam & Eve patternOANDA:XAUUSD is really interesting right now. The price seems likely to rise further after the formation of the Adam & Eve pattern. With such an easy-to-remember name, the Adam & Eve pattern is one of the most memorable. I will explain below the reasons and how to recognize it easily.
The Adam pattern is characterized by a sharp drop, followed by a quick recovery, forming a "V" on the chart. High, sharp, and aggressive! One could say it's more "masculine."
On the other hand, the Eve pattern develops more slowly. The price becomes more rounded, forming a wider and smoother base before rising again, creating a shape similar to the letter "U." Softer, more curved, and more "feminine."
Combining these two elements gives us the Adam & Eve pattern, which often signals a potential trend reversal. Especially when accompanied by fundamental analysis or other strong technical indicators.
This pattern will stick in your mind when you connect its shapes to the male and female aspects. A pattern that is truly hard to forget.

EURNZD BEARISH BREAKOUT|SHORT|
✅EURNZD has broken down from the supply level and is now trading in a discount leg, with liquidity resting below recent equal lows. As long as order flow stays bearish, the draw remains toward the target zone. Time Frame 7H.
SHORT🔥
✅Like and subscribe to never miss a new idea!✅

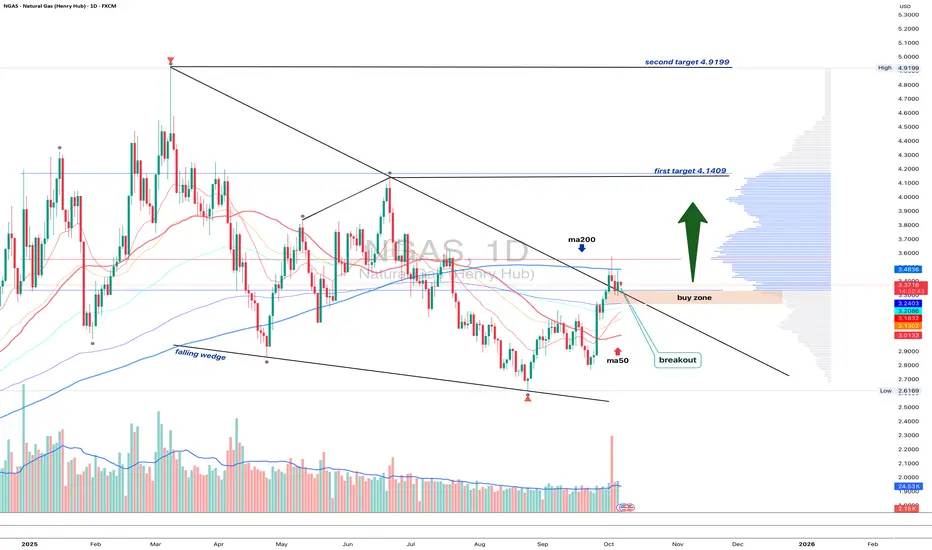
NGAS 1D - bulls waiting for the green lightOn the daily chart, Natural Gas has broken out of a falling wedge, but price remains below the MA200, while EMA still hovers above it - a mixed signal showing short-term hesitation within a longer-term downtrend.
The 3.10–3.20 buy zone remains key - that’s where the retest area aligns with short-term support. If buyers can reclaim the EMA and push above the MA200, the next upside targets are 4.14 and then 4.92.
Volume on the breakout supports growing bullish interest, while fundamentals - like rising seasonal demand - may soon add more fuel to the move.
Tactically , watch how price behaves near MA200. Once EMA flips back on top, momentum could accelerate fast. Until then, the market’s like a gas burner waiting for that click - ignition pending