Gold Buyers Regain Momentum — Aiming for 4,240 RetestHello traders! Let’s break down the current XAUUSD structure. Gold is trading within a broad ascending structure after forming a strong local bottom around the Support Line, where buyers entered the market and started to push the price higher. This upward movement follows a long corrective phase, during which the price respected the diagonal Support Line multiple times — confirming the presence of a stable bullish trend. Earlier, XAUUSD broke out of the Buyer Zone (4,110–4,120), retested it, and successfully held above it. This zone now acts as a key demand area and the primary level where buyers continue defending the trend. A previous bearish attempt failed here, forming a fake breakout and leading to a new bullish impulse. The price is now approaching the descending Resistance Line, which has repeatedly pushed gold lower during the recent correction. A clean breakout above this trendline may open the way for the price to move toward the major Resistance Level at 4,240.00, which also aligns with the first take-profit area (TP1). This Resistance Level has acted as a strong reaction zone multiple times, causing sharp pullbacks and marking the boundaries of the Seller Zone. Buyers will likely face significant opposition here once again. If gold respects the Buyer Zone and maintains trading above 4,110, the bullish scenario remains intact, and the price may push toward TP1 → 4,240. A confirmed breakout above this level would signal continuation toward higher targets within the broader bullish structure. However, if XAUUSD fails to hold the Buyer Zone and breaks below 4,110, the bullish outlook becomes invalid. In this case, the price may revisit the lower trendline or enter a deeper correction toward previous support areas. For now, the structure remains moderately bullish, with buyers dominating as long as the price stays above demand and respects the ascending Support Line. Please share this idea with your friends and click "Boost" 🚀
Breakout!

EURUSD Approaching a Key Buy ZoneQuick Summary
EURUSD is approaching a potential buy zone near 1.15370 where the pair is expected to take liquidity below the low at 1.15474 before showing a bullish reaction The likely target after the rebound is the break of the descending trendline on the H4 timeframe with the demand zone aligning with the 61 Fibonacci level
Full Analysis
The pair is gradually moving toward an important area around 1.15370 This zone represents a potential point where strong buying pressure may appear The current movement seems focused on collecting liquidity below the low at 1.15474 and once this liquidity is taken the probability of a bullish reaction becomes higher
If the price reacts from this level the next objective will be a move toward breaking the descending trendline on the H4 timeframe This scenario aligns with a previously formed demand zone and converges with the 61 Fibonacci level which adds more strength to the bullish continuation outlook
The main focus now is to wait for a clear reaction from the 1.15370 zone Whether it appears as a strong bounce or a shift in control toward buyers this area is likely to play a key role in guiding the next move of the pair

Title: FARTCOIN | Breakout Retest and Long-Term Structure PlayAfter a long period of compression, FARTCOIN (FART/USDT) is showing early signs of a potential trend reversal on the 1D chart.
Price has respected a descending resistance line for months while simultaneously forming higher lows on the ascending yellow trendline — signaling that bullish pressure may be building.
Currently, price is testing the intersection point between descending resistance and ascending support, forming what could be a symmetrical triangle breakout setup.
If we can hold above the breakout area and reclaim the mid-structure level (~0.40–0.42), the next technical objectives would be:
TP1: 0.56 – Retest of prior structural resistance
TP2: 0.73 – Measured move from the breakout pattern
TP3: 1.00+ – Potential full cycle expansion target
⚠️ Invalidation:
A daily candle close below 0.30 would suggest a failed breakout and continuation of the prior downtrend.
Educational Breakdown:
This setup is designed to teach how trendline confluence + structural compression can reveal early trend reversal zones.
Notice how the breakout leg aligns with a swing projection pattern, confirming momentum shift probability.
Bias:
Directional Bias: Bullish
Setup Type: Breakout + Retest (Mid-term swing)
Timeframe: 1D

XAUUSD Bullish Momentum Continues — Target 4,350OANDA:XAUUSD is still trading within a clearly defined ascending channel, with recent price action bouncing off a key support level. This suggests that the bullish trend is likely to continue, with the next target being around 4,350, aligning with the upper boundary of the channel.
A short-term pullback could present a buying opportunity, especially if bullish candlestick patterns like engulfing or hammer appear, signaling strength from the buyers. A decisive breakout above recent highs would further reinforce the momentum towards the expected target.
However, if the price breaks below the lower boundary of the channel, it would invalidate the bullish outlook and potentially signal a shift in market direction.
This is just my perspective on the market, not financial advice. Best of luck!

NZDUSD - Trio Rejection… Now Waiting for the Retest!📈NZDUSD has just rejected a strong TRIO retest zone , marked by the blue circle — the intersection of the demand zone, the falling channel support, and the oversold lower trendline. This confluence has already generated a strong bullish reaction.
⚔️Now, after the initial bounce, we will be waiting for price to retest the red demand zone. That’s where we will be looking for long setups, aligning with the new bullish momentum that formed after the trio rejection.
🏹As long as NZDUSD stays above the major green demand area , the bullish correction toward the upper orange trendline remains the most likely scenario. A strong reaction from the red zone would confirm buyers stepping back in.
Will NZDUSD give us the clean retest entry? 🤔
⚠️ Disclaimer: This is not financial advice. Always do your own research and manage risk properly.
📚 Stick to your trading plan regarding entries, risk, and management.
Good luck! 🍀
All Strategies Are Good; If Managed Properly!
~Richard Nasr

EURUSD Long: Upside Pressure Targets Retest of 1.1610 LevelHello traders! EURUSD is forming a clear technical structure after reacting precisely to both the Supply and Demand levels, creating a clean sequence of trend shifts and breakout points. Earlier, the pair moved inside a strong Descending Channel, where each retest of the upper boundary produced sharp bearish impulses. This confirmed that sellers were fully in control during that phase. A breakout from the channel led to a short consolidation Range, showing temporary buyer accumulation before a trend reversal. Following this accumulation, EURUSD entered an Ascending Channel, where price consistently made higher highs and higher lows. Multiple breakouts occurred along the way, showing how buyers gained strength while defending each pullback. However, an important Fake Breakout near 1.1570 revealed that bullish momentum was still fragile, and price slipped back into the channel before resuming the upward movement.
Currently,, the market formed a clear Inverse Head and Shoulders reversal pattern at the bottom, located directly inside the 1.1500–1.1520 Demand Zone. This zone acted as a major support cluster, generating strong bullish reactions. After confirming the neckline breakout, EURUSD rallied aggressively toward the current structure. At the moment, price is pushing higher and approaching the 1.16100 Supply Zone, which has repeatedly acted as resistance in previous market swings. This level is now the main obstacle for bulls and the next key reaction zone.
My scenario as long as EURUSD remains above the 1.15700 Demand Zone, the bullish trend structure remains intact. A continuation toward the 1.16100 Supply Zone (TP1) is the most likely scenario. This level is expected to create the next significant reaction, as it aligns with previous selling pressure. A clean breakout above 1.16100 would reinforce the bullish momentum and open the path toward the next upside levels. However, if EURUSD rejects the supply area, a pullback toward 1.15700–1.15500 may occur before buyers attempt another upward move. Only a breakdown below the demand zone would weaken the bullish outlook and shift momentum back toward sellers. For now, the market favors buying pullbacks into demand while monitoring reactions closely at the 1.16100 resistance. Manage your risk!

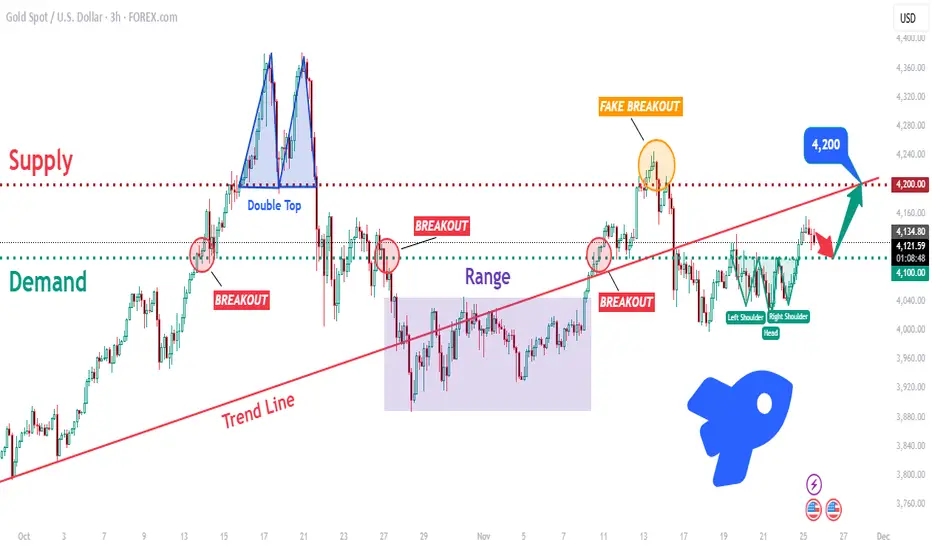
XAUUSD: Bulls Defend 4100! Is a Breakout to 4220 Imminent?Hello traders! XAUUSD continues to trade within a broader bullish structure, but with repeated volatility around key zones. The chart highlights how Gold has reacted multiple times to the major Demand Zone near 4,100, which has consistently acted as a strong support area. Each dip into this zone triggered a bullish response, confirming active buyers. Earlier in the structure, price formed a clear Double Top inside the Supply Zone around 4,220–4,230, which led to a strong bearish reversal and a breakdown below the trend line. After that, Gold entered a prolonged Range Phase, where the market consolidated sideways before breaking out to the upside. Recently, XAUUSD attempted a bullish continuation, but the move resulted in a Fake Breakout above the supply zone, signaling that buyers lacked the strength to maintain momentum above 4,220. This rejection pushed price downward and back below the main Trend Line, which now acts as dynamic resistance.
Currently, Gold is trading above the 4,100 Demand Zone, forming a potential Inverse Head and Shoulders pattern — an early sign that buyers may be preparing for another upward push. As long as price holds above 4,100 and stays above local structure, the bullish scenario remains valid.
My scenario, if XAUUSD holds above the 4,100 Demand Zone, buyers may gain momentum and attempt another breakout toward the 4,200–4,220 Supply Zone, which is the next major resistance and the primary upside target. A sustained break above 4,220 would confirm bullish strength and could open the path toward higher continuation targets. However, if buyers fail to hold the 4,100 level, Gold may drop back into the previous range or retest lower support areas before attempting another reversal. For now, the bias is moderately bullish, supported by demand reactions and reversal patterns — but a confirmed breakout above 4,200 is needed for stronger trend continuation. Manage your risk!
BTCUSD: Buyers Preparing for a Move Toward $90,000Hello everyone, here is my breakdown of the current Bitcoin setup.
Market Analysis
BTCUSD continues to recover after a prolonged downtrend, where the market consistently respected the descending Trend Line and formed a series of Range structures. Each range acted as a consolidation phase inside the broader bearish movement, with multiple breakdowns continuing the trend to the downside. Despite occasional bullish breakouts, none of them were strong enough to reverse the bearish structure, leading to further declines. Eventually, price reached the Support Zone around $84,000–$85,000, where the market produced a fake breakdown, signaling initial buyer activity. This fake breakout formed a local bottom that became the base for a reversal attempt. Following this reaction, BTCUSD began forming an Upward Channel, marking a shift in market structure from bearish to early-stage bullish. Inside this channel, price has started to create higher highs and higher lows—an essential signal of growing bullish momentum. The structure remains clean and technical: every pullback respects the lower boundary of the channel, while short impulses are reaching toward the midline of the structure. Buyers are gradually gaining control.
Currently, BTCUSD is stabilizing above the Support Zone while trading near the lower half of the ascending channel. As long as price respects this channel structure, sentiment remains bullish. The key area ahead is the Resistance Zone around $90,000, which previously acted as a pivot point and rejected bullish attempts multiple times. A clean breakout above this zone would confirm broader bullish strength.
Scenario & Strategy
I expect BTCUSD to continue moving inside the Upward Channel, gradually approaching the $90,000 Resistance Zone. A retest of this area is the most probable outcome if buyers maintain control. Short-term corrections may occur as the price approaches resistance, but overall structure favors a bullish continuation. A confirmed breakout above $90,000 could trigger a stronger move toward higher targets, opening the way for a larger trend reversal. This level remains the key barrier for buyers in the short and medium term.
However, if BTCUSD breaks down from the Upward Channel and falls below the $84,000 Support Zone, the bullish scenario becomes invalid. Such a move would likely signal a deeper correction or a return to bearish conditions. For now, buying the dips within the channel remains the more favorable approach as long as the structure stays intact and buyers continue defending support.
That's the setup I'm tracking. Thank you for your attention, and always manage your risk.

BTC Rebounds From 85K Support — Rally Toward 93K ResistanceHello traders! Let’s take a look at BTCUSD (Bitcoin). BTCUSD continues to trade within a broader corrective structure after a long bearish decline. Earlier, the market formed a large descending wedge, where price consistently respected both the Resistance Line and the Support Line. After the breakout from this wedge pattern, Bitcoin briefly turned bullish but soon entered a sideways Range, showing indecision and weakening momentum. The Range eventually broke to the downside, sending BTCUSD directly into the Seller Zone around $93,000, a key area that triggered several strong rejections in the past. A clean retest of this zone confirmed bearish pressure, leading to another impulsive drop. During the decline, price briefly pushed below the Support Zone near $85,000, creating a fake breakout, which trapped sellers and sparked a strong bullish reaction. From this point, buyers gained control and pushed price into a new ascending structure, supported by a rising Support Line shown on the chart. This indicates a shift in short-term momentum, with BTCUSD now forming higher highs and higher lows. Currently, Bitcoin is approaching the $93,000 Resistance Level, which aligns with the upper boundary of the previous Seller Zone. This is the key barrier for buyers. If price manages a clean breakout above this level, bullish continuation toward higher resistance zones becomes likely. As long as BTCUSD holds above the ascending Support Line and the $85,000 Support Area, the outlook remains bullish in the short term. From my perspective, BTCUSD is showing a short-term bullish continuation setup, supported by the ascending Support Line and the strong rejection from the $85,000 demand zone. If BTCUSD breaks back below $85,000, the bullish scenario becomes invalid, and a deeper correction could follow. For now, market structure supports a bullish recovery as long as buyers defend support and maintain the ascending trend. Please share this idea with your friends and click Boost 🚀

Most Realistic (Yet Profitable) Trading Strategy Signals in 2026CRAZY RESULTS. Setting up and checking the performance reports of one of the most realistic strategy signals on TradingView.
This is what I personally use on all my trades, newly upgraded and refined with new features.

EURUSD — Sell Setup After Sweep at 1.15882Quick Summary
EURUSD is forming a bearish opportunity around 1.15882.
The plan: wait for a sweep of the candle at that level, confirm the rejection, and then sell.
A bearish setup is supported by the internal CHoCH on the 15m, and the strong push upward has left behind a liquidity void, which makes it a downside target.
Full Analysis
According to the current price action, EURUSD is setting up for a potential sell from 1.15882. The key condition here is not selling immediately, but waiting for a sweep of the candle at that level. Once the sweep occurs and the market shows a clear rejection, the sell entry becomes valid.
The reasoning behind this setup is aligned with the short-term structure:
On the 15-minute timeframe, the market printed an internal CHoCH, signaling early weakness and a potential shift in intraday direction.
The recent sharp move upward created a noticeable liquidity void. Price often seeks to rebalance these inefficiencies, making that void an attractive downside target once selling pressure begins.

BTCUSD Long: Demand-Zone Rebound Targets $91,000 ResistanceHello traders! BTCUSD continues to trade inside a well-defined Descending Channel, confirming a strong bearish structure where the market consistently forms lower highs and lower lows. Throughout the chart, price repeatedly respects both channel boundaries, showing that sellers continue to dominate the trend. Earlier in the chart, Bitcoin created a Range Phase, indicating consolidation before sellers regained control and pushed price back down toward the mid-channel zone. Each time BTCUSD approached the channel’s upper boundary, it reacted with a clear pivot rejection, which initiated new downward waves — a classic pattern showing persistent sell-side pressure. A notable highlight is the Fake Breakout below the $84,000 area, where liquidity was swept before buyers stepped back in. This move created a strong reaction and initiated the current upward correction. The Demand Line drawn from recent lows has supported the price, helping BTCUSD climb back toward the mid-channel area.
Currently, Bitcoin is trading just above the $84,000 Demand Zone, which previously generated significant buying interest. The structure suggests that buyers may continue defending this zone, especially as price remains supported by the rising demand trendline. However, BTCUSD is still positioned below the $91,000–$92,000 Supply Zone, where sellers previously took control and where another reaction may occur.
My scenario, If buyers maintain momentum, price may attempt a corrective push toward the $91,000 resistance level — a key supply area aligned with the descending channel’s mid-line. A rejection here would be fully in line with the prevailing bearish trend. Manage your risk!

EURUSD: Fake Breakout Reversal Points to 1.1580 ResistanceHello everyone, here is my breakdown of the current Euro setup.
Market Analysis
EURUSD is currently trading within a broader Upward Channel, maintaining a medium-term bullish structure despite several corrective pullbacks. The chart shows that price has repeatedly respected both the channel’s lower boundary (around 1.1500–1.1510) and its upper boundary near 1.1650–1.1660, confirming the validity of this rising structure. Earlier in the move, EURUSD formed a Range Phase, followed by a clean Breakout, which established bullish momentum and pushed the pair higher toward the channel midpoint. Each breakout retest acted as support afterward, signaling strong buyer interest. However, the most recent movement shows a fake breakout below 1.1500, where sellers temporarily pushed price under support before it sharply recovered — a classic liquidity grab near the channel’s lower boundary.
Currently, EURUSD is trading just above the Support Zone (1.1500–1.1510) and forming an early bullish reaction. This area has repeatedly acted as demand and aligns with both channel support and the prior fake breakout region. The nearest obstacle for buyers remains the 1.1580 Resistance Level, which has consistently served as a rejection zone on multiple attempts. A sustained break above this level would confirm bullish control and allow price to retest higher channel areas.
My Scenario & Strategy
As long as EURUSD holds above the 1.1500–1.1510 Support Zone and stays within the upward channel, the bullish scenario remains valid. A corrective move upward is likely, with the first target at 1.1580 Resistance — a key level that aligns with previous breakout and retest points. A clean breakout above 1.1580 would signal continuation of bullish momentum, opening the path toward 1.1650–1.1660, located near the channel’s upper boundary and previous reaction zones.
Alternatively, if EURUSD fails to break 1.1580 and forms another rejection, sellers may attempt to push price back into the support area. A confirmed breakdown below 1.1500 would invalidate the current bullish structure and could shift the market toward a broader bearish correction. For now, long positions remain favorable while price stays above the channel’s lower boundary, with bullish continuation dependent on overcoming the 1.1580 resistance level.
That's the setup I'm tracking. Thank you for your attention, and always manage your risk.

XAUUSD: Buyers Aiming for a Rebound Toward $4,170 ResistanceHello everyone, here is my breakdown of the current Gold setup.
Market Analysis
XAUUSD continues to trade within a corrective structure, forming a broad Triangle Pattern defined by the Triangle Resistance Line above and the Triangle Support Line below. After a strong impulsive rally earlier, gold entered a prolonged consolidation phase, highlighted by a clear Range Zone where price repeatedly tested both the upper and lower boundaries without establishing a directional breakout. Several Breakouts occurred during this period, but each bullish attempt failed to secure continuation, leading to pullbacks that kept the market inside the broader consolidation. This showed clear indecision and a balanced battle between buyers and sellers.
Currently, gold retested the Support Zone around $4,040–$4,060, which coincides with the Triangle Support Line. A fake breakdown occurred below this level, but the market quickly bounced back, confirming strong demand and rejecting the bearish attempt. This rebound signals that buyers are actively defending the structure. Price is now stabilizing above support and showing early signs of bullish pressure. If buyers maintain control, the next logical target becomes the major Resistance Level at $4,170, which has acted as a key cap on previous bullish attempts. As long as XAUUSD stays above the Support Zone and trades within the rising trendline structure, the overall market bias remains moderately bullish.
Scenario & Strategy
I expect gold to gradually move upward from the current support area and retest the $4,170 Resistance Level. Minor corrections may occur along the way, but as long as price holds above $4,040, the bullish scenario remains valid. A clean breakout above $4,170 could trigger a stronger bullish continuation toward the next supply zone.
However, a breakdown below the Support Zone and Triangle Support Line would invalidate the bullish scenario and open the way for deeper correction. For now, buying the dips remains the more favorable approach as long as gold respects demand and stays within the triangle structure.
That's the setup I'm tracking. Thank you for your attention, and always manage your risk.

EURUSD Buyers Defend Support — Targets 1.1600 Resistance RetestHello traders! Let’s break down the current EURUSD structure. EURUSD is trading within a broad ascending structure, finding strong support at the Buyer Zone (1.1500–1.1510), which aligns with both the Support Level and the lower boundary of the rising channel. This area has acted as a key reaction point multiple times, confirming the presence of strong buyers and forming the base for several upward impulses. Earlier, the pair broke out of the descending triangle structure, retesting the former Seller Zone before continuing lower. After reaching the channel support, EURUSD formed a local bottom and started to grow, respecting the trendline and creating higher lows. A fake breakout occurred near the mid-channel resistance, where buyers quickly returned, signaling continued demand. Currently, EURUSD is approaching the Resistance Level at 1.1600, which also serves as the first major take-profit area (TP1). This zone has previously caused corrective moves and remains the main barrier for buyers. If the pair maintains momentum and stays above the Buyer Zone, I expect a bullish push toward TP1 → 1.1600, where sellers may again attempt to hold resistance. A confirmed breakout above 1.1600 would unlock a path toward higher levels within the ascending structure. However, if EURUSD breaks below 1.1500 and fails to hold the Buyer Zone, the bullish scenario becomes invalid. In that case, the price may revisit deeper support levels and potentially exit the rising channel. For now, the structure remains moderately bullish, with buyers dominating as long as the pair trades above demand and respects the ascending support line. Please share this idea with your friends and click "Boost" 🚀

GOLD (XAU/USD) : Strong Bullish ConfirmationGOLD is going to continue rising in an uptrend
that the pair established.
A completion of a consolidation and the formation of a new local Higher High
indicate a highly probable bullish continuation soon.
Next resistance - 4180 - 4200

EUR/CHF: Important Bullish BreakoutThe EURCHF has successfully violated a significant daily/intraday horizontal resistance level, and closed above it.
It is highly probable that this previously broken structure will now serve as a strong support.
I anticipate a subsequent upward movement and a continuation of the bullish trend towards the 0.9364 resistance level.

An Opportunity to Short GOLD You Can't MissOn the chart, gold continues to move smoothly within a clear downtrend channel, with highs and lows forming at progressively lower levels over time. Currently, the price is once again approaching the upper boundary of the channel and interacting with the same resistance area, where sellers have appeared multiple times before, pushing the market to reverse. This behavior indicates that the potential for a continued corrective move downward in line with the main trend remains intact.
In this context, I see a price decline toward the area around 4,080 as a logical and reasonable target for this corrective wave. As long as the price hasn’t decisively broken the upper boundary of the channel, I will continue to favor the scenario where the downward trend remains dominant, considering most upward movements as merely pullbacks within the existing structure.
This is not investment advice, but simply my personal viewpoint based on the current price action.

EUR-USD Strong Breakout! Buy!
Hello,Traders!
EURUSD broke above the horizontal demand after sweeping liquidity, signaling bullish expansion. A retest of the breakout zone could fuel continuation toward the next buy-side liquidity above. Time Frame 2H.
Buy!
Comment and subscribe to help us grow!
Check out other forecasts below too!
Disclosure: I am part of Trade Nation's Influencer program and receive a monthly fee for using their TradingView charts in my analysis.

USD-JPY Bearish Breakout! Sell!
Hello,Traders!
USDJPY broke down from the horizontal supply, leaving clear signs of distribution. A corrective pullback into the zone may precede continuation toward the next sell-side liquidity level below.Time Frame 1H.
Sell!
Comment and subscribe to help us grow!
Check out other forecasts below too!
Disclosure: I am part of Trade Nation's Influencer program and receive a monthly fee for using their TradingView charts in my analysis.

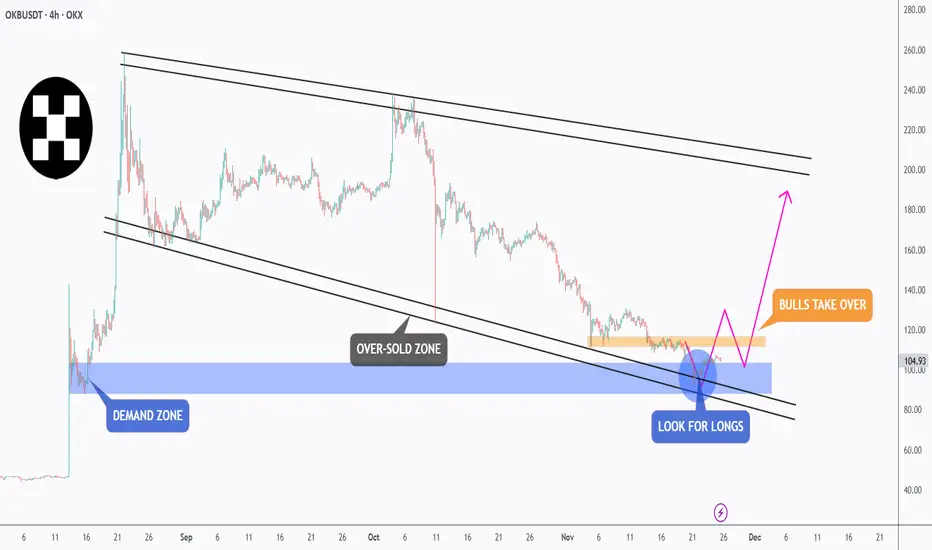
OKB - Demand Holding Strong… Correction on the Horizon?📉OKB is currently trading inside a broad falling channel , but price has just reacted from a major demand zone, which also aligns with the lower bound of the black channel. This confluence creates a strong oversold area where buyers typically step in.
⚔️As long as this demand zone continues to hold, we will be looking for bullish correction setups toward the upper bound of the falling channel. This would be the natural corrective wave after an extended sell-off.
🏹However, for the bulls to fully confirm control, price must break and hold above the orange high. A breakout above that structure would signal a shift in momentum and open the way for a larger trend reversal.
For now, demand is holding, the channel is intact, and the market is positioned for a potential rebound… will OKB deliver the correction we’re waiting for? 🤔
⚠️ Disclaimer: This is not financial advice. Always do your own research and manage risk properly.
📚 Stick to your trading plan regarding entries, risk, and management.
Good luck! 🍀
All Strategies Are Good; If Managed Properly!
~Richard Nasr
EURUSD Long: Buyers Eye a Push Toward 1.15700 Supply ZoneHello traders! EURUSD continues to trade within a broader bearish market structure, remaining below the long-term Supply Line, which acts as dynamic resistance and keeps the pair under selling pressure. The chart shows several pivot points forming along both the supply trendline and the rising demand trendline, confirming the current wedge-like structure. Earlier, the pair created a Rounding Top Pattern near the upper boundary of the structure, which signaled weakening bullish momentum and triggered a sharp decline toward the Demand Line. After touching the demand trendline around 1.1500, EURUSD formed a strong bullish reaction at the pivot point, showing buyers stepping in to maintain support. However, the recent breakout and retest of minor structure levels still leave the pair below the key 1.15700 Supply Zone, where price has reacted multiple times in the past. This zone aligns with horizontal supply and the descending Supply Line — forming a high-confluence resistance area.
Currently, the pair is attempting to recover toward 1.15700, which is the nearest upside target. If price reaches this level, it may face strong selling pressure once again, as previous breakouts from this zone turned into bearish rejection candles. As long as EURUSD remains trapped between the Demand Line and Supply Line, the overall structure stays corrective and heavily dependent on reactions at these key zones.
My scenario as long as EURUSD holds above the Demand Zone at 1.1500–1.1510, buyers may attempt a short-term recovery toward 1.15700, which acts as the nearest structural resistance. A clean breakout above 1.15700 would confirm bullish strength and could open the way for a deeper correction toward the descending Supply Line. However, if the pair gets rejected at the Supply Zone again, sellers may regain control and push price back toward 1.1510–1.1500, where demand is expected to react. A confirmed break below 1.1500 would invalidate the bullish recovery potential and could signal continuation of the broader bearish trend. For now, EURUSD supports a short-term bullish retracement, but the larger trend remains bearish while price stays below the descending Supply Line. Manage your risk!

Cognex (CGNX) – Downtrend Breakout + Double Bottom ConfirmationOn the Weekly timeframe , NASDAQ:CGNX is showing strong bullish technical signals:
The long-term downtrend line has been broken both on body and shadow, confirmed with high volume .
The last weekly candle is forming near a retest, while on the Daily chart, a strong bullish candle confirms buyers stepping in.
A clear Double Bottom pattern has formed, with the neckline overlapping the downtrend line, providing stronger confirmation.
Price is trading above EMA50 & EMA100 , with EMA50 attempting a bullish cross over EMA100.
The stock has also broken through local resistance , opening the way for higher targets.
MACD is bullish, showing positive momentum.
RSI is already inside the overbought zone. However, since no divergence is present, this could still support bullish continuation, though short-term pullbacks are possible.
Key Levels:
If the breakout and retest confirm, the first target is the nearby resistance zone.
A further move towards the next resistance level (~$72–73) is possible if momentum sustains.
Important Note:
This analysis is not a buy/sell signal , but rather an educational outlook. While technicals are bullish, traders should remain cautious as RSI is in the overbought zone, where short-term corrections are common.
(For educational purposes only, not financial advice.)
