XAUUSD Ascending Channel Strengthens: Bulls Target $4,130 TP1Hello traders! I want to share my view on the current XAUUSD setup. After a deep corrective move, gold has formed a local bottom around the Support Level at $4,000–$4,030, where strong buying pressure has re-entered the market. As shown on the chart, price is gradually climbing within a well-defined ascending channel, supported by the rising trendline and a parallel upper boundary. Inside this structure, the Buyer Zone has played a crucial role, providing the base for previous impulsive breakouts. Several fake breakdowns below the channel support confirmed the presence of significant demand. After these rebounds, XAUUSD twice reached the Seller Zone and the Resistance Level near $4,130, where it faced clear rejection and rotated back toward the Buyer Zone. Currently, gold is holding above the ascending channel support. If buyers continue to defend the $4,030 level and price remains stable within the Buyer Zone, I expect a move toward TP1 → $4,130, which is the nearest resistance. A clean breakout above this level would open the door for further bullish continuation toward the upper supply area around $4,200–$4,230. However, if the price breaks below the Buyer Zone and drops out of the channel, the bullish scenario becomes invalid, and the market may revisit the $4,000 support area. For now, the structure remains moderately bullish as long as price holds above demand and stays inside the ascending channel. Please share this idea with your friends and click Boost 🚀
Breakout!

EUR/USD – Trade UpdateI have entered a long (buy) position on EUR/USD after an Inducement and a confirmed rejection. This setup now shows a strong entry signal, increasing the probability of a successful trade.

Latest Gold Update Today!Hey traders,
As we kick off this new week, XAUUSD is holding steady, hovering around the 4,050-dollar level with barely any noticeable volatility.
This calm price action comes as the market keeps a close eye on what the Federal Reserve plans to do next. More and more participants are expecting the Fed to shift toward a more dovish stance and potentially move closer to a rate cut by the end of the year. With bond yields slipping, the dollar gradually losing strength, and safe-haven demand picking back up, gold is getting a solid foundation for a possible short-term push higher.
From a technical standpoint, XAUUSD is tightening inside a triangle pattern — a classic setup that usually signals accumulation before a stronger impulsive move. If price manages to break above the upper boundary, the next target could stretch toward the 4,500-dollar region, supported by the strength of the previous bullish leg.
From my perspective, market sentiment is slowly leaning toward the buyers, especially if upcoming U.S. data continues to ease pressure on gold.
What about you? How do you see things playing out? Are you expecting more upside, or do you think a correction is coming?
Wishing you a smooth, confident, and profitable trading week ahead.

Bitcoin Price Approaches Key Support: Rebound Toward 98,700?BITSTAMP:BTCUSD is approaching a key support zone, an area where buyers have repeatedly stepped in before and triggered notable reversals. That price history alone makes this level worth watching very closely. Price is pressing into this zone again, and the current structure suggests bullish potential if we see clear signs of rejection, such as a strong bullish engulfing candle, long lower wicks that show absorption of selling, or a visible increase in buying volume.
If this support holds, I expect price to push up toward the 98,700 area, which fits well with a short-term rebound scenario. If, on the other hand, price breaks below this zone and starts to hold underneath it, the bullish idea is invalidated and the door opens for a deeper downside move.
In my view, the best approach here is to let the chart confirm the story at this level. Watch how candles close, how volume reacts, and only consider long setups if the market clearly defends this zone. Solid risk management is essential: position size, stop loss placement and invalidation levels all need to respect the potential volatility around such an important area.
This is simply my personal view on the current support and resistance structure, not financial advice. Always confirm your own setup and trade with disciplined risk management. Good luck out there.

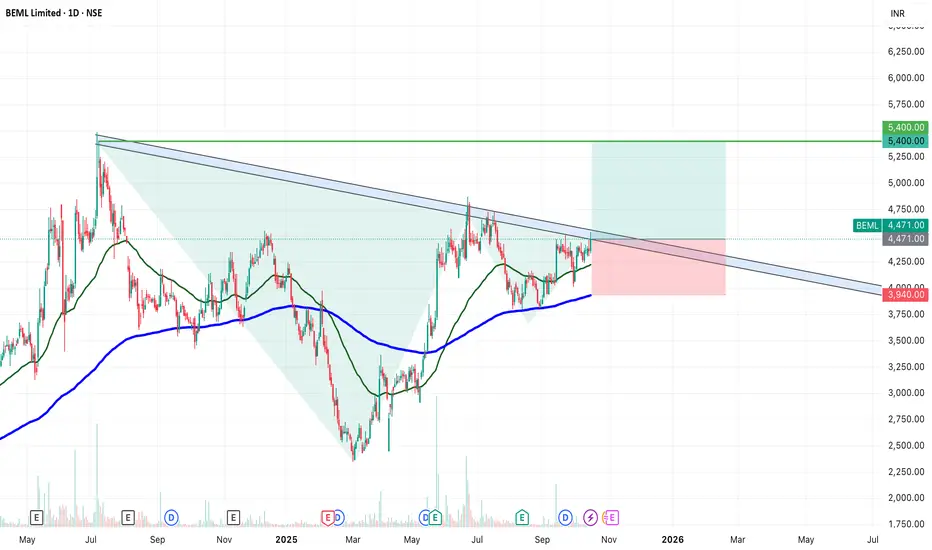
SWING IDEA - BEMLBEML Ltd , a key player in India’s defence and heavy equipment sector, is displaying a strong bullish breakout setup supported by multiple technical confirmations.
Reasons are listed below :
Breakout of a long-term trendline after multiple retests
Cup and Handle breakout, signaling continuation strength
VCP (Volatility Contraction Pattern) breakout indicating accumulation
Bullish engulfing candle on the daily timeframe confirming momentum
Higher highs and higher lows structure intact
Trading above 50 & 200 EMA, reinforcing trend strength
Target - 5400
Stoploss - daily close below 3940
DISCLAIMER -
Decisions to buy, sell, hold or trade in securities, commodities and other investments involve risk and are best made based on the advice of qualified financial professionals. Any trading in securities or other investments involves a risk of substantial losses. The practice of "Day Trading" involves particularly high risks and can cause you to lose substantial sums of money. Before undertaking any trading program, you should consult a qualified financial professional. Please consider carefully whether such trading is suitable for you in light of your financial condition and ability to bear financial risks. Under no circumstances shall we be liable for any loss or damage you or anyone else incurs as a result of any trading or investment activity that you or anyone else engages in based on any information or material you receive through TradingView or our services.
@visionary.growth.insights
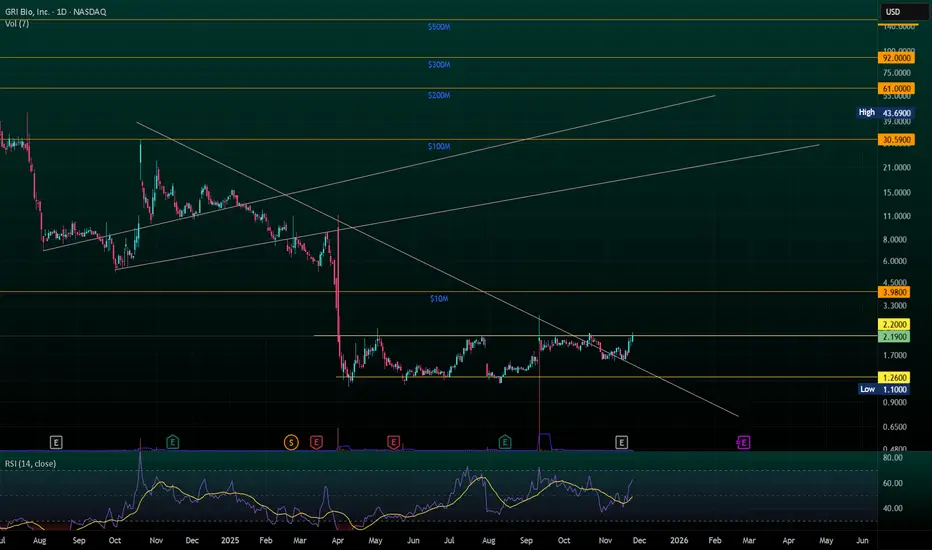
$GRI tap tap tapping $2.2 resistanceNASDAQ:GRI will release topline 12-week study data this week. All indications are that data will be positive. The price continues to test $2.2 resistance. This will be broken soon.
While all price movements are relative and unique, other companies with failed IPF trials lost ~$300M in market cap upon announcement. Others with successful trails have gained billions. GRI is worth approximately $6M today. Lots of room for upward valuation.
XAUUSD On the 1-hour chart, Gold is currently trading inside a tight symmetrical triangle, with price compressing between a rising trendline from the November 5th lows and a descending trendline from the November 14th highs.
Price is hovering around the $4,070 zone, which also aligns with the 50-period moving average, showing indecision but increasing pressure for a breakout.
A break and retest above the $4,085–4,095 resistance zone (highlighted in grey) may trigger a bullish momentum wave. The projected breakout target points toward the $4,180–4,220 region, based on the measured move from the previous swing.
As long as price holds above the rising trendline support, the structure remains bullish, with buyers expected to step in on any retest of support.

FireHoseReel | WLFI: Ready to Explode, Don’t Get Left Behind🔥 Welcome FireHoseReel !
Let’s break down what’s happening with WLFI right now.
👀 WLFI – 4H Technical Breakdown
WLFI has successfully broken its 4H dynamic resistance and has already completed a clean pullback retest.
Price is now pushing into the 4H box top, and a confirmed breakout above this zone will activate our long trigger, giving us a valid entry setup.
📊 Volume Analysis – Key Factor for Breakout
Multi-timeframe volume is increasing as WLFI approaches this resistance.
This time, the breakout attempt is backed by stronger buy volume + a clean curve-line break, unlike previous attempts where price showed volume divergence and failed to break through.
For WLFI, volume is the critical element—without strong volume, this resistance has historically rejected price.
✔️ WLFI/BTC Pair Note
The WLFI/BTC pair isn’t very useful for analysis since it’s only listed on Upbit, and the chart lacks structure and clarity.
Because of that, we rely mainly on the WLFI/USDT pair, which currently shows solid momentum toward a breakout.
✍️ Long Scenario setup becomes valid with:
• Breakout above 0.1602
• Clear volume convergence + increasing buy pressure
• A structure that forms a higher high outside the 4H box
• You can also wait for a break-and-retest (pullback) of this resistance to enter.
This entry is slightly riskier but gives a cleaner confirmation if the pullback candle forms an indecision/rejection setup.
🛞 Risk Management & Disclaimer
Please remember to always use proper risk management and position sizing. Nothing in this analysis is financial advice. The market can change quickly, so always trade based on your own strategy, research, and risk tolerance. You are fully responsible for your own trades.

EURUSD: Targets focus on declines to 1.1480 support levelHello everyone, here is my breakdown of the current Euro setup.
Market Analysis
EURUSD continues to trade within a clear Downward Channel, maintaining a strong bearish structure characterized by consistent lower highs and lower lows. Early in the chart, the pair formed a prolonged Range Phase, signaling indecision before sellers eventually took control and pushed the price downward. After breaking below the range, EURUSD repeatedly retested the Resistance Area around 1.1550, where the market showed strong bearish reactions. Each bounce into this resistance zone resulted in a clear rejection, proving that sellers consistently defend this area. The chart also highlights multiple Breakout attempts, all of which failed to sustain upward continuation, confirming a lack of bullish strength. Additionally, the chart shows the formation of a Triangle Pattern, with price reacting between the Triangle Resistance Line and the Triangle Support Line. Despite temporary recoveries, every move upward was limited and capped by descending trendline pressure.
Currently, EURUSD broke below the minor structure support again, demonstrating that bearish momentum remains dominant. Price is now heading toward the Support Zone near 1.1480, which aligns with both horizontal demand and the Triangle Support Line. This confluence makes it a key level to watch. As long as EURUSD trades below the 1.1550 Resistance Area and stays inside the Downward Channel, the bearish structure remains intact. Any bullish recovery is likely to be corrective rather than trend-changing unless buyers manage to break above major resistance.
My Scenario & Strategy
I expect EURUSD to continue edging lower toward the 1.1480 Support Zone, following the recent rejection from resistance. A minor upward correction may occur, potentially retesting broken support or the Triangle Resistance Line, but such a move would likely be short-lived without strong bullish confirmation.
A confirmed breakdown below 1.1480 would open the path for deeper bearish continuation within the Downward Channel. Only a solid breakout above 1.1550, backed by strong buying pressure, would challenge the prevailing bearish trend. For now, selling the pullbacks remains the more favorable strategy while price stays below major resistance.
That's the setup I'm tracking. Thank you for your attention, and always manage your risk.

XAUUSD: Price Holds Triangle Support, Aiming for $4,120Hello everyone, here is my breakdown of the current Gold setup.
Market Analysis
XAUUSD is trading within a broad symmetrical triangle structure, where price continues to respect both the Triangle Resistance Line and the Triangle Support Line. After a strong bullish rally inside the Upward Channel earlier, Gold reached the Resistance Area around $4,120–$4,130, where a sharp reversal occurred. This zone has consistently acted as a major supply level, triggering multiple corrections in recent sessions. Following the breakout below the Upward Channel, XAUUSD entered a consolidation phase supported by the Support Zone near $4,000, which aligns with the lower triangle boundary. This level has proven to be a key reaction zone, showing strong buyer interest each time price tested it.
Currently, Gold attempted another bullish push after bouncing from the Triangle Support Line. Price is now approaching the Resistance Area once again, but buyers face strong selling pressure around $4,080–$4,120, which overlaps with both horizontal resistance and the descending triangle boundary. A break and close above the Triangle Resistance Line would confirm bullish continuation and likely lead to a retest of higher liquidity levels near $4,180–$4,200. As long as XAUUSD stays above the $4,000 Support Zone, the broader structure remains bullish. However, sustained failure to break the resistance area may result in another corrective move back toward the Triangle Support Line.
My Scenario & Strategy
From my perspective, as long as Gold holds above $4,000, the bullish bias remains intact.
My near-term target (TP1) is the $4,120 Resistance Area, with potential extension toward $4,160–$4,200 if buyers manage a clean breakout above the triangle resistance. I will look for long entries on pullbacks toward the Triangle Support Line or the Support Zone around $4,000–$4,020, especially if bullish rejection patterns appear.
If XAUUSD breaks below the $4,000 level, the bullish setup becomes invalid and deeper correction toward $3,960–$3,920 may follow. For now, price action favors a bullish continuation setup, provided support continues to hold.
That's the setup I'm tracking. Thank you for your attention, and always manage your risk.

BTCUSD Channel Support Holds as Price Targets $85K PullbackHello traders! Let’s break down the current BTCUSD market structure. Bitcoin is trading inside a well-defined descending channel, forming consistent lower highs and lower lows. This structure confirms that the market is still moving within a broader bearish trend. Earlier, BTC created a large range phase on the left side of the chart, showing indecision before breaking down and starting the current downtrend. Each approach to the upper trendline (Resistance Line) resulted in a clear turnaround, proving that sellers continue to defend this zone aggressively. During the recent decline, BTC made multiple corrections inside the channel, but every upward move was short-lived and rejected by the descending resistance. A recent breakout attempt failed, and price quickly returned back into the channel, signaling that bullish momentum remains weak. Currently, Bitcoin is testing the Support Line of the descending channel near the $81,400–$82,000 zone. This level has acted as a key demand area within the trend. A short-term bounce from support is possible, and the chart shows a projected move toward TP1 near $85,000, which aligns with a minor internal resistance level. However, as long as BTC trades below the major Resistance Level around $94,000 and within the descending channel, the market maintains a bearish bias. Any bullish recovery is likely to be limited unless price can break above the channel and secure structure above $94,000. Please share this idea with your friends and click Boost 🚀

EURUSD Weakens at Resistance — Pullback Toward 1.1480 ExpectedHello traders! Let’s break down the current EURUSD structure. EURUSD continues to trade inside a broad descending channel, where both the resistance and support lines have been respected multiple times, forming a steady sequence of lower highs and lower lows. Each touch of the upper boundary resulted in a clear Turned Around reaction, confirming the strength of seller control within the overall bearish trend. Earlier, the pair entered a range phase in the left section of the chart, where price consolidated before breaking to the downside. This breakout accelerated bearish momentum, pushing EURUSD toward the lower half of the channel. Subsequent attempts at recovery formed shallow corrections, each aligning with the mid-channel dashed trendline, signaling persistent downward pressure. Recently, price approached the Buyer Zone near the 1.1480–1.1500 region, which also overlaps with the broader Support Level and the lower boundary of the descending channel. This area has previously acted as a strong reaction zone, and buyers are once again attempting to hold this level. At the moment, the EURUSD pair is showing early signs of a potential corrective rebound, with the price aiming for the nearest resistance level around 1.1540, which also coincides with the seller's zone. This region previously acted as support, and is now expected to serve as a barrier for a retest. As long as the pair remains below the descending resistance line, the broader trend remains bearish. A short-term correction to the level around 1.1540 is likely if buyers continue to defend the support level. However, a deviation from the resistance cluster could trigger renewed selling pressure, potentially sending EURUSD back to the channel bottom for another reaction. In my opinion, the price will move towards TP1 with a target of 1.14800. A confirmed break above the descending resistance line would be the first sign of a possible bullish shift, opening the door for a stronger recovery. Please share this idea with your friends and click "Boost" 🚀

EUR/USD – Potential Trade SetupI was expecting a price rebound from the 1.14938 level, and the pair did touch this area. However, the current trend is downward, so the only potential entry would be after breaking the previous highs to take liquidity before resuming the decline.
Currently, the available opportunity is around 1.15633, following the high taken at 1.15525. Traders should watch for confirmations before entering and manage risk carefully, as the overall momentum remains bearish.

BTCUSD Short: Descending Channel Targets $89,000 Demand ZoneHello traders! BTCUSD continues to trade within a clear descending channel, maintaining a strong bearish structure characterized by consecutive lower highs and lower lows. The price action repeatedly respected the channel boundaries, confirming solid seller control throughout the recent decline. Each time Bitcoin reached the upper boundary of the channel, it formed a pivot point, initiating another downward wave. Before the latest drop, BTCUSD spent some time moving sideways inside a Range Zone, showing temporary accumulation before sellers regained dominance. The bearish continuation led to another pivot formation near the channel’s resistance, triggering a fresh leg to the downside.
Currently, price has now approached the $89,000 Demand Zone, which aligns with the lower boundary of the descending channel. This level has acted as a significant reaction point, generating short-term bounces in previous price swings. The current positioning suggests that buyers may once again attempt to defend this zone. While below the $96,000 Supply Zone and the channel resistance, the broader trend remains bearish. BTCUSD is likely to experience a short-term corrective rebound from the demand area, aiming toward the $92,000–$93,500 region — a previous reaction cluster and local resistance.
My scenario is targeting the $89,000 level. However, if Bitcoin breaks below the $89,000 Demand Zone, it may trigger a deeper bearish continuation toward the lower liquidity areas around $88,000 or even lower. A confirmed breakout above $96,000 would be required to invalidate the bearish structure and signal a potential shift in momentum. For now, BTCUSD remains bearish, with a potential short-term correction from demand before further direction becomes clearer. Manage your risk!

BTCUSD: Bearish Momentum Aiming for New LowsHello everyone, here is my breakdown of the current Bitcoin setup.
Market Analysis
BTCUSD continues to follow a strong bearish market structure, consistently moving inside a well-defined Downward Channel. The chart clearly shows that after a prolonged consolidation phase inside the large Range, Bitcoin attempted both a fake breakout to the downside and a bullish breakout above the upper boundary — but neither attempt resulted in a sustained trend shift. This indicates that buyers lacked the strength to reverse the broader trend. Once price broke down from the range, BTCUSD established a clean sequence of lower highs and lower lows, forming two consecutive downward channels. Each retest of the channel’s upper boundary resulted in a strong bearish rejection, confirming heavy selling pressure at every corrective move upward.
Currently, the recent breakout below the minor support line inside the second downward channel once again demonstrates that sellers remain fully in control. Price is currently trading just above the major Support Zone around $90,400–$91,000, which has acted as a short-term demand area. However, the repeated bearish impulses and weak buyer reactions suggest decreasing bullish interest at these levels. BTCUSD is now hovering around support but forming a continuation pattern that leans toward further decline. Failure to break above the $96,000 Resistance Zone, aligned with previous structure and the former trendline, reinforces the bearish outlook.
My Scenario & Strategy
I expect that Bitcoin will likely attempt a minor corrective push to retest the broken support or the lower boundary of the channel — but any such move is expected to be short-lived unless strong buying pressure appears. After this corrective phase, BTCUSD may continue its decline toward the lower part of the channel and deeper support areas.
A confirmed breakdown below the current Support Zone ($90,400–$91,000) would strengthen the bearish scenario and open the path toward the next downside targets. Only a strong breakout above $96,000 — with clear bullish confirmation — would weaken the bearish bias and signal that buyers are stepping back into the market. For now, short positions remain more favorable, especially after corrective pullbacks into resistance zones within the downward channel structure.
That's the setup I'm tracking. Thank you for your attention, and always manage your risk.

EUR/USD – Buy Setup DevelopingThe EUR/USD is now showing potential for a buy opportunity after sweeping the trendline liquidity. The pair appears ready to rebound from the 1.15162 level, which aligns with a 1-hour Order Block—adding further confluence for a bullish reaction.
This area may serve as a strong support zone, suggesting a possible upward move if price holds above it.

Gold Analysis: Buyers vs Sellers Near Critical LevelsHello traders! Let’s take a look at XAUUSD (Gold). XAUUSD is currently trading within a broad corrective structure, moving between a well-defined Resistance Level near $4,100 and a strong Support Level around $4,030. Throughout the recent sessions, Gold has repeatedly reacted to these two key zones, forming clear ranges and turnarounds visible on the chart. Earlier, price created a large Range Phase, followed by a sharp rejection from the upper boundary of the descending Resistance Line, confirming continued selling pressure from higher levels. The repeated “Turned Around” reactions along this trendline show that sellers remain active every time price approaches the upper trend boundary. After breaking below the Seller Zone around $4,100, Gold retraced into the lower structure and entered the Buyer Zone, which aligns with both horizontal support and the ascending Support Line of the current bullish correction. This confluence makes the $4,030–$4,050 region a major demand area. Recently, XAUUSD bounced strongly from the Support Line, but the recovery stalled at the Seller Zone, where price is now showing signs of rejection once again. This confirms the zone as a significant barrier for buyers. A rejection from this level may trigger another downward movement toward the Support Level around $4,030, where buyers previously stepped in aggressively. As long as Gold trades below the descending Resistance Line and the $4,100–$4,110 area, the market retains a bearish-to-neutral tone. Only a clean breakout above this zone would signal a shift toward a stronger bullish phase and open the path to higher resistance levels. As long as XAUUSD remains below the $4,100 Resistance Level, sellers retain the advantage. I expect price to potentially reject the Seller Zone and move back toward the $4,050–$4,030 Support Level. A rejection from resistance sends price down toward $4,030, where buyers may attempt another defense. Break below this level opens the door for deeper correction. Overall, the market currently favors selling pullbacks into resistance, while the Support Line remains the key area for defending bullish structure. Please share this idea with your friends and click Boost 🚀

EUR/USD Analysis – Potential Buy OpportunityThe EUR/USD pair may start moving upwards to fill the liquidity void left during its decline over this week.
If a 15-minute candle closes above 1.15379 or inside this Order Block , this could present a good buying opportunity, with potential for the price to continue rising toward the Liquidity void
Keep a close eye on price action and ensure proper risk management before entering any trade.

Based on our fundamental analysis of Monolithisch India Ltd.Recommendation: NEUTRAL / HOLD
Rationale:
The company's fundamentals are strong—demonstrating phenomenal growth, high profitability, and a lean balance sheet. However, the current stock price has already discounted a significant amount of this future growth. The valuation is very rich (P/E of ≈71.9x), which leaves little room for error or unexpected slowdowns.
For an existing investor, holding the stock is reasonable to capture the expected growth. For a new investor, we recommend a Neutral stance, suggesting it is best to wait for a better entry point (a pullback in price) that offers a more favorable risk-to-reward balance.
Price Target and Duration
Since the market is currently rewarding the exceptional growth with a high multiple, we anchor our near-term target to a slight premium on the current valuation based on sustained financial performance.
Target Price: ₹550
Target Duration: 12-15 Months (This is a long-term view that factors in the execution of the company's current expansion plans).

AUDCHF: Price Cross Below H1 ATLDaily TF:
Price is ranging with a weak bearish bias
Strong trend indication will occur after price breaches below HTL
H1 TF:
Price crosses below ATL
Sell stop triggered as downside momentum is expected to pick up

NZDCHF: Trend ContinuationDaily TF
Not much to say other than price is in a clear downtrend
H1 TF
Price crossed below ATL and is holding
EMA20 is barely below EMA60 so this is a weak downtrend confluence
Trading: definitely proceed with caution and consider reducing size and then scaling in momentum picks up

The Gold Bullish Setup You Can't Afford to Miss!OANDA:XAUUSD The price is currently showing clear signs that it’s approaching a significant support zone, an area where the market has previously reacted positively. This zone is also near the psychological threshold of $4,000, a level that generally attracts considerable attention in the market.
The momentum from this zone suggests that buyers could step in and push the price higher. A positive confirmation, such as a strong rejection pattern, a bullish engulfing candle, or a long lower shadow, would increase the likelihood of a rebound from this level. If my prediction is
correct and buyers regain control, the price could reach $4,070.
However, a break below this support level would invalidate the bullish outlook and could lead to a deeper price decline.
This is not financial advice!

EURUSD Short Setup if Key Level BreaksIf the EURUSD manages to break below the 1.15243 level, a potential short opportunity may develop around 1.15273. However, this setup is not confirmed yet, and the key element here is patience and proper validation.
For this scenario to become valid, the market must first close a 15-minute candle below 1.15243. Such a close would indicate that the price has successfully broken through the level and is showing signs of rejection from the 15-minute orderblock, suggesting that sellers are stepping in with intention.
This type of confirmation is essential because it filters out false breaks and ensures that the market is truly shifting momentum. If this rejection is validated, then the retest of 1.15273 could provide a precise and clean entry for short setups, with structure and liquidity alignment supporting the move.
Until that break and close happen, the level remains a potential reaction point rather than a confirmed bearish continuation signal. As always, waiting for clear confirmation helps avoid entering the market prematurely, especially during periods where liquidity sweeps are common.
