XAUUSD Breaks Out and Continues Its Bullish RallyOANDA:XAUUSD The market is still in a strong downtrend, yet the bearish momentum is gradually losing strength as a double bottom pattern begins to form, a classic signal that sellers are running out of steam.
After the second bottom took shape, buyers stepped in with growing confidence, and the price is now testing the neckline, confirming a structural shift toward a potential bullish reversal.
At this point, all eyes are fixed on the neckline. If a breakout above this level occurs, it will confirm the pattern and open the path for buyers to push the price higher toward 4,135.
Breakout!

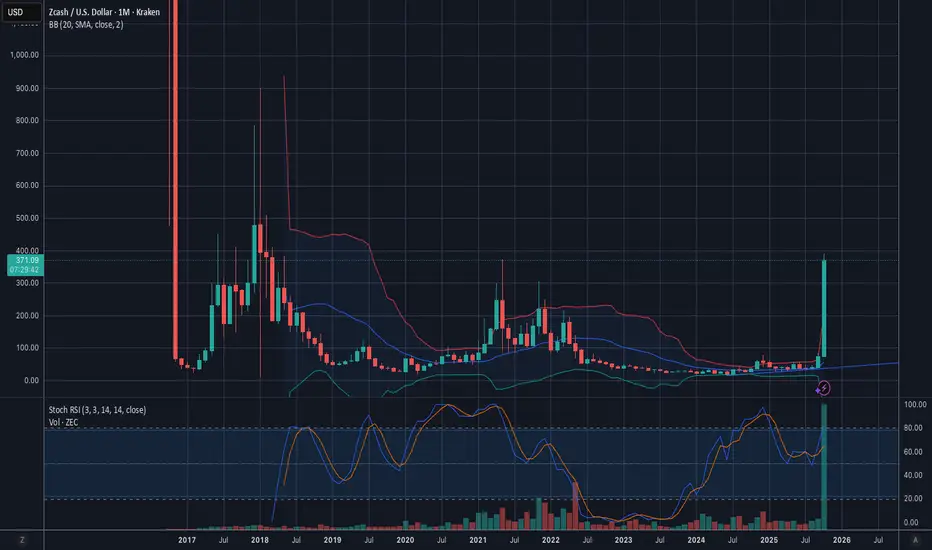
ZEC not a secret anymore with a bullish monthly close incoming ZEC has been unreal and life changing.
But this is only the beginning.
Zcash will print another candle on the monthly chart today.
The asset is looking for support above the 2021 top.
All signs are pointing to this happening.
ZEC has on exchange price history at $30k and beyond a coin.
The buy volume on the monthly chart is massive.
It's time to lock in. Tf in.
My intent for your reality is the same bliss I am seeking.
BTCUSD Short: Targeting 108,000 Demand ZoneHello, traders! Bitcoin (BTCUSD) has recently transitioned from a prolonged bullish structure into a corrective phase after facing strong rejection from the 116,000 Supply Zone. The market previously traded inside a well-defined Ascending Channel, forming a steady sequence of higher highs and higher lows — a classic bullish formation.However, after testing the upper boundary of the channel and the Pivot Point, BTC failed to sustain bullish momentum. The breakout attempts above the supply zone turned out to be fake breakouts, showing exhaustion among buyers. Since then, the market has shifted its tone and started to form a descending structure, moving below the Supply Line that now acts as dynamic resistance.
Currently, the price is pushing lower from the mid-range of the channel toward the Demand Zone, located between 108,000 and 107,700. This area has previously served as a strong support base that triggered impulsive bullish reversals in the past.
In my opinion, BTC is likely to extend its bearish correction toward the 108,000–107,700 demand area. A successful test and strong reaction from this zone could mark a potential bullish reversal, confirming demand absorption and the end of the correction phase. However, if sellers maintain control and manage to break decisively below 107,700, the market may open the way for a deeper decline toward the 106,000 level. As long as the price remains below the Supply Line, short-term bearish pressure prevails. I’m currently bearish to neutral, looking for price action signals around the demand area to confirm whether a new upward impulse is about to begin. Manage your risk!

Gold Rebound: Bulls Target 4,130 ResistanceHello, traders, I want share with you my opinion about Gold. Gold has been trading within a broad technical structure, evolving from a strong bullish phase into a corrective descending channel. The previous uptrend was clearly defined by an ascending channel, which guided the price through multiple impulsive rallies and pullbacks. However, after forming a double-top pattern near the 4320 resistance level, buyers began to lose momentum, resulting in a sharp decline. Currently, the price is trading within a well-defined descending channel, where sellers have been maintaining short-term control. After a deep test of the Buyer Zone around 3920, the market has shown early signs of a potential rebound. The asset is now pulling back from this support area and is approaching the resistance line of the descending channel. In my opinion, this upward correction represents a short-term recovery within a larger bearish context. I expect that the price will rally towards the Resistance Level near 4130–4140, where strong selling pressure may reappear. This area is also aligned with the upper boundary of the descending channel, creating a strong confluence zone. A rejection from this resistance line would confirm the continuation of the bearish structure. The next potential move could be a rotation back down towards the Buyer Zone, or even a deeper retest of the Support Line around 3920. My take-profit (TP1) for the corrective rally is placed at 4108, targeting the upper range of the structure before the next potential reversal. Please share this idea with your friends and click Boost 🚀

USDJPY Potential BULLISH Setup🚀 USDJPY UPDATE: BULLISH Setup
Summary:
Analysing price action from yesterday, breakout from the Daily timeframe accumulation zone has materialized with strong conviction.
TRADE SETUP Metrics:
- Entry: ✅
- Stop loss - Below Support Zone
- Target 1: (R:R 1:2)🎯
Technical Anticipations:
- Price action to show a Bearish rejection around BOS
- Support zone to hold
Position Management:
- Profits secured at Target 1 (choosing to keep it short and sweet)
LIKE or COMMENT if this idea sparks your interest, or share your thoughts below!
FOLLOW to keep up with fresh ideas.
Tidypips: "Keep It Clean, Trade Mean!"

NZDCHF: H1 ATL BreakKey observations across the D1 and H1 timeframes
D1
Pair is in a clean downtrend
Right now, the bearish bar hasn't closed below the low of the bullish bar, which is a small point of concern for selling strength
H1
Price is crossing below a very structural ATL
EMA bands haven't crossed over yet

XAUUSD: A Potential Reversal on the HorizonOANDA:XAUUSD The price has been on a steady decline, but there's a shift happening. Sellers have tried to push the price even lower twice, but both attempts were met with strong rejection at nearly the same price level. This is forming a Double Bottom, a classic signal that the downward momentum is losing power.
Now, all focus is on the neckline. A decisive breakout and a close above this level will not only confirm the pattern but could also spark a significant rally toward the 4,135 target.
If this happens, we could be looking at the beginning of a powerful trend reversal. The market is gearing up for a move, and this is where it gets exciting.

EURUSD Long: Buyers Targeting a Move Toward 1.1670 ResistanceHello traders! EURUSD has recently shown a structural shift after forming a strong rejection from the Demand Zone near 1.1560, which also acted as a key pivot area. This reaction marked the end of the previous bearish phase inside the Descending Channel, leading to the formation of a new Ascending Channel — indicating the potential start of a medium-term recovery.
After the price reached the Supply Line, a fake breakout occurred around 1.1670, followed by a brief pullback to retest the lower boundary of the channel. This move trapped early sellers, and the quick rebound suggests that buyers are still active and defending the structure.
At the moment, EURUSD is trading around 1.1640, aiming for another test of the 1.1670 resistance zone, which aligns with both the supply line and the upper boundary of the channel. A successful breakout above this area could confirm bullish continuation, targeting higher levels. However, a strong rejection from this resistance might trigger another short-term correction back toward 1.1600–1.1580, where demand could once again reappear. Overall, the structure remains bullish-to-neutral in the short term, with 1.1670 acting as the critical breakout level to watch. Manage your risk!

Breakout in ENGINERSINBreakout in ENGINERSIN.
Entry - 206
Target - 250
SL - 196
DISCLAIMER: I am not SEBI registered and the ideas posted are only for educational purpose. Do a proper analysis and always trade with STOP LOSS.

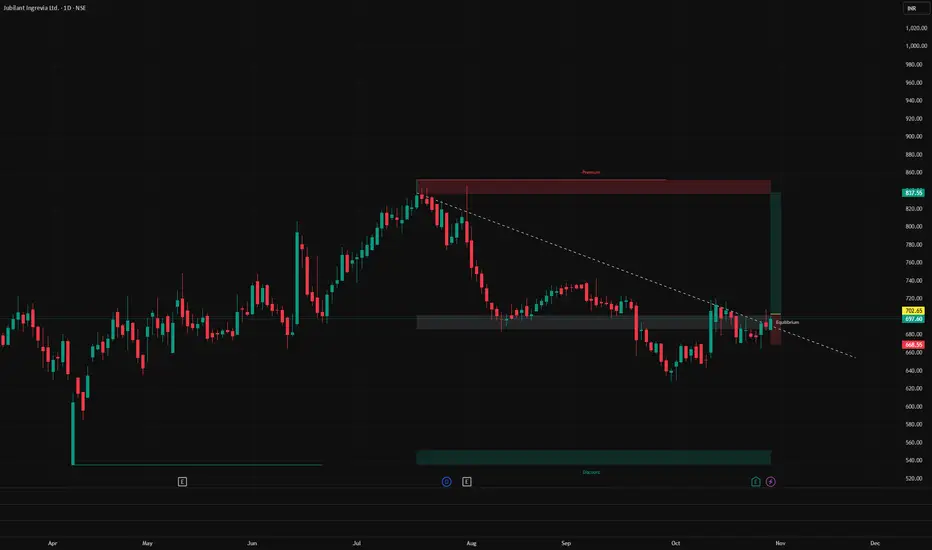
Breakout in JUBILANT INGREVIA.Breakout in JUBILANT INGREVIA.
Entry - 702
Target - 830
SL - 670
DISCLAIMER: I am not SEBI registered and the ideas posted are only for educational purpose. Do a proper analysis and always trade with STOP LOSS.
Bitcoin Approaches Key Resistance — Bulls Eye 117K BreakoutHello traders, I want to share my view on Bitcoin (BTCUSD). The current market structure shows a gradual recovery phase following the previous breakdown from a large range near the 118,000 level. After a sharp decline and retest of the 106,400 support zone, the market found strong buying interest, forming a new ascending channel structure. This setup has been characterized by steady higher highs and higher lows, confirming the presence of short-term bullish momentum. At this stage, BTCUSD is approaching a key resistance level around 116,000, which aligns with both the upper boundary of the current channel and the prior horizontal resistance zone — a region that previously acted as a strong supply area. This confluence suggests that the market could face a short-term pause or pullback before attempting another bullish impulse. My primary scenario anticipates that if the price holds above the support line near 113,000–113,500, buyers may maintain control and push toward the 117,000 target (TP1) — the next logical resistance level and the top of the channel. However, a clear rejection from 116,000 without follow-through could open the door to a corrective pullback toward 110,500–111,000 for another demand test. In my opinion, the structure remains bullish in the short term, as long as the lower boundary of the ascending channel holds. Therefore, I continue to favor a long scenario with a TP at 117,000, expecting a potential breakout or test of the upper resistance. Please share this idea with your friends and click Boost 🚀

ALLCARGO MAKING STRONG BASE FOR HUGE BREAKOUT SOONAllcargo Logistics operates as a global integrated logistics solutions provider, specializing in multimodal transport, container freight stations, contract logistics, and project cargo. It plays a pivotal role in global trade, with a presence in over 180 countries.
Yes, Allcargo Logistics is showing signs of short-term strength. The stock is currently trading around 33.30, slightly above key pivot and resistance levels , a VCP pattern is emerging and waiting for full confirmation ,
- 📈 Bullish trigger: Sustained close above 33.76 (100-day EMA) with volume
- 📉 Bearish risk: Breakdown below 31.20 could invite further downside
short to mid term it may show good upside as risk and reward ratio looking good at current levels .

Breakout in VAIBHAV GLOBALBreakout in VAIBHAV GLOBAL.
Entry - 239
Target - 265
SL - 228
DISCLAIMER: I am not SEBI registered and the ideas posted are only for educational purpose. Do a proper analysis and always trade with STOP LOSS.

XAUUSD: The Bullish ABCD Pattern Signals Potential Price SurgeHey everyone, it's Erik!
The price has decreased within the bullish ABCD pattern, a pattern that often indicates that the sellers have exhausted their strength, with their momentum weakening near the bottom.
Recently, the price broke above the upper trendline, signaling that buyers are starting to intervene, shifting the market dynamics in their favor.
If the price stays above this recently broken level, we could see a significant rise. My target is for the price to reach around 4,130, a reasonable level based on the current setup.

BTCUSD Breakout: Daily Neckline Close Targets 122,000–124,500Hello, traders—BTCUSD is coiling inside a broad 1D range after topping near 126,000. Buyers defended the demand zone at 104,000–108,000 and price has since pushed back toward a clear neckline around 116,000 formed by a developing double-bottom (lows from early September and mid-October). The structure is neutral-to-bullish, with momentum improving as price rebounds from the lower boundary.
Primary path: a daily close above 116,000 confirms the neckline break and opens room toward 122,000 first, then the 124,500–125,000 resistance where supply repeatedly capped rallies. If strength persists, watch for a break-and-hold above 125,000 to transition the range into continuation. Trade-wise, the cleaner confirmation is a daily close ≥116,000/116,500 with targets at 122,000 and 124,500 while using the prior breakout area to trail risk.
Alternative: a firm rejection at 116,000 would keep the range intact and invite a pullback toward 111,500. A decisive daily close below 111,500 puts 108,000 back in play; a loss of 108,000 risks a deeper sweep toward the 104,000 floor.
Invalidation for the bullish idea is a daily close back below 111,500 after breakout, or any decisive failure of 108,000 that negates the base. This is a study, not financial advice. Manage risk and invalidations

XAUUSD Short: Selling the Bounce Within the Descending ChannelHello, traders! The price action for Gold (XAUUSD) has been dominated by a bearish structure since the breakout below the ascending channel and rejection from the SUPPLY ZONE 2 near 4250. This move initiated a clear downtrend, forming a descending channel that has guided the market lower through a sequence of impulsive declines and short corrective rebounds.
Currently, the price is testing the Demand Line of this descending channel, located just above the Demand Zone around 3867. This zone represents a key area of potential buying interest that previously acted as a reaction point during earlier phases of the uptrend. In my view, the market is now entering a critical stage. A temporary corrective rally towards the upper boundary of the channel (near the Supply Zone 1 at 3950–4100) is likely before sellers may step in again to resume the broader downtrend.
My scenario anticipates that this corrective bounce will be limited, with sellers defending the Supply Zone 1, leading to another move downward toward the Demand Zone and potentially lower levels. A confirmed reversal signal in this area, however, could offer a long opportunity for a larger bullish impulse later on. Manage your risk!

BTCUSD Short: Sellers Aiming for a Pullback Toward 109,600Hello, traders! Bitcoin (BTCUSD) continues to trade within a broader corrective structure after losing momentum from its previous bullish phase inside the Ascending Channel. The breakdown from the channel shifted the short-term sentiment from bullish to neutral-bearish, with sellers now defending the upper boundary of the current Supply Zone. After the strong rejection from the 118K–116K region, BTC entered a range-bound phase between 109,600 (Demand Zone) and 116K (Supply Line). This range represents a period of accumulation or distribution — depending on how the price reacts at its edges.
Recently, the price retested the upper boundary of the Supply Zone, where a fake breakout occurred, followed by selling pressure — a clear sign that supply remains dominant. Now, the market is showing early signs of potential correction back toward the Demand Line near 109,600, where buyers previously stepped in to defend the trend.
If the bearish momentum continues, I expect a move down toward the Demand Zone around 109,600–107,700. This area aligns with both a key pivot point and the ascending demand line, which could act as a springboard for another bullish rebound. Conversely, a confirmed breakout above 116K would invalidate the short-term bearish outlook and signal a possible continuation toward higher resistance levels. For now, my bias remains bearish-to-neutral, anticipating a short-term correction before a potential bullish reaction from the demand area. Manage your risk!

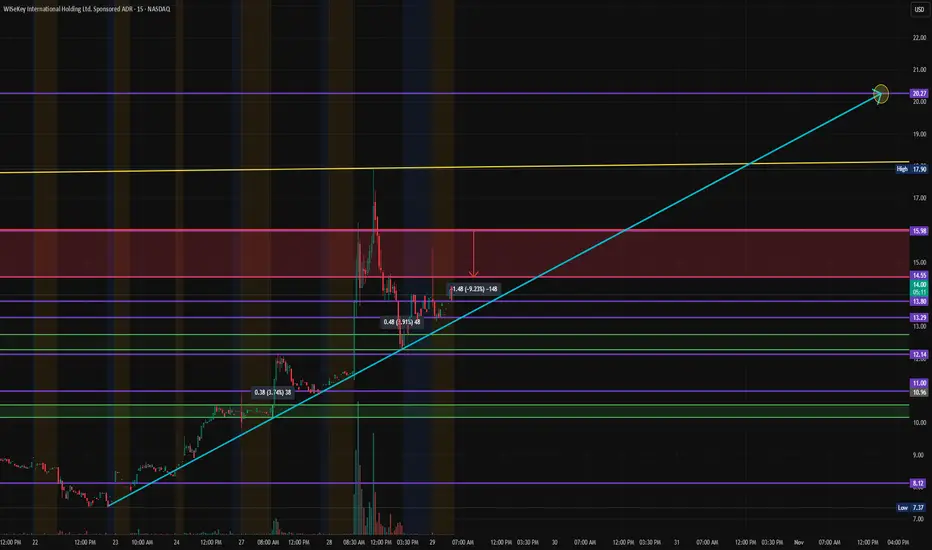
$WKEY – Testing Heavy Resistance Before the Next Quantum Leap?NASDAQ:WKEY is pressing back into the key $14.55–$15.98 resistance zone after a massive short-term run from the $7.37 base.
We saw significant sell volume hit that region during the last test — but price continues to grind higher along the trendline, showing notable strength despite prior supply.
A clean breakout above $15.98 could open the door to $17.90, with an extension target of $20.27 if momentum carries into November.
This aligns with the long-term projection channel shown on the chart.
🧩 Technical Outlook
Support: $13.29 → $12.14 → $11.00
Resistance: $15.98 → $17.90 → $20.27
Trend: Short-term bullish continuation pattern forming higher lows.
Volume: Noticeable absorption around $14.50–$15.50; sellers active but buyers defending the uptrend line.
Momentum Indicator: RSI currently in the upper 70s, showing overbought but persistent strength — typical of trending breakouts.
The next few sessions will be key — either NASDAQ:WKEY consolidates beneath $15.98 or rips through, confirming the start of a new expansion leg.
🛰️ Fundamental Catalyst
🗓️ 04:46 AM EDT, 10/29/2025 (MT Newswires) —
WISeKey International ( NASDAQ:WKEY ) and its subsidiaries SEALSQ (LAES) and WISeSat.Space announced a partnership memorandum with INNOSPACE, a South Korean satellite launch services provider.
The collaboration aims to expand post-quantum encryption technologies into orbit.
Earlier this month, WISeKey and SEALSQ confirmed they will demonstrate post-quantum encryption in orbit during a SpaceX launch from Vandenberg Space Force Base, marking a milestone in next-generation cybersecurity and space infrastructure integration.
These developments reinforce WISeKey’s growing footprint in secure IoT, quantum cryptography, and satellite communications — three rapidly converging markets.
📊 Finviz Snapshot
Metric Value Notes
Market Cap $28.14M Small-cap, low-float
P/S 2.33 Reasonable for tech microcap
Gross Margin 41.22% Healthy despite low revenue
Current Ratio 6.05 Strong liquidity
Debt/Equity 0.16 Very low leverage
YTD Performance +566% Strong momentum
52W Low → High $1.61 → $17.90 +970% range
Peers PXLW, SQNS, PRSO, CYBR, OKTA, PANW, FTNT Competes in cybersecurity & IoT tech
Despite dilution pressure from prior offerings, WKEY remains one of the few small-cap plays actively bridging quantum security + satellite communications — both sectors expected to grow exponentially through 2030.
💡 My Plan
Watching for continued strength above the $14.50 region.
Entry Zone: $13.80–$14.50
Breakout Confirmation: $15.98+ close
Targets: $17.90 → $20.27
Invalidation: Close below $12.50 (loss of short-term structure)
Post-quantum encryption meets satellite communication 🚀
Do you think NASDAQ:WKEY can push past $15.98 resistance and retest $20 — or will the volume wall hold it down short term?
Drop your outlook (bullish/bearish) and I’ll post a follow-up MyMI-style update with on-chart projections 📈
#WKEY #QuantumComputing #Cybersecurity #SpaceTech #Stocks #MyMIWallet #AIAnalysis #TradingView NASDAQ:WKEY NASDAQ:LAES AMEX:SPY NASDAQ:QQQ
BTC/USD Bullish Breakout major area breakout🚀 #Bitcoin Bullish Breakout Alert! 💥
📈 CRYPTOCAP:BTC has broken out above the key supply zone at 115,800 — confirming strong bullish momentum! 🔥
✅ Entry: Above 115,800 (after confirmed breakout)
🎯 Target 1: 117,700
💪 Momentum building — buyers are taking control!
#Bitcoin #BTC #CryptoTrading #Breakout #Bullish #CryptoAnalysis #BTCUSD
💬 Like | 💭 Comment | 🔁 Share with your trading community

United Spirits Limited chart analysis: BUY Setup Entry: ₹1,359-1,365 (Current Level)
Target 1: ₹1,393-1,400
Target 2: ₹1,420-1,425
Target 3: ₹1,450+ (Extended)
Stop Loss: ₹1,338

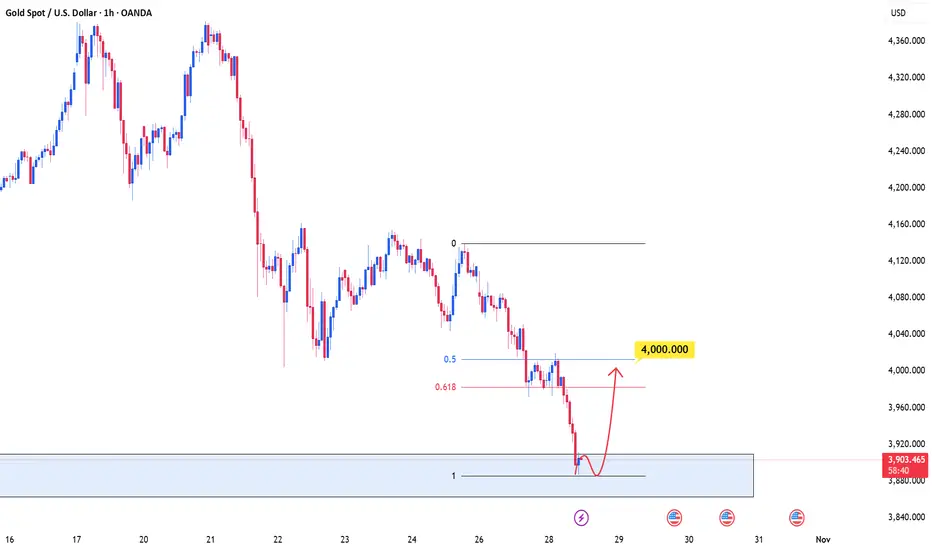
GOLD will return to the Fibonacci level after a sharp declineOANDA:XAUUSD The price recently experienced a sharp sell-off and, after being strongly rejected at a key resistance level, is now entering a stabilization phase. We’re currently in a consolidation phase, where the selling pressure is gradually subsiding.
If buyers can hold this level and push the price higher, the next target will be the Fibonacci retracement zone of 0.5–0.618, ranging between 4,000 and 4,020. This is a critical area, as it could mark the point where sellers may re-enter the market, creating further fluctuations.
Wishing you all successful trades and substantial profits!
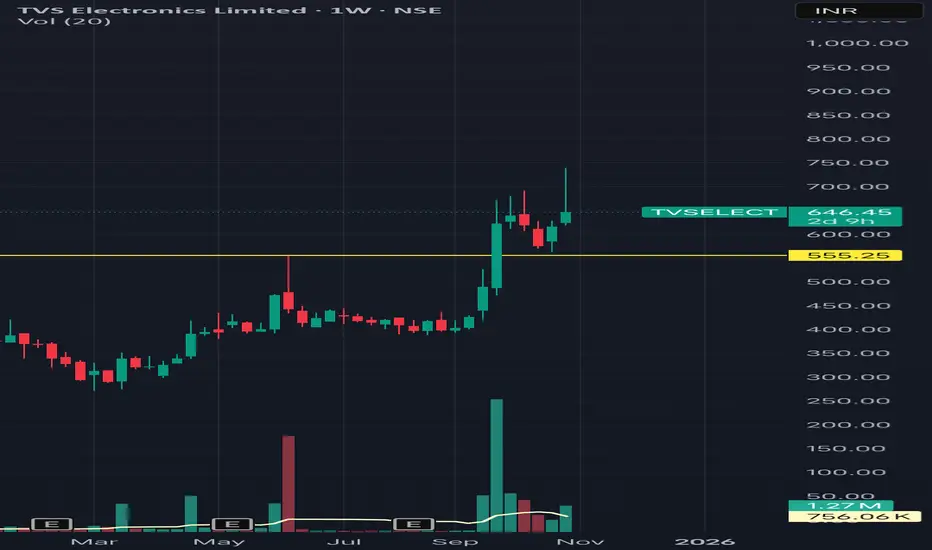
TVS Electronics – Multi-Year Breakout Retest
Weekly Chart Analysis – TVS Electronics Limited (TVSELECT)
The stock has broken out above the ₹550–₹560 resistance zone, which had been holding for several years.
After a strong breakout, the price retested the breakout zone and is now showing bullish continuation with healthy volume.
Chart Insights:
Multi-year breakout confirmed on weekly timeframe
Price structure forming higher highs and higher lows
View:
If the price sustains above ₹580, momentum may continue toward higher levels in upcoming weeks.
⚠️ Disclaimer:
This post reflects my personal analysis and learning purpose only.
It is not financial advice or a buy/sell recommendation. Always do your own research before taking any trade.
AMZN Break Out -- Bullish1HR time frame paints a good picture of what's to come in the short term...at least from my perspective.
AMZN finally broke through the sideways chop today with momentum and pushed to the 1.618 fib (from the closed peak of the last wave on 10/3 to the closed low on 10/6).
RSI showing momentum and in an upward trend despite the recent choppiness since 9/25.
RSI peaked at about 77, and looking to cooldown after the breakout. I suspect we'll see price revisit mid $223 before continuing upwards. Will most likely see stair stepping up to the $230's.
