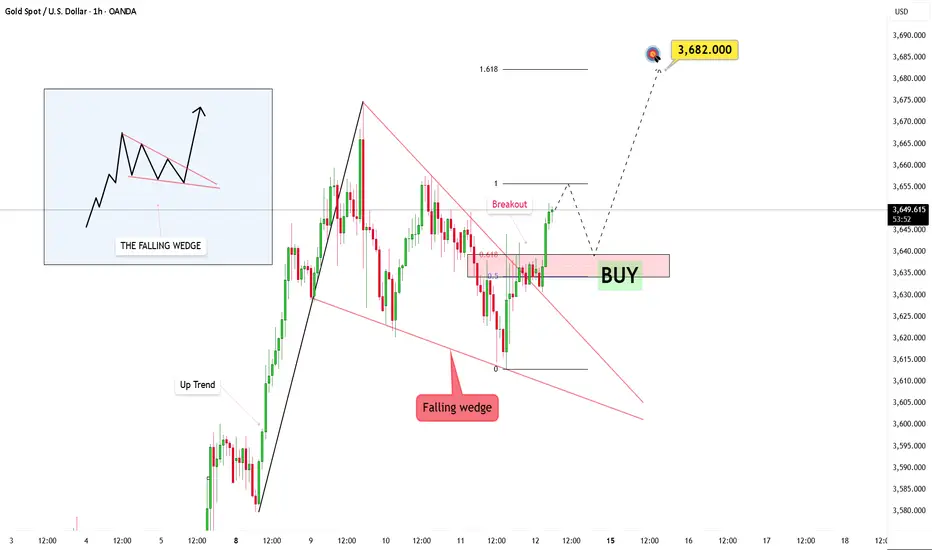
Gold Holds Steady, $3,700 in FocusOANDA:XAUUSD The price is still holding firm around $3,637/oz after the U.S. inflation report came in softer than expected. Despite a slight pullback, bullish momentum remains strong, and the falling wedge pattern is signaling a potential breakout.
From my personal perspective, the $3,700 level will be the key decision point. If it is broken with strong momentum, gold could extend its rally toward $3,725/oz or even higher. However, upcoming U.S. economic data such as PPI and jobless claims should be closely monitored as they may directly influence short-term volatility.
This is my outlook shared with the trading community. What do you think? Let’s discuss in the comments!
Breakout

Gold Analysis: Falling Wedge Breakout and Bullish ForecastOANDA:XAUUSD The market is clearly forming a falling wedge, and recent price action suggests a potential shift is on the horizon. Price has begun breaking through this downward structure, which could be the early signs of a strong bullish move.
I’m waiting for the price to retrace back to the broken trendline. This will act as a confirmation, filtering out any false moves, while a retest of the structure will solidify the validity of the breakout. From here, my target is 3682.
The key now is to watch the pullback. If the market returns to the trendline with rising volume, it will add weight to the bullish case.
This trendline breakout is more than just a signal – it’s a story in the making. It represents a shift, and with the right volume, structure, and timing, this could be the start of a larger bullish phase.
DOGUSDT: Potential Reversal at Key Level in Rising ChannelHey everyone, Ken here!
Right now, I'm closely watching DOGUSDT and it seems like it might be going through a correction phase as the price tests the lower boundary of the rising channel. This is a key level, and if the price bounces from here, I believe it could continue towards the next target around 0.3200.
However, if the price breaks below this support, the bullish outlook would weaken, and we could see further declines. That’s why I always pay close attention to price action and trading volume to identify solid buying opportunities.
Risk management is essential in trading, so I always make sure to carefully confirm setups and trade with caution. What do you think about the current situation? Feel free to share your thoughts in the comments!

CHFJPY: Trend ContinuationAfter a pullback throughout August, it seems like this pair is gaining its momentum back. Here are my observations over on different timeframes.
Daily Timeframe:
EMA20 is above EMA60, which signals there's an overall uptrend
Price also pulled back and stayed above the DTL, indicating that this breakout is successful
H1 Timeframe:
Price crosses above the DTL, which is another indication that trend confluence is resuming
EMA20 being above EMA60 and diverging is giving indications that momentum is likely picking up

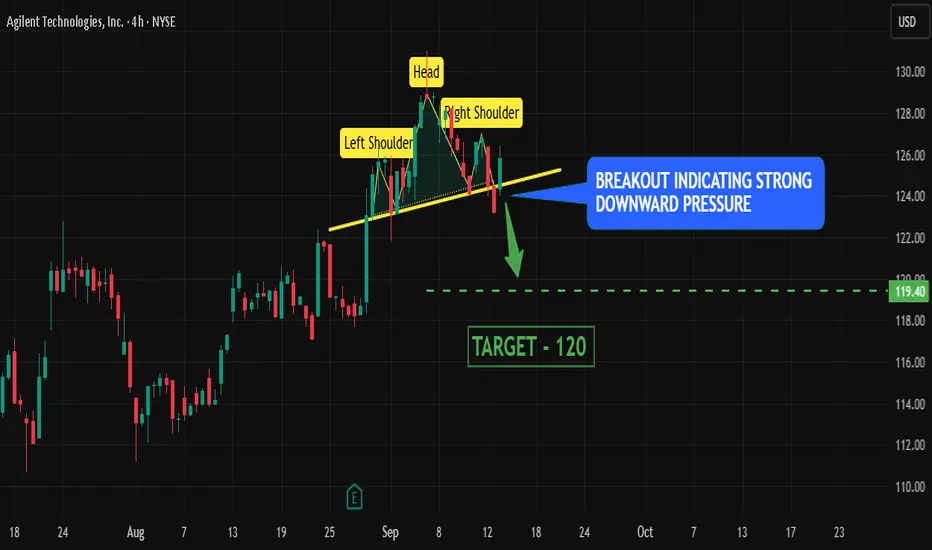
Head & Shoulder breakout in Agilent stock pointing Bearish move
HEAD AND SHOULDER BREAKOUT -
price broke out of head and shoulder pattern with a strong confirmation indicating strong downward pressure for the stock.
Definition -
(i) Left Shoulder → price rise, then fall
(ii) Head → higher rise, then fall
(iii)Right Shoulder → lower rise, then fall again
EVENING STAR CANDLESTICK -
1 large green candlestick followed by 1 doji followed by 1 large red candlestick is called evening star which indicates downward pressure for the stock
TARGET -
120 level
CADCHF: Trend ContinuationCADCHF continues to remain bearish as it holds below the key level on the daily timeframe. Here's a summary of my key observations over on the daily and intraday timeframes.
Daily Timeframe:
Price broke the key support level in early September
After some sideways price action, price is currently making a bearish bar that engulfs the prior day's doji
H1 Timeframe:
Price broke through the ATL, which shows confluence with the downtrend
EMA20 is also below EMA60, moving further apart to signal momentum is picking up
Price is also below EMA20, which signals confluence with downtrend as well

GBP-JPY Bullish Breakout! Buy!
Hello,Traders!
GBP-JPY made a strong
Bullish breakout of the
Key horizontal resistance
Level around 200.400
So we are bullish biased
And we will be expecting
A further bullish move up
Buy!
Comment and subscribe to help us grow!
Check out other forecasts below too!
Disclosure: I am part of Trade Nation's Influencer program and receive a monthly fee for using their TradingView charts in my analysis.

GBP_USD BULLISH BREAKOUT|LONG|
✅GBP_USD is going up
Now and the pair made a bullish
Breakout of the key horizontal
Level of 1.3594 and the breakout
Is confirmed so we are bullish
Biased and we will be expecting
A further bullish move up
LONG🚀
✅Like and subscribe to never miss a new idea!✅

BTCUSD: Rully Continue in Upward ChannelHello everyone, here is my breakdown of the current Bitcoin setup.
Market Analysis
From a broader perspective, we've seen a significant shift in the market structure for Bitcoin. The price has successfully broken out of a prior Downward channel, a key event that signaled a reversal and shifted control from sellers to buyers, establishing a new bullish phase.
This new bullish phase has since formed a well-defined Upward Channel. The price has been making a series of higher highs and higher lows within this structure, but is currently in a corrective pullback, heading towards the channel's ascending support line, which is a key area to watch.
My Scenario & Strategy
My scenario is based on the expectation that this newly formed Upward Channel will continue to be respected by the market. I'm looking for the price to complete its dip and test the ascending support line. A confirmed bounce from this dynamic support would be the key signal that the correction is over and the next impulsive move up is beginning.
A successful rebound would validate the long scenario, with the price then expected to rally towards the top of the channel and break the intermediate Resistance at the 116700 level. The primary target for this move is 118500.
That's the setup I'm tracking. Thank you for your attention, and always manage your risk.

IONQ — trend breakout and growth potentialIonQ shares have consolidated above the 47–50 zone and successfully broke the trendline, opening the way for further upside. The first target is set around 120, and if buying pressure continues, the price could extend toward 200. Key support levels are at 47–48 and 36, providing attractive accumulation zones.
From a fundamental perspective, the quantum computing sector is gaining momentum, and IonQ remains one of its leading players. Increasing demand for innovative technologies may support the continuation of the bullish trend in the medium term.
A stock you buy and forget — the longer you hold, the more you earn.

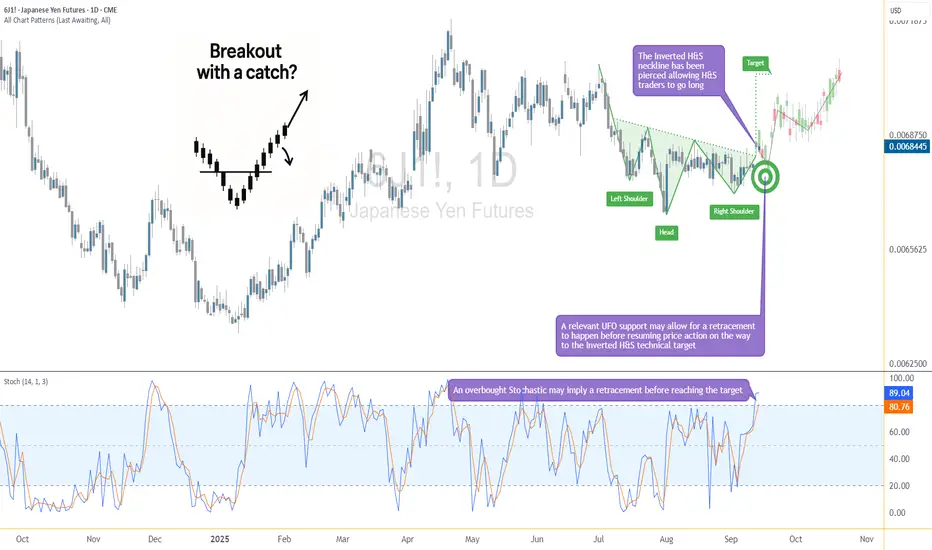
Breakout with a Catch: The Yen May Dip Before Lifting Off AgainThe Japanese Yen Futures (6J) have just pierced above a critical neckline at 0.0068220, completing an Inverted Head and Shoulders formation. This classical reversal pattern often signals a potential shift in momentum from bearish to bullish. Based on technical projections, the measured move points toward a target near 0.0070430, which lies significantly higher from current price levels.
Yet, there’s a catch. The Stochastic Oscillator has entered overbought territory, hinting that before the next upward leg develops, a retracement could occur. This makes the current setup particularly interesting, as the neckline breakout is bullish, but timing entries becomes crucial to avoid getting caught in a short-term dip.
Understanding the Inverted Head & Shoulders
The Inverted Head and Shoulders is one of the most recognized reversal patterns in technical analysis. It typically forms after a prolonged decline and suggests that bearish momentum is losing steam.
The structure consists of three parts:
Left Shoulder: the first swing low, followed by a rebound
Head: a deeper low, which marks the exhaustion of sellers
Right Shoulder: a higher low, indicating buyers are stepping in earlier
Neckline: the resistance level connecting the highs of the shoulders, acting as the trigger point
Once price pierces above the neckline, the pattern is considered complete. Traders often project the distance from the head to the neckline and extend it upward to identify a potential price objective. In this case, the neckline break projects a target near 0.0070430.
The reliability of this formation lies in its ability to signal a shift in trend sentiment. While no pattern is flawless, the inverted H&S is widely respected for its potential consistency.
The Role of Stochastic in This Setup
While the breakout above the neckline looks promising, momentum indicators suggest caution. The Stochastic Oscillator, a tool designed to measure overbought and oversold conditions, is currently flashing an overbought reading.
This does not necessarily mean that prices must reverse, but it does imply that the bullish move could pause or correct before resuming. In practical terms, traders might expect a short-term retracement as buying pressure temporarily exhausts itself.
Such pullbacks can be constructive within a broader bullish setup, especially if they occur near significant areas of support. By aligning the breakout pattern with Stochastic signals, traders can time their entries with more precision instead of chasing the market at stretched levels.
Support Zone & Safety Net
One of the strongest features of this setup is the presence of a relevant support area just below the neckline breakout level. This zone, also reinforced by a previously identified UFO support, could serve as a launching pad if prices retrace lower in the short term.
If 6J dips back toward the neckline, traders will be watching whether this level holds. A bounce from here would not only validate the breakout but also offer an attractive risk-to-reward setup. To manage downside exposure, a protective stop can be placed at 0.0067350, positioned below this key support zone.
This structure creates a layered safety net: first the neckline, then the underlying support, and finally the stop loss—offering multiple defenses against unfavorable moves before the bullish scenario invalidates.
Contract Specs & Margins (6J & MJY)
CME offers both the standard Japanese Yen Futures (6J) and the smaller-sized Micro JPY/USD Futures (MJY), giving traders flexibility depending on capital requirements and position sizing needs.
🟢 6J – Japanese Yen Futures
Contract size: ¥12,500,000
Minimum tick: 0.0000005 = $6.25
Initial margin: ≈ $3,100 (subject to CME updates)
🟢 MJY – Micro JPY/USD Futures
Contract size: ¥1,250,000 (1/10th of standard)
Minimum tick: 0.000001 = $1.25
Initial margin: ≈ $310 (subject to CME updates)
The Micro contracts replicate the price behavior of the standard Yen futures at a fraction of the size. This makes them attractive for traders who want to fine-tune risk exposure, scale in or out more precisely, or manage positions with smaller capital outlays.
Trade Plan Example
A structured trade idea can help frame the opportunity while managing risk effectively:
Direction: Long
Entry: Near 0.0068220 (neckline breakout level), or after a retracement toward support
Stop: 0.0067350 (below the support zone)
Target: 0.0070430 (measured objective from the inverted H&S)
Reward-to-Risk Calculation:
Potential reward = 0.0070430 – 0.0068220 = 0.0002210
Potential risk = 0.0068220 – 0.0067350 = 0.0000870
Approximate ratio = 2.5 : 1
This ratio is favorable, suggesting that the upside potential outweighs the defined downside exposure. Traders considering this setup may prefer to wait for a retracement toward support, which could enhance entry quality and improve the reward-to-risk profile even further.
The Importance of Risk Management
Even the most compelling technical setups require disciplined risk management. Using stop-loss orders is essential to protect capital against unexpected market swings, particularly in leveraged products like futures.
Position sizing is another key element—adjusting contract size to account size ensures that a single trade does not overexpose the portfolio. Micro contracts, such as MJY, are especially useful for traders looking to scale positions with precision.
Equally important is the principle of avoiding undefined risk. Every trade should have a clearly defined exit strategy, both for profits and losses. By knowing where to enter, where to exit, and where to cut losses, traders reduce emotional decision-making and maintain consistency.
Finally, patience plays a role. Waiting for a retracement into support rather than chasing a stretched market often improves entry quality, lowers risk, and increases the probability of success.
Conclusion
Japanese Yen Futures are showing signs of a potential trend shift as the inverted head and shoulders formation breaks above its neckline. The measured move points toward higher ground, but the overbought Stochastic warns that the path may not be in a straight line. A temporary dip into support could provide a second chance for bulls to position themselves with a favorable risk-to-reward profile.
By combining pattern recognition, momentum analysis, and precise trade planning, this setup highlights how technical structure and disciplined execution can align to create opportunity. Whether trading the standard 6J contract or the smaller MJY, the key remains the same: respect risk, trust the setup, and let the market confirm the move.
When charting futures, the data provided could be delayed. Traders working with the ticker symbols discussed in this idea may prefer to use CME Group real-time data plan on TradingView: www.tradingview.com - This consideration is particularly important for shorter-term traders, whereas it may be less critical for those focused on longer-term trading strategies.
General Disclaimer:
The trade ideas presented herein are solely for illustrative purposes forming a part of a case study intended to demonstrate key principles in risk management within the context of the specific market scenarios discussed. These ideas are not to be interpreted as investment recommendations or financial advice. They do not endorse or promote any specific trading strategies, financial products, or services. The information provided is based on data believed to be reliable; however, its accuracy or completeness cannot be guaranteed. Trading in financial markets involves risks, including the potential loss of principal. Each individual should conduct their own research and consult with professional financial advisors before making any investment decisions. The author or publisher of this content bears no responsibility for any actions taken based on the information provided or for any resultant financial or other losses.
USD/CHF - Forecast 🕰 Weekly View
Price remains under the weekly downtrend, with structure holding below new resistance at 0.84. Market continues to respect the wedge pattern, with downside pressure aiming toward 0.78–0.79 weekly demand.
📉 Daily Structure
Resistance: 0.82–0.84 supply block.
Support: 0.78–0.79 demand zone.
Price is stuck in compression — either we sweep into resistance for rejection lower, or break above wedge to shift momentum bullish.
⏱ 4H Breakdown
Price is consolidating inside a wedge formation. Overhead resistance sits at 0.80–0.805, while a clean break below wedge support opens the door toward 0.79–0.788 demand.
🔎 Outlook
Bias remains bearish while under 0.82 resistance, with potential pullback into 0.79 demand. However, a breakout above 0.82–0.84 could flip structure bullish.
Bias: Bearish pressure → mid-term bearish unless breakout above 0.82–0.84.

Ethereum Breakout – From Crash to Bull Run, History Repeats?Hello Traders!
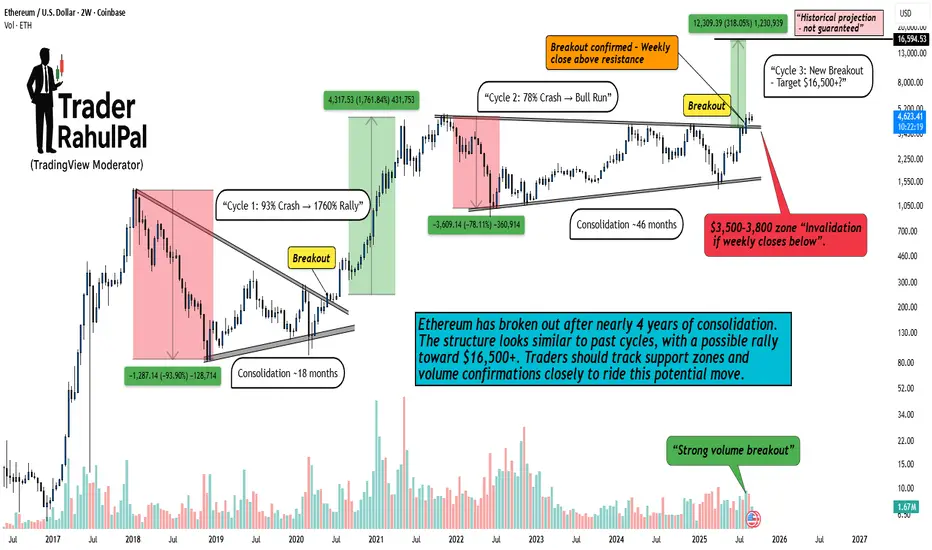
Ethereum has once again confirmed a major breakout after years of consolidation. If we study its past cycles, we can see a repeated pattern: deep crashes, long consolidation, and then explosive rallies. The current setup looks no different.
Cycle 1: 2017–2020
ETH crashed nearly 93% , shaking out weak hands.
After 18 months of consolidation , it broke out strongly.
Result → A massive 1760% bull run .
Cycle 2: 2021–2023
ETH faced another 78% crash during the bear market.
This time, consolidation lasted around 46 months .
Breakout again led to a solid bull phase.
Cycle 3: 2025 (Current)
ETH has confirmed a weekly close above resistance – signaling breakout.
Strong volume support adds conviction.
Projection suggests a move toward $16,500+ , about 318% potential upside .
But remember: invalidation if ETH closes below $3,500–3,800 .
Why This Matters
Ethereum doesn’t just move randomly – it moves in cycles . Each cycle has followed the same sequence:
Crash → Consolidation → Breakout → Bull Run
If history repeats, we may be witnessing the early stages of another explosive cycle.
Rahul’s Tip
Always respect both sides of the market. Big targets look exciting, but risk management is everything. Mark your invalidation levels, and never forget: every bull run starts with patience during consolidation .
Disclaimer: This analysis is for educational purposes only and should not be taken as financial advice. Please do your own research or consult your financial advisor before investing.
Analysis By @TraderRahulPal (TradingView Moderator) | More analysis & educational content on my profile
👉 If you found this helpful, don’t forget to like and follow for regular updates.
+151% done on Q/USDT Shared the trade for Q in the linked post earlier . It has now gained over 151% and nearing the targets
SL trailed
Easy 10 RR running right now....

EURUSD: Bounce from Triangle Support LineHello everyone, here is my breakdown of the current Euro setup.
Market Analysis
From a broader perspective, EURUSD has been in a long phase of accumulation, which has formed a large Upward Triangle. This pattern is defined by a flat horizontal resistance at the 1.1770 level and a rising support line, showing that while sellers are holding the highs, buyers are progressively becoming more aggressive on each pullback.
Currently, the price is in a corrective pullback phase within this triangle. It is now approaching the ascending support line, a key dynamic level that has consistently provided a floor for the price during this entire consolidation period.
My Scenario & Strategy
My scenario is built on the expectation that this Upward Triangle will resolve to the upside, in line with its classic technical interpretation. I'm looking for the price to complete its dip and find strong support on the triangle's support line. The key event would then be a decisive breakout above the 1.1770 Resistance.
Therefore, the strategy is to watch for this bounce as the entry trigger. A confirmed breakout above the Resistance Zone would validate the long scenario. The primary target for the subsequent expansion is 1.1820, a logical measured move objective after such a prolonged consolidation.
That's the setup I'm tracking. Thank you for your attention, and always manage your risk.

EUR_CAD WAIT FOR BREAKOUT|LONG|
✅EUR_CAD is trading in a
Strong uptrend and the pair
Has formed a range pattern
So IF we see a bullish breakout
We will be expecting a further
Bullish move up next week
LONG🚀
✅Like and subscribe to never miss a new idea!✅

Gold will bounce from support area and continue to riseHello traders, I want share with you my opinion about Bitcoin. The market context for Gold remains firmly bullish, with the price action being guided by a well-established upward channel that has defined the trend for a significant period. The structure of this channel has been confirmed by multiple rotations between its support and resistance lines, originating from the deep buyer zone near the 3390 support level. Currently, after a rejection from the channel's highs, the price of XAU is undergoing a healthy corrective phase. This pullback has brought the asset into a critical confluence of support, defined by the 3630 - 3615 support area and the ascending support line of the channel itself. The primary working hypothesis is a long scenario, which anticipates that buyers will step in to defend this key support cluster. A confirmed bounce from this area would signal the conclusion of the corrective move and the resumption of the dominant upward trend. This would likely initiate the next impulsive wave higher within the channel's structure. Therefore, the TP is logically placed at 3735 points, a target that aligns with the upper resistance line of the channel and represents a new potential structural high. Please share this idea with your friends and click Boost 🚀

USD/CAD - Forecast 13/9🕰 Weekly
Price has been holding inside a swing range with support around 1.36 – 1.37 and resistance higher near 1.46. Structure hints at a bigger bullish leg if buyers step in.
📅 Daily
Market is pressing against a descending trendline and sitting in a parallel channel. Demand is building around 1.37 – 1.38, while upside targets point toward 1.41 – 1.42 if broken.
⏱ 8H
Price recently swept liquidity below (BSL) and is now coiling under resistance. If we hold 1.37 support, the path opens for a push into 1.40 – 1.41.
🎯 Outlook
Bullish Case: Hold above 1.37 → breakout toward 1.40 – 1.42.
Bearish Case: Lose 1.37 → deeper correction back toward 1.35 demand.
⚖️ Bias : Short-term consolidation → mid-term bullish toward 1.40+.
Thanks traders and like and follow if you agree

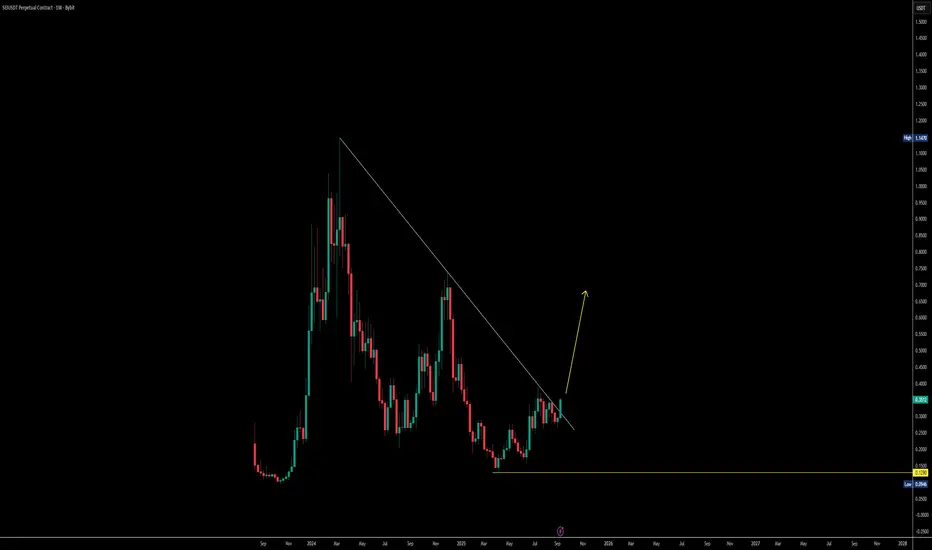
RSI + Breakout Confirm Bullish Pattern on SEIUSDT📈 SEIUSDT Weekly Breakout – Bulls in Control
If we zoom out to the weekly timeframe, SEI is doing something very important right now. The price is breaking above a major resistance zone that has been holding it back for a long time. When such a key resistance gets taken out, it often signals the start of a much bigger move.
Looking at the technicals:
RSI on weekly is pushing higher, showing strong momentum.
Structure looks clean — this isn’t just a small bounce, it’s shaping up as a true breakout pattern.
Market expectations are building for upside targets, with $0.75 as a first key level and potentially even $1.00 on the horizon if momentum continues.
Overall, this is a bullish setup where buyers are gaining control. If the breakout sustains, the upside returns could be significant in the coming weeks.
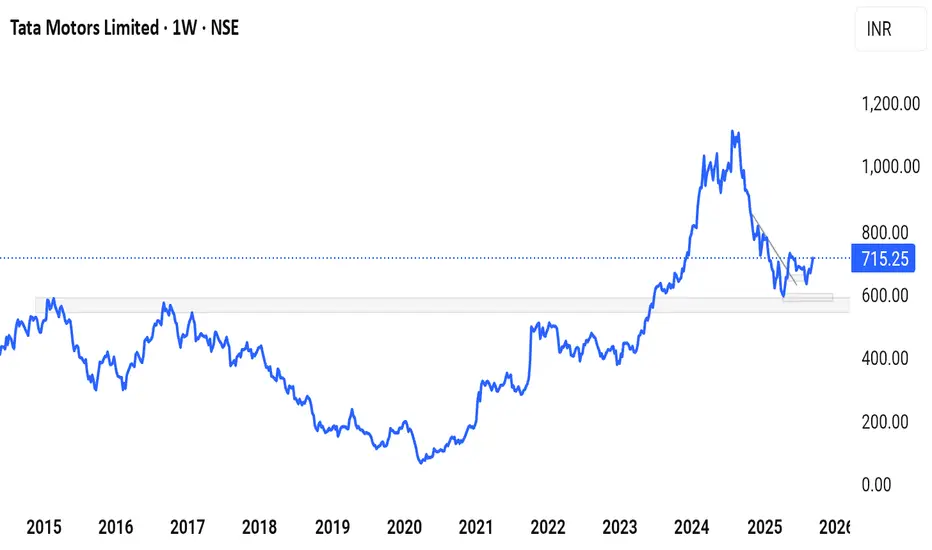
Is it ready to press buy on Tata Motors?
After Retracement from high, acting support from weekly chart
In daily chart,price breaks out from trendline while weekly support take control of it.
Waiting for patiently to grab buy opportunity when we get any forming pattern and proper risk management.
Tesla Breakout? For the majority of the calendar year TESLA has been in a range between $220 - $365 with a clear midpoint of $295.
From March to the beginning of May TESLA bounced between range low and the midpoint until finally breaking through into the upper half of the range where it has stayed ever since. However, there is a clear diagonal resistance level that is preventing higher highs.
So will TESLA breakout, or will it lose the midpoint? Structurally it is clear that the bulls have a set level they are happy to buy at (Midpoint) but the bears are getting more aggressive with their selling, hence the lower highs. This compression inevitably leads to an impulse move but the direction is not so clear.
Bullish scenario: A clean breakout with volume that makes a new higher high, signaling a shift in structure. A pullback and retest of the breakout would be an ideal opportunity to go long and aim for that range high before expecting resistance.
Bearish scenario: The lower highs keep printing until the midpoint is lost and price accepts below it, that would then signify to me the new trading range is between Range Low and Midpoint.
The fakeout scenario is a risk but with price so close to the midpoint already it follows the same invalidation criteria as the bullish scenario, the midpoint is vital to both sides.

EURUSD Short: Rejection from Channel TopHello, traders! The price auction for EURUSD has been operating within a well-defined ascending channel. This bullish structure has been confirmed by multiple pivot points, with buyers defending the ascending demand line and sellers consistently emerging at the upper supply zone near the 1.1720 level. This has established a clear rotational pattern between the channel's boundaries.
Currently, the auction is at a critical inflection point, once again testing the upper boundary of this channel. The price has rallied to meet the ascending supply line, which forms a strong confluence of resistance with the horizontal 1.1720 - 1.1740 supply area. This is the same zone where previous rallies have failed, making it a key battleground.
The primary scenario anticipates a rejection from this resistance confluence, continuing the established pattern of rotation. The expectation is that sellers will defend the supply zone, initiate a new downward move, and break the current support level. The take-profit for this rotational play is therefore set at 1.1655 points, targeting a key intermediate liquidity area. Manage your risk!

Bitcoin will reach resistance line of channel and then dropHello traders, I want share with you my opinion about Bitcoin. The current market structure for Bitcoin is defined by a well-established upward channel that was formed after the price broke out of a prior triangle consolidation. This bullish pattern has been guiding the price action of BTC higher through a clear sequence of higher highs and higher lows between its dynamic support and resistance lines. The market has just completed another full upward rotation within this structure and is now positioned at a critical inflection point. Currently, the price is directly testing the upper boundary of the channel, which forms a powerful confluence of resistance with the horizontal 113500 - 114000 seller zone. This area has historically been a strong barrier where price has reversed on previous occasions. The primary working hypothesis is a short, rotational scenario, based on the expectation that sellers will once again defend this significant resistance confluence. A confirmed rejection from this seller zone would validate the integrity of the upward channel and likely initiate a new corrective swing to the downside, which would first need to break the current support level at 113500. Therefore, the TP is logically placed at 112400 points, a target that aligns perfectly with the ascending support line of the channel. Please share this idea with your friends and click Boost 🚀
