DAX WILL GO UP|LONG|
✅DAX is going up now
And the index made a
Breakout of the key horizontal
Level of 24,100 which is
Now a support then
Made a retest and a is now
Making a rebound already so
We are bullish biased and we
Will be expecting a further
Bullish move up
LONG🚀
✅Like and subscribe to never miss a new idea!✅
Breakout

DOGE Breakout?After a 13 day rally and a 12 day pullback, could DOGE be breaking out and confirming a new 4H trading range?
After a bounce off the bullish orderblock DOGE has broken out of the diagonal downtrend, then pulled back to retest the previous diagonal resistance level as new support. This is a textbook breakout play & retest but this doesn't 100% guarantee the breakout will be successful. Should it be a successful breakout Local Resistance is the first clear level of interest for the bears to fight back.
This type of setup does give a clear invalidation should price fall back into the downtrend with acceptance. A fakeout could also lead to a loss of the Major Support level, that would introduce a potential revisit of $0.166.

GBPUSD Approaching Key Psychological Zones!Hey friends 👋
Here’s a fresh GBPUSD analysis I’ve prepared for you. I’m planning to open a **buy** position between **1.32506 – 1.32246**, aiming for a target level of **1.33298**.
Every single like you send my way is a huge source of motivation for me to keep sharing these insights. Big thanks to everyone supporting with a like 🙏

EURUSD Potential UpsidesHey Traders, in today's trading session we are monitoring EURUSD fora buying opportunity around 1.15800 zone, EURUSD is trading in an uptrend and currently is in a correction phase in which it is approaching the trend at 1.15800 support and resistance area.
Trade safe, Joe.

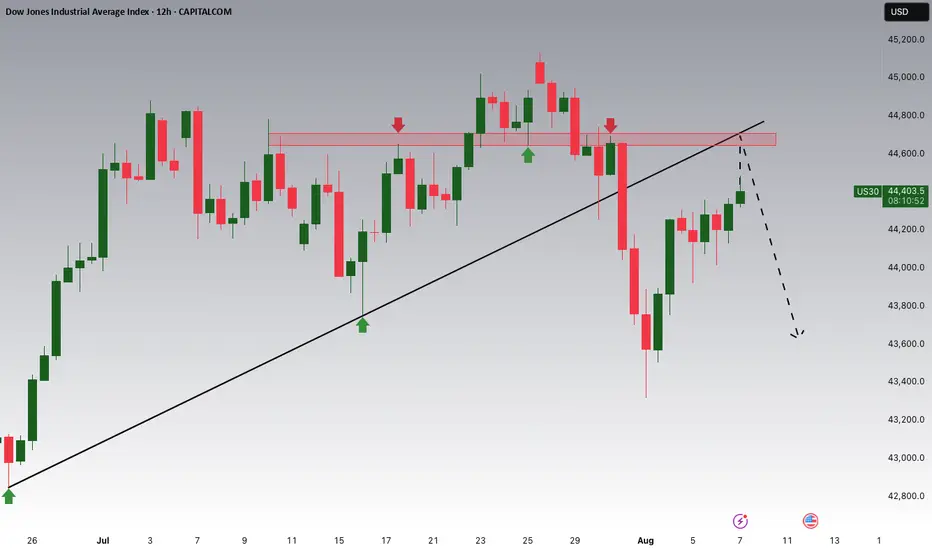
Dow Jones Breakout and Potential RetraceHey Traders, in today's trading session we are monitoring US30 for a selling opportunity around 44,650 zone, Dow Jones was trading in an uptrend and successfully managed to break it out. Currently is in a correction phase in which it is approaching the retrace area at 44,650 support and resistance area.
Trade safe, Joe.
BITCOIN Bullish Breakout! Buy!
Hello,Traders!
BITCOIN made a bullish
Breakout of the key horizontal
Level of 115,5k$ and the
Breakout is confirmed so
We are bullish biased and
We will be expecting a
Further bullish move up
Buy!
Comment and subscribe to help us grow!
Check out other forecasts below too!
Disclosure: I am part of Trade Nation's Influencer program and receive a monthly fee for using their TradingView charts in my analysis.

HFT - 100m gem primed for launch?I've been watching HFT for the last week. It's been getting solid bounces off the white descending support following a recent run.
It faked out the support during the recent dip but was able to form a channel below and has now made the first new high on the 12h as the MACD turns positive.
A test of the recent high at 0.163 would be a 100% move from here, but we could see a move much higher.
If we zoom out to the 2D chart we can see we've just formed a bullish hammer (close enough to one I think?) Supporting a shortterm move to the upside, where we would meet the descending resistance of a humongous descending wedge which will be tested for a 4th time if we get to that level. If we get a proper altszn and a break of the resistance we could see this thing quickly to around $1, 12-15X.
We can see bullish divergence in the 12h and 2d that may support that hypothesis.
Of course, if is a volatile coin. Hard dumps cannot be ruled out. Hold on to your buts.
DYOR

SILVER WILL GO UP|LONG|
✅SILVER is going up
Now and the pair made a bullish
Breakout of the key horizontal
Level of 37.73$ and the breakout
Is confirmed so we are bullish
Biased and we will be expecting
A further bullish move up
LONG🚀
✅Like and subscribe to never miss a new idea!✅

NZD-CAD Bullish Flag Breakout! Buy!
Hello,Traders!
NZD-CAD made a bullish
Breakout from the bullish
Flag pattern and the breakout
Is confirmed so we are
Bullish biased and we will
Be expecting a further
Bullish move up
Buy!
Comment and subscribe to help us grow!
Check out other forecasts below too!
Disclosure: I am part of Trade Nation's Influencer program and receive a monthly fee for using their TradingView charts in my analysis.

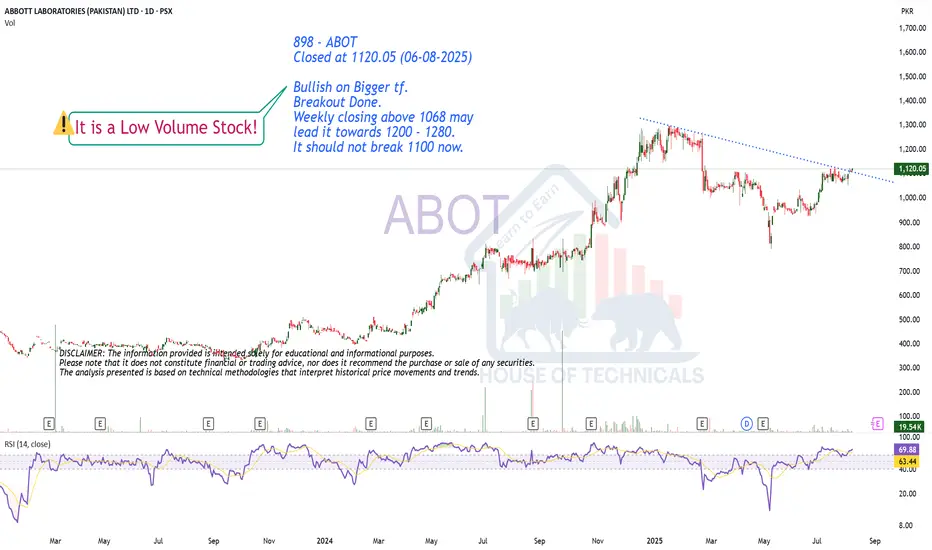
Breakout!898 - ABOT
Closed at 1120.05 (06-08-2025)
Bullish on Bigger tf.
Breakout Done.
Weekly closing above 1068 may
lead it towards 1200 - 1280.
It should not break 1100 now.
Gold Poised to Rise on Looming Russia Sanctions!!Hey Traders, above is a breakdown of the current technical and fundamental setup for Gold, with a focus on key support zones and the macro landscape that could drive further upside.
From a technical standpoint, the first major support area to watch is around 3,334, which previously acted as a strong resistance level. Now that price has broken above it, we could see this zone retested as a support — a classic breakout-retest scenario that may offer a potential bounce opportunity.
The second key zone is located near 3,311, a historically significant support/resistance level. What makes this level even more critical is its confluence with the primary ascending trendline, reinforcing its importance as a structural support in case of a deeper retracement.
On the fundamental side, gold continues to benefit from its role as a safe-haven asset, especially amid rising geopolitical and economic tensions. There are two major catalysts in play right now:
Escalating trade tensions, particularly around new tariffs. Markets are pricing in a high baseline tariff risk of 15%, which adds a layer of uncertainty and supports defensive assets like gold.
Mounting geopolitical pressure on Russia, with the U.S. expected to announce secondary sanctions this week. These could further disrupt global markets and drive demand for hard assets.
In summary, gold is positioned well both technically and fundamentally. If price holds above the mentioned support zones, we could see renewed bullish momentum in the sessions ahead. Keep an eye on developments related to trade policy and sanctions, they could be key drivers of the next move.

EUR-USD Bullish Breakout! Buy!
Hello,Traders!
EUR-USD is going up now
And the pair made a bullish
Breakout of the key horizontal
Level of 1.1593 and the breakout
Is confirmed so we are bullish
Biased and we will be
Expecting a further
Bullish move up
Buy!
Comment and subscribe to help us grow!
Check out other forecasts below too!
Disclosure: I am part of Trade Nation's Influencer program and receive a monthly fee for using their TradingView charts in my analysis.

USDJPY Breakout and Potential RetraceHey Traders, in today's trading session we are monitoring USDJPY for a selling opportunity around 148.300 zone, USDJPY was trading in an uptrend and successfully managed to break it out. Currently is in a correction phase in which it is approaching the retrace area at 148.300 support and resistance area.
Trade safe, Joe.

Near BreakoutBFBIO Analysis
CMP 164.75 (05-08-2025 03:24PM)
Near Breakout. However, important to
Cross & Sustain 170 for further upside.
It has the potential to touch atleast 190 - 200
initially.
In worst case, 146 - 165 is the Support Zone.

GBP_NZD BULLISH BREAKOUT|LONG|
✅GBP_NZD broke the key structure level of 2.2500
While trading in an local downtrend
Which makes me bearish
And I think that after the retest of the broken level is complete
A rebound and bearish continuation will follow
SHORT🔥
✅Like and subscribe to never miss a new idea!✅

AUDUSD Breakout and Potential RetraceHey Traders, in today's trading session we are monitoring AUDUSD for a buying opportunity around 0.64700 zone, AUDUSD was trading in a downtrend and successfully managed to break it out. Currently is in a correction phase in which it is approaching the retrace area at 0.64700 support and resistance zone.
Trade safe, Joe.

Bikaji Food Triangular Pattern, Long, 1DBikaji Food is following a triangular pattern. If it breaks the level of 780 with Bullish candlestick patterns like Bullish Engulfing, Hammer & Inverted Hammer, Piercing Line, Morning Star, Three White Soldiers, Tweezer Bottoms or Bullish Harami, then take a long trade on this stock with first target of 815 and second target of 851.
Entry: 780 (on Bullish candlestick pattern)
Target1: 815
Target2: 851

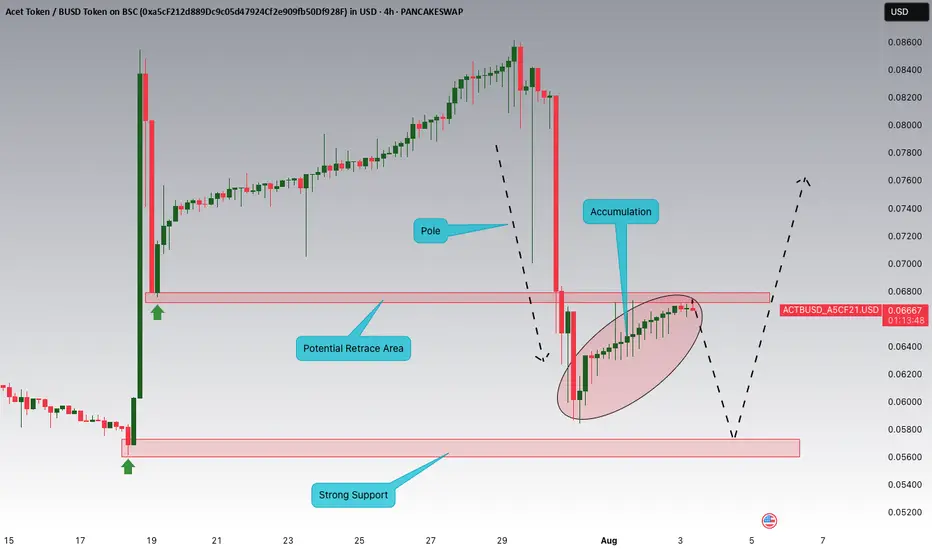
ACTBUSD Breakout and Potential RetraceHey Traders, above is a technical overview on ACTBUSD and the most important zones to watch.
Monthly Breakout.PPL Analysis
Closed at 181.78 (01-08-2025)
Monthly Breakout.
Extremely Bullish; potential to touch 240+
However, it should not break 128 now.
174 - 175 & then 165 - 167 seems to be a
Good Support level.

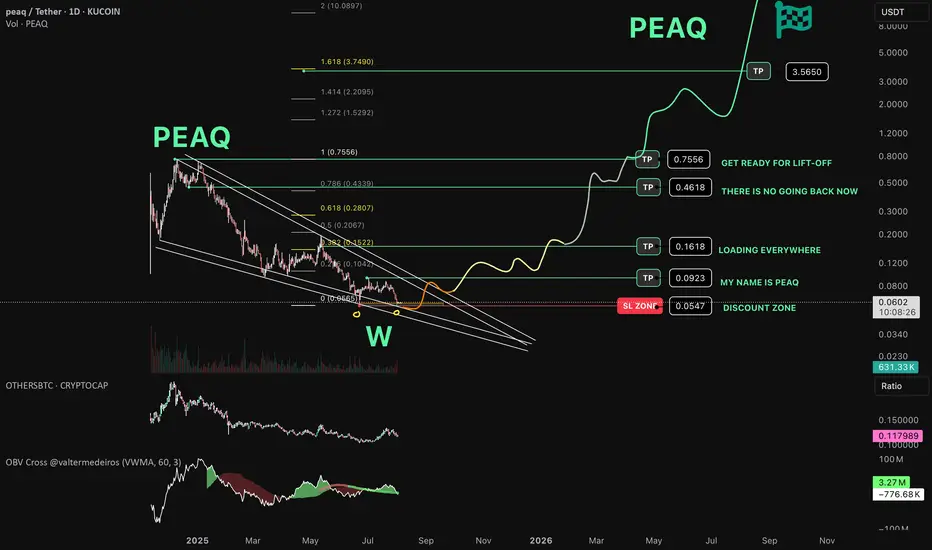
PEAQ Network about to make another pea(q) ? Bottom can be IN!
// ==================================
// ====THE===========================
// ========MACHINE=============^^====
// ===============NEEDS===TALK=======
// ====================TO============
// ==================================
Is this the time?
Chart Recap
🔍 Pattern:
Price formed a falling wedge pattern, which typically signals a potential bullish reversal.
A large W-shaped double bottom pattern is highlighted at the wedge's base, adding strength to the bullish thesis. Can this be the awaited bottom?
🟢 Accumulation & Support Zone :
"DISCOUNT ZONE" is marked near $0.0547, aligned with the wedge support.
Repeated touches at this level suggest strong buyer interest — also called "MY NAME IS PEAQ" and "LOADING EVERYWHERE"
🚀 Bullish Scenario & Targets:
If the wedge breakout plays out:
TP1: $0.0923 – early target near the local range high.
TP2: $0.1618 – aligns with the 0.382 Fib level.
Labeled as “LOADING EVERYWHERE”
TP3: $0.4618 – near the 0.618 retracement.
“THERE IS NO GOING BACK NOW”
TP4: $0.7556 – previous swing high.
“GET READY FOR LIFT-OFF”
TP5: $3.5650 – long-term Fib extension target (1.618).
Ultimate moonshot-level target.
CAD_JPY BEARISH BREKAOUT|SHORT|
✅CAD_JPY broke the key structure level of 107.400
While trading in an local downtrend
Which makes me bearish
And I think that after the retest of the broken level is complete
A rebound and bearish continuation will follow
SHORT🔥
✅Like and subscribe to never miss a new idea!✅
Disclosure: I am part of Trade Nation's Influencer program and receive a monthly fee for using their TradingView charts in my analysis.

EUR-AUD Bullish Breakout! Buy!
Hello,Traders!
EUR-AUD made a bullish
Breakout of the falling resistance
And the breakout is confirmed
So we are bullish biased
And we will be expecting
A further bullish move up
On Monday!
Buy!
Comment and subscribe to help us grow!
Check out other forecasts below too!
Disclosure: I am part of Trade Nation's Influencer program and receive a monthly fee for using their TradingView charts in my analysis.

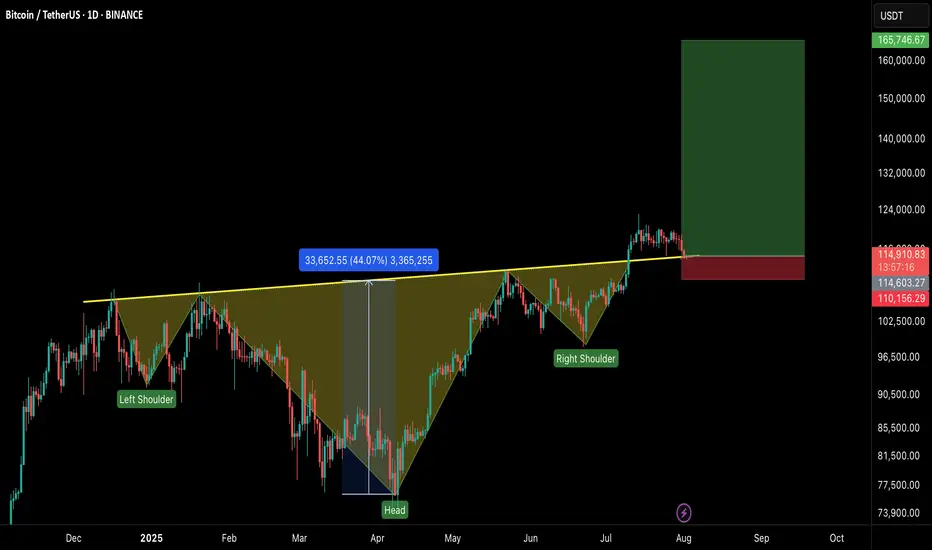
#BTCUSDT – Healthy Correction, Not the End!Bitcoin is currently experiencing a healthy pullback after an impressive run, testing the neckline of the Inverse Head & Shoulders breakout on the 1D timeframe.
🔹 Current Market View:
BTC is retesting the neckline of the IHS pattern, which now acts as a strong support zone.
Price is holding near $113K–$115K, which is crucial for maintaining bullish momentum.
This dip is a healthy correction, flushing out over-leveraged positions and preparing for the next leg up.
🔹 Key Levels:
Support Zone: $113,000 – $115,000
Immediate Resistance: $120,000 – $122,500
Breakout Target: $165,000+ on the next bullish wave
🔹 Market Sentiment:
Holding above the neckline keeps the bullish structure intact.
If the support holds, we can expect continuation to new highs once buying pressure returns.
A daily close below $112K would signal caution and delay the next rally.
💡 Tip: Don’t panic on these red candles. Healthy corrections are part of a sustainable uptrend.