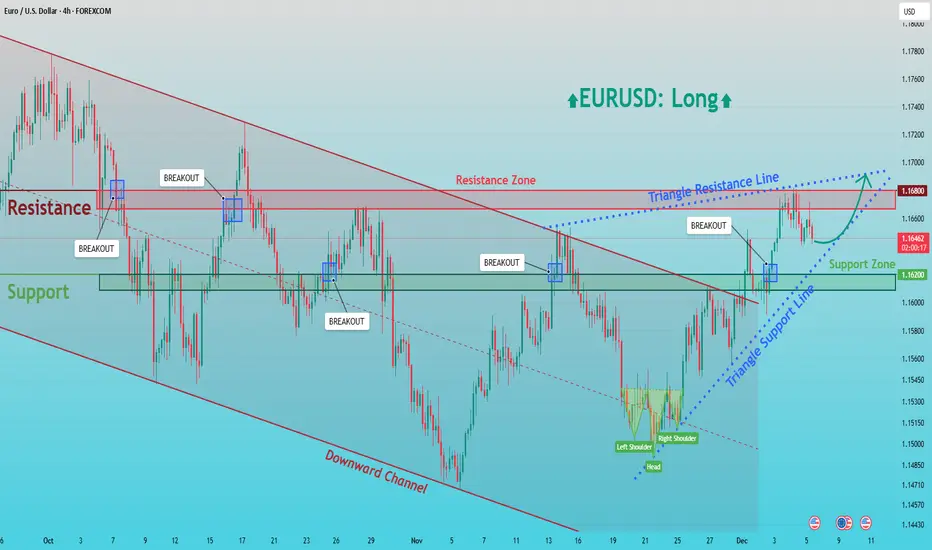
EURUSD: Price Holds Channel Support, Aiming for 1.1680Hello everyone, here is my breakdown of the current EURUSD setup.
Market Analysis
EURUSD remains in a broader bullish structure, with recent price action developing inside a well-defined ascending channel. After a strong impulsive rally, the pair broke above the previous consolidation zone and confirmed the breakout with a successful retest of the 1.16100 support zone, which now acts as a key demand area. The market then continued higher, forming higher highs and higher lows along the channel structure.
Currently, price is consolidating below the 1.16800 resistance zone, which represents a major supply area and the upper boundary of the current bullish leg. Despite short-term consolidation, buyers continue to defend the support zone, keeping bullish pressure intact.
My Scenario & Strategy
My scenario remains bullish as long as EURUSD holds above the 1.16100–1.16200 support zone and respects the ascending channel structure. I expect the price to continue pressing toward the 1.16800 resistance, which is the next major target for buyers. A clean and sustained breakout above this resistance would open the way for further upside continuation and new highs.
However, if price fails to break the resistance and shows strong rejection, a short-term pullback toward the mid-channel or back into the support zone is possible. Still, the overall bullish structure remains valid as long as the lower channel boundary holds. For now, the market supports a long bias, with the main objective being a retest of the 1.16800 resistance zone.
That's the setup I'm tracking. Thank you for your attention, and always manage your risk.
Breakout

EURUSD Outlook Ahead of the New WeekQuick Summary
EURUSD is showing strong bullish intent heading into the new week as all downside levels have already been tested. With no clear reason for deeper correction, price is expected to continue upward, targeting the break of the descending trendline and the liquidity resting above it. A clearer entry setup will likely form during the London session, but the zone around 1.15852 can be considered as a potential buy area.
Full Analysis
The EURUSD is preparing for a bullish continuation as the new week opens. The structure shows no meaningful catalysts for further downside movement. All previously relevant levels beneath current price have already been tapped, meaning liquidity to the downside has been consumed. This removes incentive for the market to seek lower prices and instead shifts the focus toward the areas above.
With this context, EURUSD is likely aiming to push upward toward the descending trendline that has been guiding price action over recent sessions. Breaking this trendline and reaching for the liquidity positioned above it appears to be the next logical target for the market.
The cleanest entry signal is expected during the London session when volatility and direction become more defined. However, you can also keep an eye on the 1.15852 level as a potential early buy zone. If the market forms a strong reaction from this area, it could provide a solid opportunity to position for the anticipated upside move

EURUSD Bearish Outlook After Trendline BreakQuick Summary
After breaking the ascending trendline, EURUSD is expected to continue moving lower. The market may target the previous two lows to collect liquidity, and there is currently no clear buy signal.
Full Analysis
The recent break of the ascending trendline on EURUSD changes the short term outlook and suggests that the market is preparing for a deeper move to the downside. This break indicates weakness in the previous bullish structure and opens the door for the pair to target lower liquidity levels.
Price is likely to continue its decline to sweep at least the last two lows. Whether the intention is to continue the broader downtrend or simply create a deeper correction before moving higher, the immediate expectation remains bearish.
At the moment, there is no strong buy signal. The market has not shown any clear rejection or shift in structure that would support a bullish entry. Until price reaches a meaningful demand zone and shows a convincing reaction, buying would carry unnecessary risk.

BTCUSDT Long: Demand Line Holds — Path Toward 96,500 Opens UpHello, traders! BTCUSDT is respecting the Triangle Demand Line after completing a full bearish cycle inside the descending channel earlier. Sellers maintained control for an extended period, pushing price steadily lower until it reached the pivot point near 88,800, where buyers finally stepped in and broke the bearish structure. This pivot zone became the foundation for a new bullish sequence, with price forming higher lows along the Triangle Demand Line. After the breakout from the descending channel, BTCUSDT entered a consolidation Range, where multiple fake breakouts occurred on both sides. This range acted as a transition phase before buyers regained momentum. Following the range, price made another bullish attempt, but faced resistance near the 96,500 Supply Zone — an area where sellers have shown strong activity in the past.
Currently, BTCUSDT is moving toward the Triangle Demand Line once again, retesting it as support. As long as buyers defend this trendline and price remains above the Demand Zone at 88,800, the bullish structure stays intact.
My scenario: if the trendline holds, BTCUSDT may bounce and continue moving toward the 96,500 resistance, which remains the main upside target for the current bullish leg. A clean breakout above 96,500 would open the path for stronger continuation. However, if price fails to hold the demand line, a corrective pullback toward the lower demand region becomes possible. For now, the market structure remains bullish while price respects the Triangle Demand Line. Manage your risk!

XAUUSD: Buying Pressure Aims for the $4,260 ResistanceHello everyone, here is my breakdown of the current Gold (XAUUSD) setup.
Market Analysis
Gold continues to trade within a broader bullish structure, with price action developing inside a well-defined ascending channel. After the previous impulse move higher, the market entered a consolidation phase below the $4,260 Resistance Zone, where sellers repeatedly defended the level. Earlier, XAUUSD produced a breakout from the upward channel structure and formed a temporary base above the mid-support area near $4,200, confirming that buyers still control the broader trend.
Currently, price is holding above the Triangle Support Line, showing that demand remains active on dips. The recent pullback into the $4,200–$4,190 support area looks corrective rather than impulsive, suggesting that bearish pressure remains limited for now. As long as price stays above this triangle support, the bullish market structure remains valid.
My Scenario & Strategy
My scenario is bullish while XAUUSD holds above the $4,200 Support Zone and respects the Triangle Support Line. I expect price to stabilize in this area and attempt a renewed push toward the $4,260 Resistance Zone, which is the key barrier for continuation.
Therefore, a clean breakout above $4,260 would confirm bullish continuation and open the door for further upside expansion toward higher historical levels. However, if price fails to hold the triangle support and breaks below $4,190–$4,180, this would weaken the bullish structure and could trigger a deeper corrective pullback toward the lower channel boundary. For now, the market maintains a long bias, with the main objective being a renewed test and potential breakout of the $4,260 resistance zone.
That’s the setup I’m tracking. Thank you for your attention, and always manage your risk.

BTCUSD Buyers Defend Support — Market Targets $91,5K — $93K ZoneHello traders! Here’s my technical outlook on BTC/USD based on the current market structure. After a strong bullish recovery from the lower demand area near $83,500–$85,000, the price formed a steady impulsive move upward and entered a consolidation phase inside the marked range below the key $93,000 resistance level. Multiple breakout attempts from the range were followed by corrective pullbacks, showing active participation from both buyers and sellers. Once BTC broke above the range, the price initiated another bullish leg but quickly transitioned into a symmetrical triangle structure, defined by the descending Triangle Resistance Line and the rising Triangle Support Line. Currently, BTC is compressing inside this triangle while holding above the critical $89,500 Support Level, which is acting as the main short-term demand zone. Buyers continue to defend this area, keeping the bullish bias technically valid. The price is now approaching the upper triangle resistance again, hinting at a possible volatility expansion. As long as BTC remains above $89,500, the bullish scenario stays in play. I expect a breakout from the triangle toward TP1 at $91,500, followed by a potential continuation toward TP2 at $93,000, which is the major resistance zone. However, a breakdown below the triangle support would invalidate the setup and may trigger a deeper corrective move. For now, the market remains in a compression phase, preparing for its next directional impulse. Please share this idea with your friends and click Boost 🚀

EURUSD Rising Channel Intact as Price Targets 1.16800 ResistanceHello traders! Here’s my technical outlook on EUR/USD based on the current market structure. After an earlier breakout from the lower consolidation area, the price entered a steady ascending channel, forming a sequence of higher highs and higher lows while respecting the rising Support Line. The previous bullish impulse was followed by a corrective phase, where EURUSD consolidated inside the marked range, allowing the market to release pressure before continuing higher. After the range breakout, the pair resumed its upward movement and is now trading inside a new rising price channel. At the moment, price is holding above the 1.16400 support level, which is acting as a key demand area and the lower boundary of the current ascending structure. Buyers continue to defend this zone, keeping the short-term bullish bias intact. The market is now pressing toward the major 1.16800 resistance level, which aligns with the upper channel boundary and serves as the next critical obstacle for the bulls. As long as EURUSD remains above the 1.16400 support, the bullish scenario stays valid. I expect a continuation toward the TP1 target at 1.16800, where strong seller reaction is likely. A clean breakout above this resistance could open the door for further upside continuation. However, a failure to hold the current support may lead to a deeper pullback toward the lower channel area. For now, the structure favors buyers, with resistance at 1.16800–1.17000 as the main upside objective. Please share this idea with your friends and click Boost 🚀

Neckline Breaks and Trader Nerves: A Quick Guide to Bearish H&S The head and shoulders pattern is like the market’s way of clearing its throat and saying, “Things might be changing up here.” Once that neckline snaps, traders often sit up straighter — not because something magical happened, but because the chart finally drew a clean line between “maybe” and “now it matters.”
In this ZS (Soybean Futures) example, price slipped under the neckline and started wandering toward lower ground. Traders who work with this pattern usually focus on three things:
A possible bounce back toward the neckline (because markets love second chances),
A clear invalidation level (in this case, above 1136),
A logical downside objective such as the gap-and-support combo near 1070'4.
That simple trio turns a chaotic chart into a calm plan.
Contract specs matter too. The ZS contract moves in bigger bites:
Tick: 1/4 of one cent (0.0025) per bushel = $12.50 per contract
Margin: $2,000 per contract
The MZS (Micro Soybean Futures) contract takes smaller ones:
Tick: 0.0050 per bushel = $2.50 per contract
Margin: $200 per contract
Traders who want more precision sometimes choose the micro so their stop-loss distance and account size stay on speaking terms. Either way, the chart sets the idea, but the contract size sets the comfort level.
And of course, the golden rule in pattern-based trading: the market can still do whatever it wants. That’s why traders define their exit if wrong, their objective if right, and their size before clicking anything. A head and shoulders isn't about predicting — it's about organizing.
The chart example ties it all together: neckline break, resistance overhead, downside target below. Simple, structured, and practical — just the way traders like it.
Want More Depth?
If you’d like to go deeper into the building blocks of trading, check out our From Mystery to Mastery trilogy, three cornerstone articles that complement this one:
🔗 From Mystery to Mastery: Trading Essentials
🔗 From Mystery to Mastery: Futures Explained
🔗 From Mystery to Mastery: Options Explained
When charting futures, the data provided could be delayed. Traders working with the ticker symbols discussed in this idea may prefer to use CME Group real-time data plan on TradingView: www.tradingview.com - This consideration is particularly important for shorter-term traders, whereas it may be less critical for those focused on longer-term trading strategies.
General Disclaimer:
The trade ideas presented herein are solely for illustrative purposes forming a part of a case study intended to demonstrate key principles in risk management within the context of the specific market scenarios discussed. These ideas are not to be interpreted as investment recommendations or financial advice. They do not endorse or promote any specific trading strategies, financial products, or services. The information provided is based on data believed to be reliable; however, its accuracy or completeness cannot be guaranteed. Trading in financial markets involves risks, including the potential loss of principal. Each individual should conduct their own research and consult with professional financial advisors before making any investment decisions. The author or publisher of this content bears no responsibility for any actions taken based on the information provided or for any resultant financial or other losses.

NZDCHF CHANNEL BREAKOUT|SHORT|
✅NZDCHF has broken down out of the rising channel after running buy-side liquidity at the highs, showing clear ICT displacement and a shift in order-flow toward discount levels. Price is now drawing toward the next sell-side pocket near the target zone. Time Frame 2H.
SHORT🔥
✅Like and subscribe to never miss a new idea!✅

EUR-CAD Bearish Bias! Sell!
Hello,Traders!
EURCAD has broken decisively below the horizontal supply area after sweeping buy-side liquidity and distributing at premium, forming an SMC breakout structure that favors continuation lower toward the next discount target. Time Frame 10H.
Sell!
Comment and subscribe to help us grow!
Check out other forecasts below too!
Disclosure: I am part of Trade Nation's Influencer program and receive a monthly fee for using their TradingView charts in my analysis.

ADAUSDT the 0.6$ soon will hit againAs observed on the chart, ADA has executed a decisive breakout above a major resistance zone, confirmed by a strong bullish candle accompanied by significantly high trading volume. This combination of price action and volume indicates substantial buying pressure and validates the breakout's strength. Consequently, the technical structure now supports a continuation of the upward momentum, with the next primary target projected at the $0.60 level.
DISCLAIMER: ((trade based on your own decision))
<<press like👍 if you enjoy💚

EURUSD Short: Supply Holds — Pullback to 1.1610 in FocusHello, traders! The price action on EURUSD is unfolding within a well-defined technical structure shaped by an ascending Trend Line, with the market transitioning from consolidation into a corrective pullback. After a prolonged bullish advance, the pair formed a Head and Shoulders pattern near the upper Supply Zone around 1.16660, signaling exhaustion of buying momentum. Following this distribution phase, price broke below the neckline and started moving lower, showing a clear shift in short-term control toward sellers.
Currently, EURUSD spent time consolidating inside the highlighted Range, where multiple false breakouts occurred before bullish continuation resumed. However, the recent rejection from supply and the breakdown from the pattern suggest that upside momentum is weakening. Currently, the price is trading below the former range support and is approaching the Demand Zone near 1.16100, which also aligns with a key horizontal support level.
My scenario for the next move is a continuation toward the 1.16100 demand area, where buyers may attempt to slow the decline. A strong bullish reaction from this zone could trigger a corrective rebound back toward the broken structure. However, if the price fails to hold this demand, the bearish pressure may intensify and open the door for a deeper pullback. As long as the market remains below the 1.16660 supply, the short-term bias stays bearish. Manage your risk!

XAUUSD Bullish Trend in Play — Path Open Toward 4,300 TargetHello traders! Here’s my technical outlook on XAU/USD (Gold) based on the current market structure. Gold remains in a broader bullish trend, supported by a clearly defined rising Trend Line that has guided price action since the beginning of the impulsive move. After the initial breakout from the Support Level, the market formed a well-structured range, followed by a corrective pullback and another consolidation phase, confirming healthy bullish rotation. Price is currently trading above the key Support Level near 4,140, while attempting to stabilize above the rising Support Line, which keeps buyers in control of the short-term structure. The recent breakout from the second range indicates renewed bullish momentum, with price now approaching the major Resistance Level around 4,260–4,270. As long as Gold holds above the support zone and respects the ascending trendline, the bullish scenario remains valid. The structure suggests continued pressure toward the upside, with TP1 positioned near 4,300, which aligns with the next key resistance area. A clean breakout above this level could open the door for further trend continuation and higher upside targets. However, a failure to hold the Support Line could lead to a deeper pullback toward the lower support zone. For now, the technical structure favors the buyers, with bulls aiming for a retest and breakout of the 4,260–4,300 resistance zone. Please share this idea with your friends and click Boost 🚀

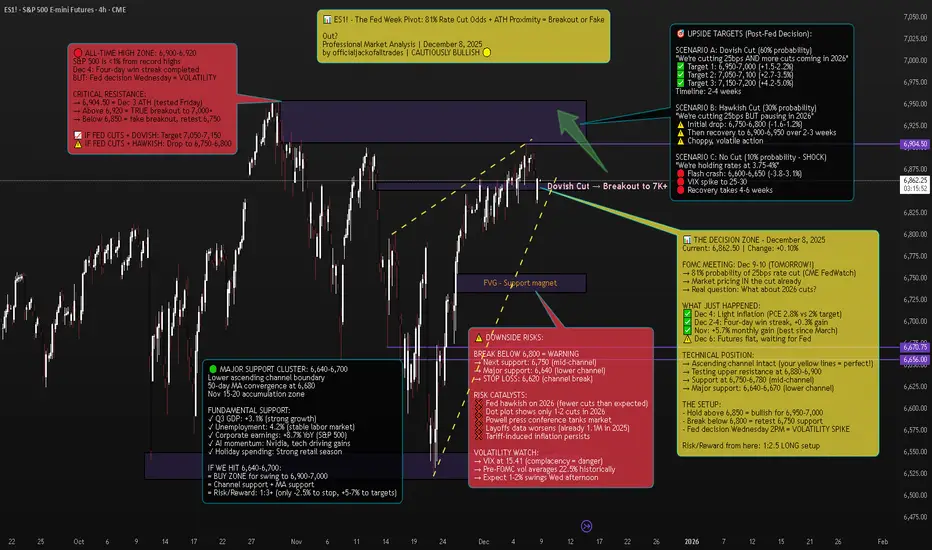
ES1! S&P 500 E-mini Futures - The Fed Week Pivot📈 Executive Summary - The Setup
Current Price: 6,862.50 | Date: December 8, 2025 | Change: +6.75 (+0.10%)
The S&P 500 E-mini futures are sitting less than 1% from all-time highs on the eve of the Federal Reserve's most anticipated meeting of 2025. After a four-day win streak that added 0.3% to the index, markets are now in a classic consolidation pattern at resistance, waiting for Wednesday's 2PM ET catalyst.
The Technical Picture:
Pattern: Ascending channel (intact since November)
Current Position: Testing upper resistance at 6,880-6,900
ATH: 6,904.50 (December 3) - 0.6% away
Support: 6,750-6,780 (mid-channel), 6,640-6,670 (lower channel)
The Fundamental Backdrop:
FedWatch shows a near-90% probability the FOMC will cut the target range for the federal funds rate by another 25 basis points. But here's what markets are REALLY pricing: not just the cut itself (that's a given), but Powell's guidance on 2026.
Minutes from the October meeting showed "many" FOMC members saying no more cuts are needed at least in 2025. Yet the market now indicates an 80% likelihood of a December rate cut, following dovish statements from NY Fed President John Williams and Fed Governor Christopher Waller.
The Trade: This is a tactical long from 6,850-6,870 targeting 6,950-7,050, with stop at 6,820. Risk/reward: 1:2.5.
But the real opportunity? Buying any Fed-induced dip to 6,750-6,800 for a swing to 7,000+.
🔎 Market Context - What's REALLY Happening
The Pre-Fed Calm
US stock futures stall as traders wait for the Fed meeting, with the S&P 500 just below record highs. This is textbook behavior: The indexes have quietly stitched together consistent gains. The Dow and Nasdaq scored back-to-back positive weeks; the S&P 500 added another 0.3% and now sits only a touch from record territory.
S&P 500 futures (ES) traded around 6,880-6,885, roughly 0.1% higher by 6:00-7:30 a.m. ET on Monday.
But don't mistake the calm for weakness. Even after November's wobble, dip-buyers came back as shutdown fears faded and AI jitters cooled.
The Fed's Dilemma
The Federal Reserve is in an impossible position:
Argument FOR cutting:
Concerns about a softening labor market
Employers cut more than 1.1 million jobs through November, the most since 2020 and a 54% increase from the same period a year ago
Job growth remains too low to keep up with labor supply growth and a rising unemployment rate
Argument AGAINST cutting:
Latest inflation scorecard, the Fed's preferred PCE index, is running at 2.8 percent a year, close to its 2 percent goal but not quite there
The annualized inflation rate grew to 3% in September from 2.9% in August and 2.7% in July
Officials expressing skepticism about the need for an additional cut that markets had been widely anticipating, with "many" saying that no more cuts are needed at least in 2025
The Missing Data Problem:
Here's something CRITICAL that most traders don't know: The U.S. central bank will have to make its decision without some key government data. Hiring data for November and the latest inflation number have been delayed until mid-December, after the Fed's meeting, because of the U.S. government shutdown.
The meeting minutes indicated the decision-making was complicated by a lack of government data during the 44-day federal government shutdown. Powell himself compared this to "driving in the fog".
Translation: The Fed is making a $28 TRILLION (SPY market cap) decision BLIND.
The Internal FOMC War
"It's difficult to recall a time when the Federal Open Market Committee has been so evenly divided about the need for additional rate cuts than the upcoming December meeting," Michael Pearce, chief U.S. economist at Oxford Economics, said.
Jerome Powell faces a credibility issue as he tries to satisfy hawks and doves on the most divided Fed in recent memory.
The October meeting vote was 10-2, but the 10-2 vote was not indicative of how split officials were at an institution not generally known for dissent. The minutes revealed multiple camps:
Some favored cutting
Some supported cutting but could have supported holding
Several were against cutting
For December, Mericle expects at least two dissents in favor of no rate cut as well as one in favor of a larger rate cut.
📊 Technical Analysis - The Ascending Channel At Decision Point
The Pattern: Ascending Channel (Bullish Structure)
Your chart annotation is PERFECT. The yellow dashed ascending channel captures the exact structure driving ES1! since the November bottom.
Channel Characteristics:
Lower Support: 6,640 (tested Nov 15, Nov 29) → 6,670 (current)
Upper Resistance: 6,850 (Nov 25) → 6,900 (Dec 3-6) → 6,920 (projected)
Angle: ~25° (strong bull trend)
Tests: 6 touches (3 upper, 3 lower) = highly reliable pattern
Current Position: We're at the UPPER boundary of the channel, testing 6,880-6,900 resistance.
Key Technical Levels:
🔴 RESISTANCE (Selling pressure zones):
6,880-6,900: Current test, upper channel boundary
6,904.50: All-time high from December 3
6,920-6,950: True breakout zone (if we clear ATH)
7,000: Psychological milestone
🟢 SUPPORT (Buying interest zones):
6,850: Immediate support, bull/bear line
6,800-6,820: Minor support cluster + FVG
6,750-6,780: Mid-channel support + 23.6% Fib
6,700-6,720: 38.2% Fib retracement
6,640-6,670: Major support (lower channel + 50-day MA + November accumulation)
Technical Indicators:
Moving Averages:
50-day MA: ~6,680 (rising, bullish)
200-day MA: ~6,450 (rising, bullish)
Golden Cross: Active since mid-November = long-term bullish
RSI (Relative Strength Index):
Current: 58-60 (neutral/slightly bullish)
Not overbought (room to run to 70+)
Not oversold (not panic selling)
Interpretation: Healthy consolidation before next leg
Volume Analysis:
Declining volume into Fed decision = normal pre-FOMC behavior
Stock volatility averages around 22.5% in the month preceding rate cuts, compared with roughly 15% during normal periods
Expect volume spike Wednesday 2PM-4PM (100K+ contracts)
VIX (Fear Index):
VIX at 15.41, down -0.37 (-2.34%)
This is LOW = market complacency
Pre-FOMC, VIX typically rises to 18-22
IF VIX spikes to 20+ Wednesday = sell signal
🎯 Scenario Analysis - Three Possible Outcomes
SCENARIO A: Dovish Cut (60% Probability) - BULLISH
What Happens:
Fed cuts 25bps to 3.50-3.75% range ✓
Dot plot shows 3-4 more cuts in 2026 ✓
Powell says "labor market concerns outweigh inflation" ✓
Balance sheet runoff stops as planned (December 1) ✓
Market Reaction:
Immediate: ES pumps 1-1.5% to 6,930-6,950
Day 1-3: Consolidation at 6,920-6,950
Week 1-2: Breakout to 7,050-7,100
Month 1: Target 7,150-7,200 (+4.2%)
Sector Leaders:
Small caps (Russell 2000) +2-3%
Tech (Nasdaq) +1.5-2%
Financials +1-1.5%
Trade Setup:
Enter: ANY dip to 6,850-6,870 before Fed
Add: On breakout above 6,910 with volume
Target: 7,050 (+2.7%), 7,150 (+4.2%)
Stop: 6,820 (-0.6%)
Risk/Reward: 1:4
SCENARIO B: Hawkish Cut (30% Probability) - NEUTRAL/CHOPPY
What Happens:
Fed cuts 25bps to 3.50-3.75% range ✓
BUT dot plot shows only 1-2 cuts in 2026 ❌
Powell says "we're near neutral, will pause to assess" ❌
Market had priced in 3-4 cuts for 2026 = DISAPPOINTMENT
Market Reaction:
Immediate: ES drops 0.8-1.2% to 6,790-6,820
Day 1: Volatility, chop between 6,780-6,850
Week 1-2: Dip-buying brings it back to 6,870-6,900
Month 1: Grind back to 6,950-7,000 (+1.3%)
Sector Rotation:
Small caps (Russell 2000) -1.5-2%
Tech holds up better (mega-caps)
Defensives (utilities, staples) outperform
Trade Setup:
DO NOT chase before Fed (risk of -1.2% drop)
Buy: Dip to 6,750-6,800 (mid-channel support)
Target: 6,900-6,950 (+2-3% from dip entry)
Stop: 6,720 (-1%)
Risk/Reward: 1:2
SCENARIO C: No Cut OR Very Hawkish (10% Probability) - BEARISH
What Happens:
Fed HOLDS at 3.75-4% range (SHOCK) ❌
OR cuts but says "this is the last one for 6+ months" ❌
Powell cites inflation persistence, tariff risks ❌
Market has 90% priced in for cut = PANIC
Market Reaction:
Immediate: ES flash crashes 2-3% to 6,650-6,750
Day 1: Volatility, VIX spikes to 25-30
Week 1-2: Bounce attempt to 6,750-6,800 fails
Month 1: Retest 6,600, then recovery to 6,800-6,850
Sector Carnage:
Small caps (Russell 2000) -3-4%
Tech -2-3%
Everything bleeds
Trade Setup:
Exit ALL longs immediately on no-cut announcement
Wait for VIX to spike above 25
Buy: Capitulation at 6,600-6,650 (lower channel)
Target: Recovery to 6,850-6,900 (+3-4%)
Risk/Reward: 1:3 (but high stress)
🎯 THE TRADE SETUP - Professional Execution Plan
🟢 PRIMARY LONG SETUP: BUY ES1!
Entry Strategy (Scale In):
Option A: Conservative (Wait for Fed)
50% at 6,750-6,780 (IF hawkish cut dips)
50% at 6,720-6,750 (IF deeper dip)
Best for: Risk-averse traders
Option B: Tactical (Enter Now)
40% at 6,860-6,870 (current - small position)
30% at 6,820-6,840 (IF pre-Fed dip)
30% at 6,750-6,780 (IF post-Fed dip)
Best for: Experienced traders comfortable with volatility
Stop Loss: 6,620 (HARD STOP)
Below 6,620 = channel break on daily close
Below this = technical structure invalidated
Max loss from 6,862 entry: -3.5%
Take Profit Targets:
TP1: 6,950-7,000 (Probability: 70%)
Initial breakout above ATH
Psychological 7,000 level
Action: Take 40% profit, move stop to 6,850
Gain: +1.3-2.0% | Risk/Reward: 1:2
TP2: 7,050-7,100 (Probability: 50%)
Momentum continuation
Channel projection
Action: Take 30% profit, trail stop to 6,920
Gain: +2.7-3.5% | Risk/Reward: 1:3
TP3: 7,150-7,200 (Probability: 30%)
Full breakout extension
TradingView puts it, with a potential breakout in S&P 500 futures above the 6,900 area
Action: Take 20% profit, let 10% ride
Gain: +4.2-4.9% | Risk/Reward: 1:4
Entry Confirmation Checklist:
Before entering, CHECK:
✅ Price holding above 6,850 (bull/bear line)
✅ Volume spike on bounce (80K+ contracts on 15min)
✅ RSI crosses above 60 (momentum shift)
✅ VIX drops below 16 (fear subsiding)
✅ Fed announces 25bps cut (as expected)
✅ Powell's tone is dovish or neutral (not hawkish)
WAIT FOR 4/6 BEFORE FULL POSITION
Fed Day Volatility Protocol:
December 10, 2PM ET - Fed Announcement:
1:45 PM: Tighten stops to 6,830 (before announcement)
2:00 PM: Fed statement released - READ IMMEDIATELY
2:00-2:05 PM: Algorithmic reaction (ignore, volatile)
2:05-2:30 PM: Human digestion of statement
2:30 PM: Powell press conference begins - WATCH LIVE
2:30-3:15 PM: Powell Q&A determines direction
3:15-4:00 PM: Final positioning for overnight
IF DOVISH: Add to position on dip to 6,900
IF HAWKISH: Cut 50%, trail rest tight at 6,820
Weekly Monitoring:
Check EVERY DAY:
Fed speakers: Any 2026 guidance changes
Economic data: Jobs (Dec 16), CPI (Dec 18)
Technical levels: Is channel intact?
VIX: Spikes above 20 = warning
Volume: Declining = weak trend
Emergency Exit Conditions:
❌ Daily close below 6,620 = EXIT ALL (channel break)
❌ VIX spikes above 25 = EXIT 50%, tight stop on rest
❌ Fed announces NO cut (10% scenario) = EXIT ALL immediately
❌ Powell says "this is the last cut for 2026" = EXIT 50%
❌ ES gaps down >1.5% overnight = reassess, likely exit
📊 Fundamental Analysis - Why This Matters
CATALYST #1: The Fed's Impossible Position
Federal Reserve policymakers are expected to cut interest rates at this week's meeting despite inflation remaining above their target amid concerns about a softening labor market.
This is the classic Fed dual mandate dilemma:
Mandate #1: Maximum employment (FAILING - 1.1M layoffs in 2025)
Mandate #2: Stable prices (FAILING - inflation at 2.8% vs 2% target)
They can't fix both. So they have to choose.
David Mericle, chief U.S. economist at Goldman Sachs notes job growth remains too low to keep up with labor supply growth and a rising unemployment rate.
My take: The Fed will prioritize employment over inflation. That's dovish = bullish for stocks.
CATALYST #2: Corporate Earnings Remain Strong
Despite all the macro noise, corporate profits are SOLID:
S&P 500 earnings: +8.7% YoY
Tech sector leading: +12-15% earnings growth
AI spending driving margins higher
Q4 guidance mostly positive
Carvana (CVNA) stock rose 8% before the bell on Monday following news on Friday that it will join the S&P 500 as part of the index's quarterly rebalancing.
Translation: Fundamentals support higher prices, Fed just needs to cooperate.
CATALYST #3: Seasonal Tailwinds
Could spark a "year-end melt-up", as TradingView puts it, with a potential breakout in S&P 500 futures above the 6,900 area.
December-January has positive seasonality:
Holiday spending strong
Tax-loss selling done (Nov-early Dec)
January effect (fresh capital inflows)
Pension/401k rebalancing (buy equities)
Historically, S&P 500 averages +1.3% in December and +1.1% in January.
CATALYST #4: Institutional Positioning
Bloomberg's interviews with 39 investment managers show that most are still planning for a risk-on 2026, citing expectations of continued AI-driven productivity and earnings growth.
But here's the key: Asset managers such as EFG Asset Management and BNP Paribas Asset Management caution that with 2025 already a strong year, they are reluctant to increase equity exposure into thin year-end liquidity, preferring instead to wait for better entry points in early 2026.
Translation: Institutions are WAITING to buy. Any Fed-induced dip to 6,750-6,800 will be AGGRESSIVELY bought.
⚠️ Risk Factors - The Bear Case
RISK #1: Hawkish Powell Tanks Market
Feroli noted that the firm is anticipating at least two dissents in favor of no rate cut as well as one in favor of a larger rate cut.
If Powell leans hawkish to appease the dissenting hawks, market could drop 1-2%.
RISK #2: Tariff-Induced Inflation
Minutes mentioned Trump's tariff policies in forecasts they provided in early September, projecting higher inflation and unemployment, slower growth and a lower federal funds ratel.
If inflation accelerates in 2026 due to tariffs, Fed might have to HIKE again = very bearish.
RISK #3: Labor Market Deterioration
Employers cut more than 1.1 million jobs through November, the most since 2020 and a 54% increase from the same period a year ago.
If this accelerates, could trigger recession fears.
RISK #4: Technical Breakdown
Break below 6,620 = channel invalidated → target 6,500-6,550 (-4.5-5.2%)
🔥 The Bottom Line
Here's what I KNOW on December 8, 2025:
✅ 81% probability of 25bps cut Wednesday
✅ S&P 500 less than 1% from ATH
✅ Your ascending channel is PERFECT technical structure
✅ 39 investment managers planning risk-on 2026
✅ Corporate earnings strong (+8.7% YoY)
✅ Seasonal tailwinds (December +1.3% avg)
✅ Support at 6,750-6,800 = institutional buy zone
Here's what I DON'T know:
Will Powell be dovish or hawkish?
How many 2026 cuts will dot plot show?
Will Q&A reveal recession concerns?
But here's what the MATH says:
Risk: 6,862 → 6,620 = -3.5% (if channel breaks)
Reward: 6,862 → 7,050 = +2.7% (base case)
Extended: 6,862 → 7,150 = +4.2% (bull case)
Risk/Reward: 1:2.5 minimum
The Play:
Small position NOW at 6,860-6,870 (20-30% of intended size)
IF hawkish dip to 6,750-6,800 → ADD 50-70%
IF dovish → ADD on breakout above 6,910
Stop at 6,620 (non-negotiable)
Target 7,050, then 7,150
This is a PROBABILITY game. 60% dovish, 30% hawkish, 10% shock. Position accordingly.
📍 Follow officialjackofalltrades for institutional-grade technical analysis, professional risk management, and trades backed by data.
Drop a 📊 if you're trading the Fed decision.
Drop a 🎯 if this helped your ES1! analysis.
Drop a 💰 if you're ready for 7,000+ SPX.
XAUUSD: The Calm Before the BreakoutOANDA:XAUUSD Over the past few sessions the price has shown remarkable strength, yet the market has recently slowed and slipped into a sideways phase. This type of behavior is common after a strong rally and does not necessarily indicate weakness. It is more of a natural pause, allowing buyers to regroup while maintaining control of the overall trend.
The decisive moment will come if the price breaks convincingly above the upper boundary of this consolidation. That would confirm that bullish momentum is returning and that the market is preparing to move toward new highs.
This is the scenario I am watching: a calm accumulation phase, a temporary slowdown, and then a renewed move higher once consolidation has run its course. At this stage, the breakout appears less like a possibility and more like something that is gradually taking shape.

GBPJPY WILL KEEP GROWING|LONG|
✅GBPJPY has broken cleanly above the demand zone after sweeping internal sell-side liquidity, showing strong displacement and an ICT-style shift in order-flow toward higher buy-side objectives. Price is now drawing toward the next liquidity pocket above. Time Frame 3H.
LONG🚀
✅Like and subscribe to never miss a new idea!✅

CRUDE OIL Bearish Breakout! Sell!
Hello,Traders!
CRUDE OIL has broken beneath the rising trendline and retested a supply cluster, confirming an SMC bearish shift as buy-side liquidity was swept before displacement pushed price lower. A continuation toward the target discount zone remains likely. Time Frame 2H.
Sell!
Comment and subscribe to help us grow!
Check out other forecasts below too!
Disclosure: I am part of Trade Nation's Influencer program and receive a monthly fee for using their TradingView charts in my analysis.

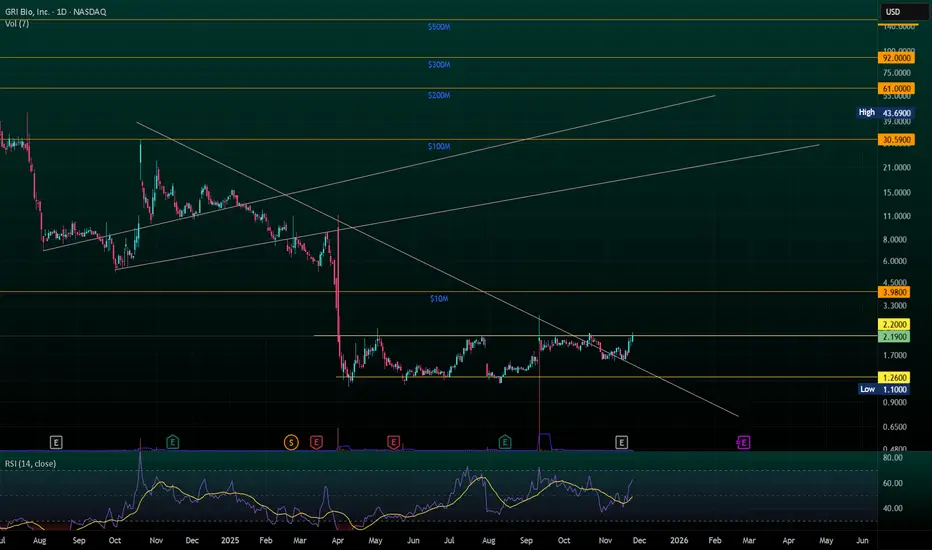
$GRI tap tap tapping $2.2 resistanceNASDAQ:GRI will release topline 12-week study data this week. All indications are that data will be positive. The price continues to test $2.2 resistance. This will be broken soon.
While all price movements are relative and unique, other companies with failed IPF trials lost ~$300M in market cap upon announcement. Others with successful trails have gained billions. GRI is worth approximately $6M today. Lots of room for upward valuation.
BTCUSDT: Failed Recovery Opens Path to 87,000 SupportHello everyone, here is my breakdown of the current BTCUSDT setup.
Market Analysis
BTCUSDT is trading inside a broader ascending channel, but the recent price action shows clear signs of weakness near the upper structure. Price previously attempted a breakout above the 90,000 Resistance Zone, however this move turned into a fake breakout, confirming strong seller pressure in that area. After the rejection, the market shifted into a corrective phase and formed a descending triangle structure, defined by the Triangle Support Line and repeated failures near resistance.
Currently, price is consolidating just below the 90,000 resistance, while gradually sliding along the descending support of the triangle. The 87,000 Support Zone remains the key downside buffer where buyers previously stepped in. The overall structure now suggests that bullish momentum is weakening, and sellers are gaining short-term control as long as price remains below the 90,000 resistance level.
My Scenario & Strategy
My scenario is bearish, as long as BTCUSDT stays below the 90,000 Resistance Zone and continues to respect the descending triangle structure. I expect price to attempt another breakdown toward the 87,000 Support Zone, which aligns with the lower channel support and previously active demand area. A clean break below 87,000 would confirm bearish continuation and open the path toward deeper downside targets.
However, if price once again reclaims the 90,000 resistance with strong volume and holding strength, the bearish scenario would be invalidated and a renewed push toward the upper channel could follow. For now, the market supports a short bias, with the main focus on a potential move toward the 87,000 support area.
That’s the setup I’m tracking. Thank you for your attention, and always manage your risk.

EURUSD: Buyers Push Toward the 1.1680 Triangle Resistance BreakHello everyone, here is my breakdown of the current EURUSD setup.
Market Analysis
EURUSD is transitioning out of a prolonged bearish phase that previously unfolded inside a well-defined downward channel. After forming a major swing low in early November, the pair initiated a recovery and gradually shifted into a corrective bullish structure. Price is now trading inside a developing triangle formation, defined by the ascending Triangle Support Line and the descending Triangle Resistance Line. During the decline, the market repeatedly respected the key Support Zone around 1.16200, which acted as a strong demand area and triggered bullish reactions on multiple occasions. Most recently, EURUSD completed a clear Head and Shoulders reversal pattern near the lower boundary, signaling exhaustion of sellers and the start of buyer control. Following this structure, price broke above the support zone and is now consolidating above it, confirming the zone as a valid demand base.
Currently, the pair is approaching the major Resistance Zone at 1.16800, which also aligns with the descending triangle resistance. This area remains the key upside barrier for buyers and represents a critical decision point for the market.
My Scenario & Strategy
My scenario is bullish, as long as price remains above the 1.16200 Support Zone and continues respecting the ascending Triangle Support Line. I expect EURUSD to maintain upward pressure and attempt a breakout toward the 1.16800 resistance, which is the next major supply area. A clean breakout above this zone would confirm bullish continuation and open the way for further upside toward higher targets.
However, if price reaches the resistance and shows strong rejection, a corrective pullback back toward the 1.16200 demand may occur. Still, the overall bullish structure remains valid as long as the support zone holds. For now, market conditions favor a long bias with focus on a breakout attempt toward the 1.16800 resistance zone.
That's the setup I'm tracking. Thank you for your attention, and always manage your risk.
BTCUSD Pauses at Structure Top — Bulls Aim for 95,500 RetestHello traders! Here is my breakdown of the current BTCUSD setup. After a strong bearish phase, Bitcoin found support near the major Support Level around $89,100. Before reaching this zone, price was trading inside a broad descending channel, where both the Resistance Line and Support Line guided the downtrend. A fake breakout occurred near the lower boundary, showing early buyer interest, but overall momentum remained bearish until price reached the support. From there, BTC formed a clear sideways Range, signaling accumulation before a reversal attempt. Once buyers gained strength, price broke out of the range and shifted into a bullish structure. BTC began climbing within a rising wedge-like channel, respecting both the ascending Support Line and the diagonal Resistance Line. Along the way, the market formed multiple breakouts and fake breakouts, confirming active participation from both sides. However, buyers consistently defended the rising trendline, maintaining higher lows while approaching the key horizontal Resistance Level near $95,500. Currently, BTCUSD is pulling back slightly after touching the wedge resistance. As long as price holds above the ascending support and stays above $89,100, the bullish structure remains intact. My scenario suggests a potential continuation toward TP1 → $95,500 upon a successful rebound from the local support. If the market breaks below the rising structure, however, a deeper correction may unfold before any further upward attempt. For now, buyers are favored while the price remains inside the ascending channel. Please share this idea with your friends and click Boost 🚀

EURUSD Early Week Bullish Outlook After Tokyo SweepQuick Summary
EURUSD remains strongly bullish, and the recent corrective decline is healthy for bullish continuation. Price is expected to dip early in the week to sweep the previous Tokyo low and go deeper into the hourly orderblock that aligns with the ascending trendline before resuming its upward move.
Full Analysis
The EURUSD continues to show strong bullish momentum, and the recent pullback is completely in line with a healthy trending market. Despite the strength of the prior upward move, the pair produced a controlled correction
This corrective move is particularly meaningful because price tapped into a clean hourly orderblock that aligns perfectly with an ascending trendline. Such confluence typically provides a strong foundation for buyers, showing that the market structure remains intact and supportive of further upside.
As we head into the new week, the expectation is that EURUSD may continue to dip slightly to sweep the previous Tokyo low. This potential sweep is important because the liquidity resting below that level can act as fuel for the next bullish expansion. Once the liquidity beneath Tokyo is taken, price is likely to react strongly from the same hourly orderblock zone and resume its upward trajectory.

XAUUSD Long: The 4,160 Support Holds – Path to 4,260 is OpenHello, traders! The price action for XAUUSD is currently developing within a well-defined ascending trend structure, supported by a rising major Trend Line from the lows. The market previously showed multiple rejections from the Triangle Supply Line, each marked by clear breakout attempts followed by corrective pullbacks. These reactions formed a sequence of higher lows, confirming that buyers remain in control of the broader structure.
Currently, after the last strong impulsive move upward, Gold reacted from the Supply Zone around 4,260, forming a short-term corrective phase while respecting the rising Triangle Demand Line near the 4,160 demand level. Price is now compressing between the descending supply line and the ascending demand line, creating a tightening triangle structure that signals growing pressure for a directional expansion. This compression reflects a balance between profit-taking sellers at resistance and aggressive dip-buyers along demand.
My scenario for the further development is bullish continuation as long as price holds above the Triangle Demand Line and the 4,160 demand zone. I expect a rebound from current levels, followed by a renewed attack on the 4,260 Supply Zone. If buyers manage to produce a clean breakout above this resistance, Gold may accelerate toward higher targets with strong momentum continuation. However, if the supply zone holds and price breaks below the demand line, a deeper corrective pullback toward the main rising Trend Line could develop. For now, the structure favors buyers, with the key focus on a breakout attempt toward 4,260. Manage your risk!
