Brent Oil Setup: Pre-Talks Correction ScenarioBrent Crude OIL ( FX_IDC:USDBRO ), over the past two months, has been rising due to escalating tensions in the Middle East and the potential for conflict between Iran and the U.S. If these tensions materialize, global oil supply could be impacted—especially given the significance of the Strait of Hormuz.
In the past 48 hours, however, news emerged that Iran-U.S. negotiations are set for Friday at 10 a.m. local time in Muscat, Oman, rather than Istanbul. If these talks yield positive results, oil prices may fall due to reduced tensions. Conversely, if talks fail, oil could spike again. Until then, we can rely on technicals for short-term opportunities.
Let’s quickly check Brent oil’s 4-hour chart. Brent has been in an ascending channel over the past 60 days and is currently near a resistance zone($71.30-$68.00).
From an Elliott Wave perspective, Brent seems to have completed a 5-wave impulse within the ascending channel. We can now anticipate a corrective wave.
I expect Brent oil to decline before the talks, potentially dropping to around $66.40. If agreement is reached, we could see a break of the lower channel line, with prices heading toward $63.64.
First Target: $66.40
Second Target: $63.64
Stop Loss(SL): $61.00(Worst)
Points may shift as the market evolves
💡 Please respect each other's opinions and express agreement or disagreement politely.
📌U.S. Dollar/Brent Crude OIL Analysis (USDBRO), 4-hour time frame.
🛑 Always set a Stop Loss(SL) for every position you open.
✅ This is just my idea; I’d love to see your thoughts too!
🔥 If you find it helpful, please BOOST this post and share it with your friends.
Brentoilanalysis

Bullish Opportunity with smal SL According to Global Uptrend on Weekly Timeframe
To Divergence on 1h Time Frame with CCI

Brent Crude Oil (UKOIL) — H4 Formation of an ABC Structure + ChaBrent Crude Oil (UKOIL) — H4 Formation of an ABC Structure + Channel Breakout (Trend Continuation)
🔎 Market Structure (H4)
On the H4 timeframe, Brent is forming a corrective ABC structure, and price is attempting a breakout through the channel boundary, which supports a continuation of the broader uptrend.
Key technical points:
A corrective A–B–C leg is developing after the previous push higher
Price action shows a channel boundary break / breakout attempt
The scenario assumes continuation only if price holds above the C-wave low
📐 Higher Timeframe Context
• On the higher timeframe, the move can be interpreted as the formation of a 5th wave (continuation phase) — meaning the market may be preparing for the final impulsive push higher.
• The ABC correction serves as the buildup phase, and the breakout of the channel boundary is the trigger that confirms continuation.
📍 Entry Zone
Entry: 66.648
Entry is positioned around:
The breakout/retest area of the channel boundary
The post-correction stabilization zone after wave C completion
🎯 Target Levels (from the chart)
Upside targets are defined by the marked structural levels:
TP1: 68.534
TP2: 70.485
TP3: 73.232
TP4: 76.071
🛑 Invalidation / Stop
Stop: 65.073
Stop is placed below the low of wave C, which invalidates the ABC-completion / continuation setup if broken.
🧠 Risk & Trade Management
• This setup is continuation-biased — not a reversal trade
• Confirmation improves if price holds above the breakout zone and forms higher lows
• Avoid increasing risk before the structure fully transitions from correction to impulse
• If price breaks below 65.073, the continuation scenario is invalidated
📌 Summary
Brent (H4) is forming an ABC corrective structure and attempting a channel breakout in line with the broader uptrend.
Higher timeframe context supports a potential 5th wave development, with targets mapped above as the continuation path.

BRENT Oil → Bullish Breakout | Capital Flow Confirmed🛢️ BRENT CRUDE OIL (UKOIL) - Energy Market Capital Flow Blueprint ⚡
Swing/Day Trade | Bullish Triangular Breakout Strategy
📊 ASSET OVERVIEW
Asset Ticker: BRENT CRUDE / UKOIL (ICE Futures Europe)
Current Price Zone: $64.12 USD/BBL (As of Jan 26, 2026)
Market Status: 📈 Bullish Formation Testing Resistance
Trading Type: Swing Trade / Day Trade Setup
🎯 TECHNICAL PLAN - BULLISH BREAKDOWN
Primary Bias: BULLISH CONFIRMED ✅
Setup: Triangular Moving Average (TMA) Breakout & Retest Pattern
Structure: Clean impulsive move with shallow corrective pullback
Confirmation: No structural breakdown signals observed
Timeframe: Multiple timeframes (H1, H4, D1 alignment)
💰 ENTRY STRATEGY - "THIEF LAYERING SYSTEM" 🎯
Multi-Level Limit Order Entry (Pyramid Strategy)
The "Thief Method" = Smart accumulation on dips using multiple buy limits
Primary Entry Layers (Build Position Progressively):
🔵 Layer 1: $63.50 (20% Position Size)
🔵 Layer 2: $64.00 (25% Position Size)
🔵 Layer 3: $64.50 (30% Position Size)
🔵 Layer 4: $65.00 (25% Position Size)
💡 Pro Tip: Adjust layer density (add $63.75, $64.25, etc.) based on your account size & risk tolerance. This layering approach averages your entry cost and reduces emotional decisions!
Entry Confirmation:
✓ Price bounces from support zone $63.00-$63.50
✓ Volume surge on upside break
✓ TMA bullish crossover
✓ Break above triangular resistance
🎪 PROFIT TARGETS - ESCAPE WITH GAINS! 🚀
Primary Target: $67.50 USD/BBL
Logic: Simple Moving Average (SMA 200) acts as dynamic resistance + Overbought zone + Historical swing high
Risk/Reward: Typically 2.0-2.5:1 depending on entry
Secondary Targets (Pyramid Out):
📍 Target 1: $66.50 (Partial TP - 40% position)
📍 Target 2: $67.00 (Partial TP - 35% position)
📍 Target 3: $67.50 (Full TP - 25% position)
⚠️ IMPORTANT DISCLAIMER:
These are suggested levels. As traders, YOU have full autonomy on your profit targets. Take profits at your own discretion based on market conditions, risk management, and personal strategy. Never risk more than you can afford to lose! 💪
🛡️ STOP LOSS - PROTECTION FIRST!
Stop Loss Level: $63.00 USD/BBL
Placement: Positioned BELOW the key moving average support
Logic: Clean break below this level = trend invalidation
Position Risk: Typically 1-1.5% of account per trade (strict!)
⚠️ CRITICAL DISCLAIMER:
SL placement shown is a GUIDE ONLY. Your risk management is YOUR responsibility. Adjust SL based on your risk tolerance, position size, and account protection strategy. Never ignore your stops! 🚨
📈 RELATED PAIRS TO WATCH - CORRELATION TRADING 🔗
1️⃣ WTI CRUDE OIL / TVC:USOIL
Correlation: POSITIVE (Brent/WTI typically move together)
Current: ~$61.83/barrel
Key Level: Watch $60.00 support zone
Why Watch: WTI breaks often precede BRENT moves
Strategy Tip: Confirm BRENT signals with WTI chart alignment
2️⃣ US DOLLAR INDEX ( TVC:DXY )
Correlation: DYNAMIC (Recently shifted from inverse to positive)
Current Zone: 98.68-99.38 (Testing resistance)
Key Info: 🔄 Since 2021, rising oil prices = stronger USD (Modern relationship!)
Impact: Stronger DXY = Potential headwind for oil
Watch Level: DXY breakdown below 98.23 = Dollar weakness = Oil support
Why It Matters: Oil priced in USD - dollar strength makes oil more expensive globally
3️⃣ FX:EURUSD 💶
Correlation: INVERSE to Oil (Weaker euro = Oil strength)
Current: Monitor ECB policy signals
Trade Hint: EUR/USD breakdown often coincides with oil strength
Key Level: 1.0700 zone critical
4️⃣ FX:GBPUSD
Correlation: INVERSE (Weaker pound = Oil bullish)
Why: UK oil exports increase when GBP softens
Watch: Bank of England rate decisions
Sweet Spot: GBP/USD dips = BRENT strength likely
5️⃣ COPPER / METALS
Correlation: POSITIVE (Economic growth proxy)
Logic: Rising copper = Industrial demand = Oil demand up
Watch: Copper above $4.00 = Oil tailwind; Below = Headwind
Macro Signal: Copper strength validates risk-on environment
6️⃣ GOLD ( OANDA:XAUUSD ) 🏆
Correlation: MIXED (Risk sentiment dependent)
Inverse Risk Indicator: Gold spike = Flight to safety = Oil weakness
Current: Monitor inflation expectations
Edge: Gold spike above $2,100 = Caution for oil shorts
📰 FUNDAMENTAL & ECONOMIC FACTORS - WHAT'S MOVING THE MARKET 🌍
🔴 BEARISH PRESSURES (Short-term headwinds)
1. Global Oil Oversupply⚖️
IEA Projection: 3.8 million bpd surplus forecast for 2026
EIA Outlook: Brent average declining to $56/barrel in 2026 (vs $66+ current)
Driver: OPEC+ restraint + US production records + Guyana scaling + Canadian output
Impact: ⬇️ Price ceiling pressure - Don't expect explosive rallies
2. Abundant Global Inventories 📦
Status: Chinese onshore inventories at RECORD HIGHS
US Data: Crude oil storage volumes climbing above recent lows
Signal: Market well-supplied = Limited upside surprise
3. OPEC+ Production Pause ⏸️
Decision: 8 OPEC+ members pausing output increases Jan-Mar 2026 (Seasonality reasons)
Members: Saudi Arabia, Russia, UAE, Kazakhstan, Kuwait, Iraq, Algeria, Oman
Next Review: February 1, 2026 - KEY DATE TO WATCH
Context: 1.65 million bpd voluntary cuts could be restored gradually
Implication: No fresh production cuts coming - Supply likely to grow
4. Weak Demand Growth 📉
Global Demand Growth: ~1.2% annually (MODEST)
Context: Not enough to absorb supply growth
Risk: Structural oversupply becomes normalized
🟢 BULLISH CATALYSTS (Support factors)
1. Geopolitical Risk Premium ⚠️
Status: ACTIVE - Iran tensions elevated
Trump Position: Armada deployed toward Iran region
Risk Event: Potential military escalation = Supply disruption fear
Oil Response: Every Iran threat = $0.50-$2.00 premium added
Probability: Remains tail-risk but keeps bids elevated
2. Middle East Supply Disruptions 🔥
Kazakhstan Issue: Tengiz oilfield production still hasn't fully resumed
Impact: Estimated production shortfall present
Status: Repairs ongoing - Completion timeline critical
3. Softer US Dollar Support 💵
Current DXY: Trending down from recent highs (Positive for oil)
US-Europe Tensions: Strains weighing on dollar
Ukraine Uncertainty: Unresolved peace talks = Safe-haven weakness
Implication: Weak dollar = Oil cheaper for foreign buyers = Demand lift
4. China Strategic Reserves Demand 🇨🇳
Estimated Rate: Nearly 1.0 million bpd being added to strategic stockpiles
Duration: Continuing through 2026 (potential support)
Impact: Artificial demand creation = Price floor supporter
Note: Rate decreases ~33% in 2027 - Watch this transition
5. Strong Global Oil Demand Momentum 📊
2025 Achievement: Record oil consumption globally
2026 Projection: OPEC expects +1.4 million bpd growth
OPEC Confidence: Cartel maintaining bullish demand outlook despite IEA skepticism
Key Driver: AI infrastructure energy needs, aviation recovery, industrial activity
📅 CRITICAL DATES & ECONOMIC CALENDAR - WHAT TO MONITOR 🗓️
IMMEDIATE (Next 2 Weeks)
Jan 28-29: US CPI Release - MAJOR (Impacts Fed expectations & dollar)
If hot: USD strength = Oil headwind
If cool: USD weakness = Oil support
Feb 1, 2026: OPEC+ Monthly Meeting - WATCH CLOSELY
Production decision review
Any hints at Q2/Q3 production changes?
Cartel messaging critical
February 2026
Feb 7: US Jobs Report (NFP)
Economic health indicator - impacts oil demand expectations
Feb 14: OPEC Monthly Oil Market Report Release
Updated 2026 demand/supply forecasts
Sentiment gauge
Q1 2026 Focus
ECB Policy: European Central Bank meetings - EUR weakness = Oil strength
Fed Stance: Rate hold expectations - Dollar direction crucial
China Data: Manufacturing PMI, economic activity signals
⚡ TRADE EXECUTION CHECKLIST
BEFORE ENTRY ✅
Confirm TMA breakout on H4/D1 chart
Check volume surge on breakout candle
Verify no negative divergences on MACD
Monitor DXY position (avoid entry if DXY spiking higher)
Check geopolitical news - Any Iran/Middle East developments?
Confirm all 4 layers placed at limits
POSITION MANAGEMENT 🎯
Set 50% TP at $67.00 (secure profits early!)
Move SL to breakeven after 1.5R profit
Pyramid out of position gradually
Trail stops on partial profits
NO holding through FOMC/OPEC meetings without hedges
EXIT SIGNALS 🚨
❌ Break below $63.00 = Stop loss hit (exit 100%)
❌ Close below 200-SMA = Trend invalidation
❌ Major DXY rally begins = Risk/reward deteriorates
❌ Negative gap opens (overnight) = Reassess position
🎓 STRATEGY SUMMARY
Best Case Scenario:
Break above $65.50 → Run to $67.50 TP = 2.5:1 Risk/Reward ✅
Worst Case Scenario:
Rejection at $65.00 → Fall to SL $63.00 = 1:1.5 Risk Loss ✅ (Managed)
Breakeven Trade:
Bounce to $64.50 then reversal = Tighten SL, exit flat
⚠️ FINAL RISK DISCLAIMER
Oil trading involves substantial risk:
Volatility: Brent can swing $1-3/barrel intraday on news
Geopolitical Risk: Unexpected escalations can gap prices overnight
Liquidity Events: Thin volume periods can cause slippage
Leverage Risk: If using leverage, losses amplify quickly
Margin Calls: Futures trading can wipe accounts quickly
YOU are responsible for:
✓ Your position sizing (risk max 1-2% per trade)
✓ Your stops (ALWAYS set them)
✓ Your profits targets (take them!)
✓ Your research (verify all signals yourself)
✓ Your broker selection (regulated, reputable)
Trade with discipline. Trade with a plan. Trade what you can afford to lose. 💪
🚀 ENGAGEMENT BOOST TIPS FOR TRADERS
Share this idea if:
✅ You believe in the bullish breakout thesis
✅ You're tracking geopolitical oil risks
✅ You're using this for swing trade confirmation
✅ You found the layering strategy useful
✅ You're monitoring OPEC+ next move (Feb 1)
Questions? Comments? Drop them below - Let's discuss the setup! 💬
Good luck, fellow traders! May your entries be timely and your stops be tight! 🎯

Middle East Risks Keep Brent Oil Bullish — Higher TargetsAs I expected in the previous idea , Brent Crude OIL( BLACKBULL:BRENT ) has risen and reached its targets, with a Risk-To-Reward: 2:01 (full target).
Brent Crude OIL is currently trading near the support zone($63.30-$62.00) and the support lines.
From an Elliott Wave perspective, it appears that Brent Crude OIL has completed main wave 4, and we can now expect the next impulsive wave for the main wave 5.
Additionally, news from the Middle East does not indicate a reduction in tensions, and we can expect potential surprises in the region. Therefore, I prefer to maintain long positions in Brent Crude OIL rather than short positions, and I’m looking for triggers to enter long.
I expect that Brent Crude OIL will once again target the resistance zone($66.80-$65.00) and potentially rise to around $66.47. The next target could be the yearly pivot point($67.30).
First Target: $66.47
Second Target: $67.30
Stop Loss(SL): $62.60
Points may shift as the market evolves
💡 Please respect each other's opinions and express agreement or disagreement politely.
📌U.S. Dollar/Brent Crude OIL Analysis (USDCAD), 4-hour time frame.
🛑 Always set a Stop Loss(SL) for every position you open.
✅ This is just my idea; I’d love to see your thoughts too!
🔥 If you find it helpful, please BOOST this post and share it with your friends.

Brent Oil — H4 | Bullish Continuation ScenarioBrent Oil — H4 | Bullish Continuation Scenario
Price is holding above key support after a corrective pullback, with structure favoring continuation to the upside.
🧩 Technical Overview
• On the higher timeframe, the market is forming a potential 5th wave, indicating the final impulsive phase of the current bullish cycle.
• On H4, the correction is developing as an ABC structure, formed after a breakout above the descending channel boundary.
• The pullback remains corrective, with price holding above structural support.
📈 Bullish Scenario
• Key support zone: 63.9–63.1
• Invalidation / Stop-loss: below 63.15
(below the corrective low and failed structure scenario)
• Upside targets:
– 65.44 — first resistance / reaction level
– 67.47 — continuation target
– 69.00 — higher resistance
– 72.00 — extended bullish objective
A sustained move above 65.4 would confirm continuation of the impulsive leg.
⚙️ Market Context
• Higher timeframe supports a 5th wave expansion.
• Breakout above the channel followed by ABC correction fits a classic trend-continuation setup.
• Structure remains bullish while price stays above the support zone.
🧭 Summary
Brent maintains a bullish bias above 63.1–63.9.
The combination of a 5th wave on the higher timeframe and an ABC correction after channel breakout supports continuation toward 65.4 → 67.5 → 69.0, with further extension possible if momentum accelerates.

UKOIL Bearish Opportunity — Is This the Pullback to Sell?🛢️ BRENT CRUDE (UKOIL) - BEARISH SWING TRADE SETUP 📉
📊 CURRENT MARKET DATA (Live as of Nov 21, 2025)
Brent Crude: $64.07/barrel (+0.88% from previous day)
WTI Crude: $57.77/barrel (-2.09% from previous day)
Market Status: Bearish momentum with descending channel pattern confirmed
🎯 TRADE SETUP - BEARISH CONFIRMATION
📍 ENTRY STRATEGY: Layered Limit Orders (Thief Method)
Layer 1: 63.00
Layer 2: 62.50
Layer 3: 62.00
(Scale entries based on your risk tolerance - add more layers if desired)
🛑 STOP LOSS: 64.00
⚠️ Risk Disclaimer: Adjust SL according to YOUR strategy and risk management. This is reference only - manage YOUR capital YOUR way.
🎯 PRIMARY TARGET: 60.50
Strong support zone identified
Oversold conditions anticipated
Trap zone detected - secure profits accordingly
💡 Exit Strategy Note: Not financial advice. Take profits when YOUR targets align with YOUR risk/reward ratio.
📈 TECHNICAL CONFLUENCE
✅ Volume-weighted moving average pullback confirmed
✅ Retest of resistance completed
✅ Descending channel pattern active
✅ Bearish momentum building
🔗 CORRELATED ASSETS TO MONITOR
1. WTI CRUDE (USOIL) 💵
Current: $57.77/barrel
Correlation: Direct (85%+ correlation with Brent)
Watch for breakdown below $57.00 support
2. USD/CAD
Inverse Correlation with oil prices
CAD weakens when oil falls
Monitor for USD strength continuation
3. ENERGY SECTOR ETFs 📊
XLE (Energy Select Sector SPDR)
XOP (Oil & Gas Exploration ETF)
Follow for confirmation of sector weakness
4. NATURAL GAS (NATGAS) ⚡
Parallel Energy Market
Similar bearish patterns observed
Confirms broader energy sector weakness
5. RUSSIAN RUBLE (USD/RUB)
Oil-dependent currency
Weakens with falling oil prices
Geopolitical risk indicator
🌍 KEY MARKET FACTORS
⚠️ Supply Pressure
Increased global production capacity
OPEC+ policy uncertainties
📉 Demand Concerns
Global economic slowdown fears
Industrial activity softening
💵 Dollar Strength
Stronger USD = Lower oil prices
Monitor Federal Reserve policy
⚡ RISK MANAGEMENT REMINDER
🚨 Ladies & Gentlemen (Thief OG's) - This is NOT financial advice:
✓ Position size according to YOUR account
✓ Never risk more than you can afford to lose
✓ Adjust stops based on YOUR strategy
✓ Take profits at YOUR comfort levels
✓ Market can remain irrational longer than you can stay liquid
Your Capital = Your Responsibility = Your Profits/Losses
🎯 Trade Smart | Stay Disciplined | Manage Risk 🎯

Brent Oil Breaks Resistance as Middle East Tensions EscalateWith the start of the new week, Brent Oil( BLACKBULL:BRENT ) has continued its bullish trend.
Given the escalating tensions in the Middle East, a region that is crucial for global oil production, oil prices have risen accordingly.
Brent Oil has successfully broken through the resistance zone($63.30-$62.00) and resistance lines and is currently completing a pullback to these levels.
I expect that, given the potential for renewed tensions in the Middle East in the coming days and hours, the bullish trend in oil will continue, supported by both fundamental and technical analysis, and it will reach the targets set in the chart.
First Target: $64.91
Second Target: $65.77
Stop Loss(SL): $62.07
Points may shift as the market evolves
💡 Please respect each other's opinions and express agreement or disagreement politely.
📌U.S. Dollar/Brent Crude OIL Analysis (USDCAD), 4-hour time frame.
🛑 Always set a Stop Loss(SL) for every position you open.
✅ This is just my idea; I’d love to see your thoughts too!
🔥 If you find it helpful, please BOOST this post and share it with your friends.

Oil Rises 1.7% Since the Start of the Week On Geopolitical FactoOil Rises 1.7% Since the Start of the Week On Geopolitical Factors
As the XBR/USD chart shows, Brent crude trading opened this week near the $61.40 level, and by Tuesday morning the price was hovering around $61.50 (approximately +1.7%).
Oil prices are being pushed higher by geopolitical developments, including:
→ Pressure on Venezuela. President Trump stated that the United States could seize or sell oil from Venezuelan tankers that have been blocked.
→ Ukrainian attacks on ports and tankers linked to the transportation of Russian oil.
As a result, oil has gained around 5% from its seven-month low recorded on 16 December (point B), reflecting the risk premium that traders are building into the price of a barrel.
Technical Analysis of the XBR/USD Chart
Since mid-October, prices have remained in a downtrend, driven by a global increase in oil supply (analysts expect the supply surplus to persist into 2026).
At the same time:
→ price fluctuations have formed a descending channel, which was extended lower during the bearish impulse on 15–16 December;
→ at the low (B), the price failed to reach the lower boundary of the channel (a bullish signal), and then formed two bullish gaps (marked by arrows);
→ during the second gap, price moved aggressively into the upper half of the channel.
From a bullish perspective, price action suggests that buyers are currently in control, meaning traders should be prepared for a scenario in which rising geopolitical tensions push XBR/USD towards the upper boundary of the channel.
From a bearish standpoint, it is reasonable to assume that the area between the 50% and 61.8% Fibonacci retracement levels (where oil is trading today) could act as resistance following the A→B decline.
This article represents the opinion of the Companies operating under the FXOpen brand only. It is not to be construed as an offer, solicitation, or recommendation with respect to products and services provided by the Companies operating under the FXOpen brand, nor is it to be considered financial advice.

Is Brent Crude Setting Up for a Deeper Pullback?🔥 BRUTAL BRENT (UKOIL) SELL BLUEPRINT — Day & Swing Trade Guide! 🔥
Asset: BRENT “UKOIL” — Energies Market Trade Opportunity Guide (Day / Swing Trade)
Bias: Bearish Plan 📉
📍 Trade Setup Overview
The market is showing a clear downside narrative as liquidity continues shifting away from buyer strength. Volatility pockets + premium zones are forming the ideal backdrop for a controlled bearish play.
🎯 Entry
ANY PRICE LEVEL ENTRY
This setup focuses on structure, not perfection. Price exploration zones offer multiple opportunities to position short as long as the bearish narrative remains intact.
🛡️ Stop Loss
This is the Thief SL @ 62.500
Dear Ladies & Gentleman (Thief OG’s), adjust your SL based on your own system, risk comfort, and volatility tolerance.
Note: I am not recommending that you set only my SL — your capital, your control, your rules. Manage risk like a professional.
💰 Target
We have strong support, oversold confluence, and visible trap behaviour forming below, so the smart exit is clean and disciplined.
Target @ 59.500
Note: Dear Ladies & Gentleman (Thief OG’s), I am not recommending that you use only my TP. Make money, take money — at your own execution style & risk preference.
🔗 Related Pairs to Watch (Correlation Guide)
1️⃣ WTI Crude Oil — USOIL / CL
Moves closely with Brent (UKOIL).
If WTI weakens, Brent often mirrors the same bearish energy.
Watch for supply-zone rejections & macro oil inventory pressure.
2️⃣ Natural Gas — NGAS / XNGUSD
Energy sector sentiment often overlaps.
When overall energy demand weakens, oil tends to follow with downside momentum.
Good for gauging sentiment shifts.
3️⃣ CAD Pairs — USDCAD, CADJPY
Canada is an oil-exporting economy.
If oil falls, CAD weakens, making USDCAD push upward.
A great indirect correlation filter for confidence.
4️⃣ DXY — US Dollar Index TVC:DXY
A rising dollar = pressure on commodities.
Strong USD typically accelerates bearish moves on Brent.
5️⃣ S&P500 Energy Sector — AMEX:XLE
If energy equities sell off, it often preludes oil weakness.
Good higher-timeframe sentiment indicator.
🧩 Why These Correlations Matter
They help filter noise and add multi-asset confirmation.
When multiple correlated markets align, your trade idea gains more precision, timing, and conviction.
Smart traders don’t look at a single chart — they watch the entire ecosystem.

BRN: energy reductionIn recent sessions, BRN has shown a gradual shift in sentiment toward sellers. Oil’s movement consists of a series of downward impulses that form the basis for a bearish scenario.
The chart shows that the price is losing stability in the upper ranges and is attempting to consolidate below local levels. Upward fluctuations appear more like pauses within the downward wave than genuine reversal attempts.
The fundamental backdrop also adds pressure: expectations of declining global demand and rising oil inventories in key regions provide an additional argument in favor of continued weakness.
As a result, BRN remains under the influence of bearish dynamics, where further development will depend on the market’s ability to stay within the current channel and confirm seller strength.

XBR/USD Chart Analysis: Price Rebounds from a Seven-Week LowXBR/USD Chart Analysis: Price Rebounds from a Seven-Week Low
On 1 December, we outlined a descending channel on the XBR/USD chart and noted that the bearish trend was driven by fading geopolitical risks. Indeed, hopes for an end to the war in Ukraine—along with the possibility of sanctions on Russia being eased—acted as a bearish catalyst.
In addition, the International Energy Agency reaffirmed its forecast for a record supply surplus and highlighted that global inventories have reached a four-year high.
Under the influence of these and other factors, such as signs of a slowdown in the Chinese economy, Brent crude fell to a seven-week low at point A. However, today the XBR/USD chart shows a bullish reversal, again triggered by geopolitics, according to media reports:
→ The United States has intercepted a sanctioned Venezuelan tanker, which Caracas described as an “act of piracy”.
→ Ukraine has struck another vessel from the “shadow fleet” linked to Russia’s oil trade.
Technical Analysis of XBR/USD
From a bearish perspective:
→ the $62.60 level (where the blue trendline was broken) remains a significant resistance zone;
→ bulls failed to preserve the gains from the A→B rally, as the price sank further to the low at point C;
→ the nearest resistance lies around $61.70.
From a bullish perspective:
→ the lower boundary of the channel may continue to act as support;
→ Brent crude has rebounded convincingly after a false bearish break below the November low—an indication of a potential liquidity grab, suggesting that “smart money” may be siding with demand.
Given these factors, geopolitical tensions may intensify, potentially driving XBR/USD back towards the median of the descending channel.
This article represents the opinion of the Companies operating under the FXOpen brand only. It is not to be construed as an offer, solicitation, or recommendation with respect to products and services provided by the Companies operating under the FXOpen brand, nor is it to be considered financial advice.

Oil Prices Rise on Geopolitical FactorsOil Prices Rise on Geopolitical Factors
As the XBR/USD chart shows, Brent crude opened this week’s trading around $65.70, but today the price is near $66.80 (around +1.7%).
Oil is being pushed higher by geopolitical factors, including:
→ Israel’s strike on Hamas leadership in Qatar;
→ Trump’s calls for Europe to impose tariffs on buyers of Russian oil.
It is also worth noting that over the weekend an OPEC+ meeting took place. Although the decision was made to increase production, the volumes were smaller than analysts had expected.
Technical Analysis of the XBR/USD Chart
After the surge of extreme volatility at the end of July, Brent crude price fluctuations have been forming a descending channel (shown in red), with the following developments:
→ in September the price tested the lines dividing the channel into quarters (2 September – QH test, 5 September – QL test);
→ this week’s rise in oil looks like a return to the median, where supply and demand tend to balance out (in other words, where market participants more often agree on a fair price).
From a bullish perspective:
→ the $65.00 level appears to be an important support, having already proved its strength in August and September;
→ the sequence of higher highs and lows A→B→C→D→E suggests that pullbacks have been roughly half the size of bullish impulses – a sign of strong demand.
From a bearish perspective:
→ August price action suggests that a bear flag has formed as an interim correction within the prevailing downtrend;
→ the $67.50 level may act as strong resistance, as supply forces there were able to trigger a bearish breakout of the pattern.
Taking the above into account, we could assume that Brent prices may stabilise around the median in the short term, before sliding along it downwards – unless the balance of supply and demand shifts sharply (for example, under the influence of new geopolitical factors or the release of major economic indicators).
This article represents the opinion of the Companies operating under the FXOpen brand only. It is not to be construed as an offer, solicitation, or recommendation with respect to products and services provided by the Companies operating under the FXOpen brand, nor is it to be considered financial advice.

Brent Crude Breakdown: $61 Next?Structure & momentum
Price completed a three-leg climb into late August but failed beneath a thick supply band clustered around 68.50 → 69.30 and again lower-high’d under 70.80. The last push up rode a rising support line; that line has now broken, followed by two wide-range sell candles closing near their lows—classic momentum expansion after a trendline break. The repeated red “S” clusters over the same band reinforce where offers sit and where rallies have been sold.
Levels that matter
• Overhead supply / invalidation:
First layer at 68.50–68.55 (breakdown pivot), then 69.33, and the stronger cap near 70.78. Acceptance back above 68.55 would be your first caution; sustained closes over 69.33 would neutralize the short and put 70.78 / 72.74 back in play.
• Immediate pivot: 66.73. Price is pressing this prior support; losing it turns the path of least resistance lower.
• Downside magnets / demand layers: 65.79, 64.74, and the deeper 61.98 base. These align with prior reaction lows and liquidity pools where buyers previously defended.
Why the bias is bearish (now)
• Lower high into supply (failed to clear 69s) + rising trendline break = change of character on 4H.
• Momentum follow-through: consecutive strong bearish bodies suggest sellers in control rather than a single news spike.
• Clean downside structure: stair-stepped supports below (66.73 → 65.79 → 64.74 → 61.98) provide logical profit-taking waypoints and reduce the odds of “vacuum” reversals.
Risk catalysts to respect
The chart flags upcoming US energy data windows—inventory releases can create sharp, temporary squeezes against trend. Size accordingly and expect slippage during those prints.
________________________________________
📉 Trade setup (bearish)
• Entry (Option A – continuation): Short on a 4H close below 66.73, or on a minor pullback that rejects 66.73 from underneath.
o Stop: 68.55
o T1: 65.79 (take ~30%)
o T2: 64.74 (take ~40%)
o T3: 61.98 (runner)
o Approx. R:R from 66.73 → 68.55 / 61.98: ~1 : 2.7
• Entry (Option B – sell the rip): Preferable risk if price bounces into 67.90–68.40 and prints rejection.
o Stop: 69.33
o T1: 66.73
o T2: 65.79
o T3: 64.74 / 61.98
Trade management: After T1, move the stop to breakeven. From there, trail above each 4H lower high (or ~1.5×ATR above price) to stay in the trend while protecting open profit. If momentum accelerates through 64.74, tighten the trail to lock in gains on the runner.
________________________________________
Invalidation & alternate path
A decisive 4H close back above 68.55 is your yellow flag; above 69.33 the bearish thesis weakens materially and favors a broader squeeze toward 70.78 and possibly 72.74. Until then, rallies into 68s remain sell zones.
Bottom line: The market has rotated from a rising correction into distribution below 69s, broken trendline support, and is now threatening 66.73. Fading bounces or selling the breakdown targets 65.79 → 64.74 → 61.98 with disciplined partials and a trailing stop.

XBR/USD Chart Analysis: Brent Crude Nears Its Lowest LevelXBR/USD Chart Analysis: Brent Crude Nears Its Lowest Level Since Early Summer
According to the XBR/USD chart, this morning (19 August) Brent crude oil price is showing bearish momentum, moving towards its lowest level since early summer (set last week). The key bearish drivers in the market include:
→ OPEC+ policy aimed at increasing production;
→ expectations that negotiations to end the war in Ukraine could lead to the lifting of sanctions on Russian oil exports, which would further expand global supply.
Technical Analysis of the XBR/USD Chart
In our analysis on 5 August, we noted that:
→ Brent crude had fallen to an important support level (marked in blue), which held throughout July;
→ a bearish breakout attempt below the blue support line was possible.
Indeed, in early August the price confirmed a bearish breakout of the blue line, accompanied by signs of rising volatility – the line subsequently reversed its role from support to resistance (as indicated by the arrows on the left-hand side of the chart).
Bears then consolidated their position, continuing to apply pressure and forming a downward channel (shown in red). The question now is whether Brent prices can continue their decline.
From a bullish perspective, there are grounds for demand to strengthen around the key support level at $65.00 (as indicated by the arrows on the right-hand side of the chart):
→ during an attempt to move lower, the chart formed a bullish harami reversal pattern;
→ this level acted as support following the bearish gap at this week’s market opening;
→ yesterday’s long lower shadow highlights aggressive buying activity.
From a bearish perspective, August’s downtrend remains intact – though it may be losing momentum. Note the RSI indicator, which is gradually leaning towards the 50 level (if bears were still firmly in control, it would remain closer to oversold territory).
This suggests that bulls may attempt to seize the initiative and challenge the upper boundary of the descending channel, seeking to offset at least part of Brent’s nearly 10% decline since late July. In this scenario, the $67.40 level – where bears previously demonstrated strong control – could become a critical test of demand resilience.
Tomorrow’s key releases could significantly influence price action: crude oil inventories (15:30 GMT+3) and the FOMC minutes (21:00 GMT+3).
This article represents the opinion of the Companies operating under the FXOpen brand only. It is not to be construed as an offer, solicitation, or recommendation with respect to products and services provided by the Companies operating under the FXOpen brand, nor is it to be considered financial advice.

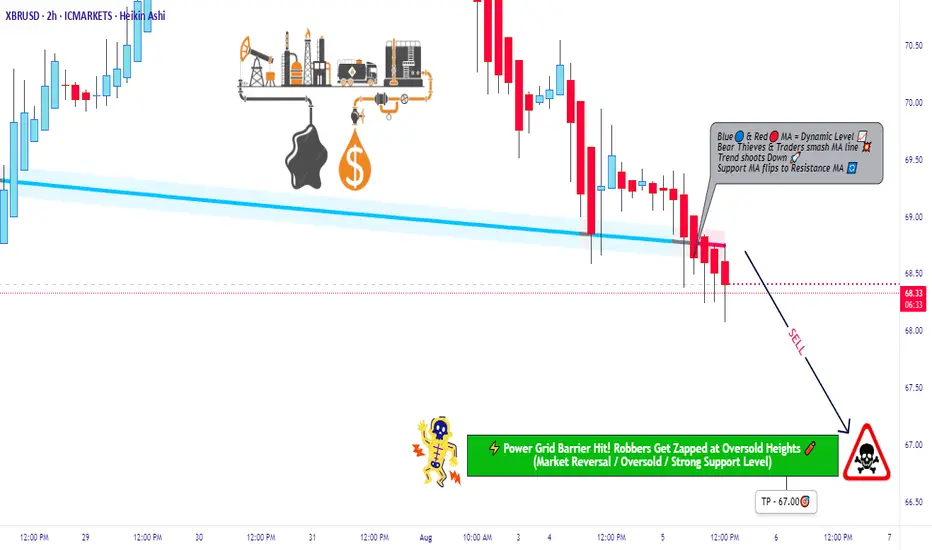
BRENT Robbery Setup: Thief's Bear Trap is Active!🔥💰BRENT BEARISH HEIST PLAN💰🔥
🎯 Asset: BRENT/ XBRUSD / UK Oil Spot
🧠 Strategy: Layered Limit Orders | Bearish Robbery in Progress
💼💣💼
Yo Money Movers & Market Jackers!
It’s time to load up the truck and roll out — the BRENT vault is cracked open and dripping with bearish loot! 🐻💵🔓
🎩 This isn’t just trading — this is Thief Trading Style™.
We don’t chase candles. We layer the loot, wait in the shadows, and strike on the pullback. No mercy. Just money. 💸🕶️
🚨 THIEF'S TRADE SETUP 🚨
🕵️ Entry Point:
Any Price Level – we’re everywhere.
Place layered Sell Limits like tripwires on the chart 🎯💣 — 15m or 30m candle nearest swing highs. The trap is set.
🛑 Stop Loss:
🔒 Locked @ 69.000 — right above resistance
This is a tactical retreat, not a failure. Every heist needs an escape route. 📉🔁
🎯 Target Zone:
💥 Aim for 65.000 — smash and grab style.
Get in, take profit, disappear into the shadows.
🧠 WHY THE HEIST?
The BRENT market looks ready for a rug pull —
🧊 Demand slowing
📉 Bearish structure unfolding
🎭 Bull traps getting exposed
🔥 Perfect time for thieves to cash out while the herd dreams green
Before pulling the trigger, check:
📰 Fundamentals 📦 Inventory Data 🧭 Intermarket Analysis 📊 COT Reports
Do your homework — then rob it like a professional. 🧠💼🔎
⚠️ MISSION WARNING ⚠️
Avoid new trades during news drops!
Use trailing SLs to protect loot. This market doesn’t play fair — but we don’t either. 🛑📰📉
💥 Hit BOOST if you're riding with the robbers!
Let’s show this market how Thief Traders steal gains like legends.
Every like = one more gold bar in the van 💰🚚💨
Stay sharp. Stay shadowed.
See you on the next job. 🐱👤💸📉
🔗 #Brent #XBRUSD #UKOil #ThiefTrader #BearishSetup #EnergyMarket #LayeringStrategy #MarketRobbery #SellThePump #RobTheChart

XBRUSD Robbery Setup: Thief's Bear Trap is Active! 🔥💰BRENT BEARISH HEIST PLAN💰🔥
🎯 Asset: XBRUSD / UK Oil Spot / BRENT
🧠 Strategy: Layered Limit Orders | Bearish Robbery in Progress
💼💣💼
Yo Money Movers & Market Jackers!
It’s time to load up the truck and roll out — the BRENT vault is cracked open and dripping with bearish loot! 🐻💵🔓
🎩 This isn’t just trading — this is Thief Trading Style™.
We don’t chase candles. We layer the loot, wait in the shadows, and strike on the pullback. No mercy. Just money. 💸🕶️
🚨 THIEF'S TRADE SETUP 🚨
🕵️ Entry Point:
Any Price Level – we’re everywhere.
Place layered Sell Limits like tripwires on the chart 🎯💣 — 15m or 30m candle nearest swing highs. The trap is set.
🛑 Stop Loss:
🔒 Locked @ 69.50 — right above resistance
This is a tactical retreat, not a failure. Every heist needs an escape route. 📉🔁
🎯 Target Zone:
💥 Aim for 67.00 — smash and grab style.
Get in, take profit, disappear into the shadows.
🧠 WHY THE HEIST?
The BRENT market looks ready for a rug pull —
🧊 Demand slowing
📉 Bearish structure unfolding
🎭 Bull traps getting exposed
🔥 Perfect time for thieves to cash out while the herd dreams green
Before pulling the trigger, check:
📰 Fundamentals 📦 Inventory Data 🧭 Intermarket Analysis 📊 COT Reports
Do your homework — then rob it like a professional. 🧠💼🔎
⚠️ MISSION WARNING ⚠️
Avoid new trades during news drops!
Use trailing SLs to protect loot. This market doesn’t play fair — but we don’t either. 🛑📰📉
💥 Hit BOOST if you're riding with the robbers!
Let’s show this market how Thief Traders steal gains like legends.
Every like = one more gold bar in the van 💰🚚💨
Stay sharp. Stay shadowed.
See you on the next job. 🐱👤💸📉
🔗 #Brent #XBRUSD #UKOil #ThiefTrader #BearishSetup #EnergyMarket #LayeringStrategy #MarketRobbery #SellThePump #RobTheChart
XBR/USD Chart Analysis: Oil Price Declines Towards Key SupportXBR/USD Chart Analysis: Oil Price Declines Towards Key Support
As the XBR/USD chart shows, Brent crude oil has made two significant moves recently:
Last week’s price increase (A) followed President Donald Trump’s intentions to impose tariffs on India due to its purchases of Russian oil. This could have disrupted established oil supply chains.
The price decline (B) may have been driven by both the decision of OPEC+ countries to increase production and reports of a weakening US labour market.
Thus, there is reason to believe that the more than 4.5% decline in Brent crude oil prices since the beginning of August reflects market participants’ scepticism about sustained high oil prices:
→ this has a negative impact on the US economy (JP Morgan analysts raised concerns about recession risks this week);
→ increased activity from oil producers may offset supply chain disruption risks.
Technical Analysis of the XBR/USD Chart
From a technical analysis perspective, Brent crude oil has dropped to a key support level (marked in blue), which was previously active in July. A rebound from this line could happen – in such a case, the price might face resistance at the Fair Value Gap area (marked in orange), formed between:
→ $70.81 – a support level active in late July, which was broken;
→ the psychological level of $70.00.
Attention should also be paid to price behaviour around the $69.00 level (indicated by arrows) – it quickly switched roles from support to resistance, indicating aggressive bearish sentiment. Given this observation, a potential bearish breakout attempt below the blue support line cannot be ruled out.
However, whether this scenario materialises will largely depend on developments in geopolitical risks and tariff agreements.
This article represents the opinion of the Companies operating under the FXOpen brand only. It is not to be construed as an offer, solicitation, or recommendation with respect to products and services provided by the Companies operating under the FXOpen brand, nor is it to be considered financial advice.

"UK Oil/Brent Heist Plan: Thief Style Breakout Strategy"🛢️💣 "BRENT Energy Heist Plan 💸: The Thief Trader's Playbook to Rob the UK Oil Market!" 🔫📈
🚫 This is a creative and educational overview of a market strategy. It does not encourage illegal activity. Please trade responsibly and within your own risk tolerance.
🌍 Hola! Bonjour! Marhaba! Hello, Money Makers & Market Thieves! 🤑💰📊
Welcome to the Thief Trading Style — a unique, bold, and tactical approach to trading the UK Oil Spot (Brent) market like a pro bandit on Wall Street. We don’t chase the market… we set the trap, wait, and strike like skilled robbers at the vault. 🔓💼
🧠💡Game Plan Summary:
📌 Asset: UK Oil Spot / Brent
📌 Style: Day Trade / Scalping
📌 Bias: Bullish Breakout
📌 Thief’s Method: Layered DCA Entries, Breakout Setup, Swing-Based SL, Aggressive TP
🎯 ENTRY - “The Vault Break”
🚨 Codename: Break & Retest Mission
Wait for a clean breakout above the Moving Average Wall (around 70.500) followed by a retest confirmation. That’s your green light!
✅ Buy Stop Entry: Above 70.500 after a clean candle close & retest.
✅ Buy Limit (Pullback): Near recent swing low or 15–30 min timeframe zones. Use DCA or order layering to reduce risk.
📌 Tip: Set up alerts at the breakout level — never miss the move.
🛑 STOP LOSS - “Escape Route”
🎙️ "Yo, Thief Rule #1: Plan the exit before the entry."
📍 SL suggestion: Swing Low @ 64.000 (based on 2H structure).
🧠 Risk management is key – consider your lot size, margin, and how many layered orders you're stacking.
📢 Optional: Trail that SL once price moves in your favor — lock your loot!
💸 TAKE PROFIT - “The Clean Getaway”
🎯 Target: 72.200 — but don’t be greedy. If the market gets shaky, exit before the cops (sellers) show up!
📌 Be ready to close manually if you smell reversal.
🔍 Fundamentals & Macro View
UK Oil is experiencing strong bullish momentum, driven by:
📰 Geopolitical tensions
🛢️ Supply-demand imbalances
📊 Positive sentiment & institutional flow (Check COT, Macro Outlooks, and Sentiment Reports)
👉 Stay updated with news drops and macro data that can flip the script — set economic calendar alerts.
⚠️ News Release Survival Tips
❌ Avoid new entries during high-impact news.
✅ Use trailing SL to protect running trades.
🔄 Monitor position sizing — volatile swings can eat your equity.
💥 SUPPORT THE CREW!
If you’re vibing with this Heist-Style Trading Analysis, smash that ❤️ Boost Button on TradingView and join the growing crew of market robbers making money with precision and attitude! 🏆💰📈
🚨 More Heist Plans coming soon — follow for real-time setups & updates!
📌 DISCLAIMER:
This analysis is educational and based on personal trading style. Always DYOR (Do Your Own Research), and tailor trades to your own risk profile. Markets change fast — stay agile and sharp! 🧠💼

Brent Oil Breakout Heist – Bullish Robbery in Progress!🕶️ Brent Oil Job in Motion – Market Robbery Blueprint by The Chart Bandits 💼💸
What’s up, gang? 👋 Hola, Ola, Bonjour, Hallo, Marhaba! 🌍
Calling all market robbers, trend thieves, and slick profit snatchers! 🤑💰💥
We’ve got eyes on the UK Oil Spot / Brent Energy Market – and this time, it’s a clean breakout job. According to our Thief Trading Code (yeah, that’s the street manual we use), the setup’s lit and the vault’s wide open. Here’s the drill:
📈 Entry Plan – The Break-In Point:
The score begins above MA level 65.400. When that line cracks, it’s time to move.
You can either:
🔹 Set buy stop orders just above the breakout zone
🔹 Or wait for a pullback to a 15m or 30m swing low/high and enter with style
🚨 Pro tip: Set your alerts. Real thieves don’t sleep on breakouts.
🛑 Stop Loss – Safety First, Bandits:
Let the breakout breathe. Don’t slam the SL too early.
Once it confirms, tuck your SL near the 4H swing low – around 64.000.
Lot size, risk appetite, number of positions – all play into where you hide your exit door.
Just don’t blame the crew if you jump in blind. ⚠️
🎯 Take Profit – The Escape Route:
Target set at 70.000 – hit it, grab the bags, and disappear before the bears sniff us out. 🏃♂️💨
📊 Why This Heist Works:
The market’s lookin’ bullish – real heat from fundamentals like:
Macro setups
COT positioning
Intermarket analysis
Sentiment vibes
Storage & inventory updates
🔍 Want the full blueprint? Fundamentals, charts, deep dives – check my profille for the linkss 🔗👀
⚠️ Heads-Up – News Drops Can Wreck the Getaway:
Don’t enter during high-impact news
Protect profits with a trailing SL
Always expect the unexpected, robbers 🚧📉
💥 Smash the Boost Button if you’re part of the Thief Crew!
We’re not just trading – we’re executing blueprints and stealing clean gains.
Stay tuned for the next setup. You know what time it is...
🕶️ Trade smart, loot fast, vanish smooth. 🐱👤💸🚀

Oil Price Falls Below $69Oil Price Falls Below Pre-Escalation Levels of Middle East Conflict
According to the XBR/USD chart:
→ Prior to Israel’s airstrikes on Iran on 13 June, the price of Brent crude was hovering around the $69.00 mark;
→ Following US bombings in Iran, the price spiked at the Monday market open, reaching a high of approximately $77.77 (as we reported on 23 June).
However, after President Trump announced a ceasefire between Iran and Israel — later confirmed by statements from both sides — oil prices dropped sharply. This morning, Brent is trading around $68, which is even lower than the level seen before the initial strikes.
Media outlets report that analysts broadly agree that fears have eased, even if the ceasefire appears fragile. Market participants seem to view the likelihood of the conflict escalating into a full-scale ground war — involving US troops and the closure of the Strait of Hormuz — as low. Shipping through the strait is reportedly returning to normal.
Technical Analysis of the XBR/USD Chart
Interestingly, the $69 level — from which prices surged on 13 June — acted as resistance yesterday (as indicated by the arrow on the chart).
It can be assumed that the longer the ceasefire holds, the less relevant the fears that have served as bullish drivers. In that case, Brent crude prices may continue fluctuating within a downward channel, outlined in red, with the possibility of a short-term rise toward its upper boundary.
Nevertheless, the key drivers for oil prices will remain the fundamental backdrop and official statements regarding the situation in the Middle East and other geopolitical factors.
This article represents the opinion of the Companies operating under the FXOpen brand only. It is not to be construed as an offer, solicitation, or recommendation with respect to products and services provided by the Companies operating under the FXOpen brand, nor is it to be considered financial advice.

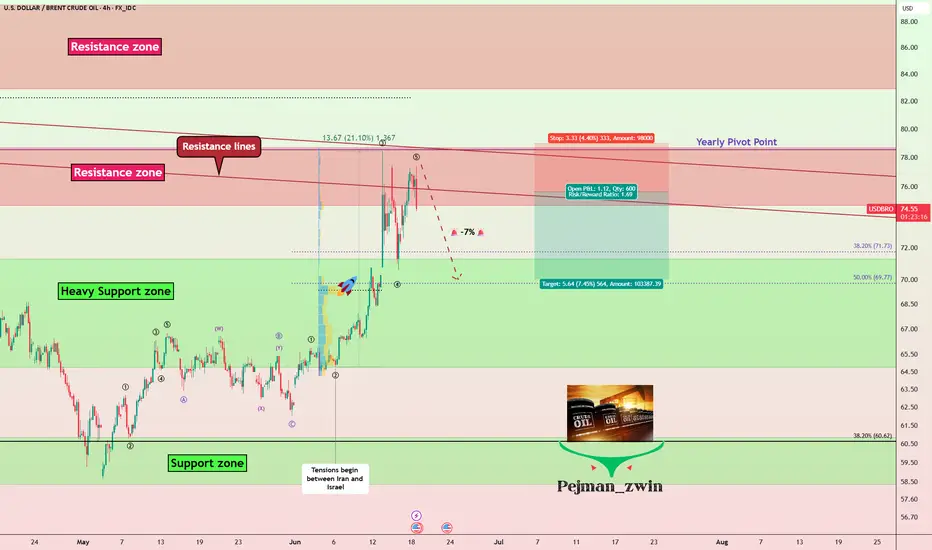
Geopolitics vs. Technical: Will Oil Correct -7%?Oil ( FX_IDC:USDBRO ) rose more than +20% after the start of tensions between Iran and Israel on Friday . I hope this tension ends as soon as possible because tensions have no winners.
The behavior and price movements of oil will certainly depend on the increase or decrease of tensions in the Middle East , but for the coming hours we can have a technical view .
Oil is currently moving in the Resistance zone($78.70-$74.70) and near the Resistance lines and the Yearly Pivot Point .
In terms of Elliott Wave theory , it seems that Oil has completed the second five-impulse waves . So that wave 5 is Truncated .
I expect Oil to decline in the coming hours, this decline could be -7% .
Note: If the USA is added to the Middle East tensions, Oil prices could rise again, so pay more attention to capital management.
Note: Stop Loss: $79.00
Please respect each other's ideas and express them politely if you agree or disagree.
U.S. Dollar/ BRENT CRUDE OIL (USDBRO), 4-hour time frame.
Be sure to follow the updated ideas.
Do not forget to put a Stop loss for your positions (For every position you want to open).
Please follow your strategy and updates; this is just my Idea, and I will gladly see your ideas in this post.
Please do not forget the ✅' like '✅ button 🙏😊 & Share it with your friends; thanks, and Trade safe.
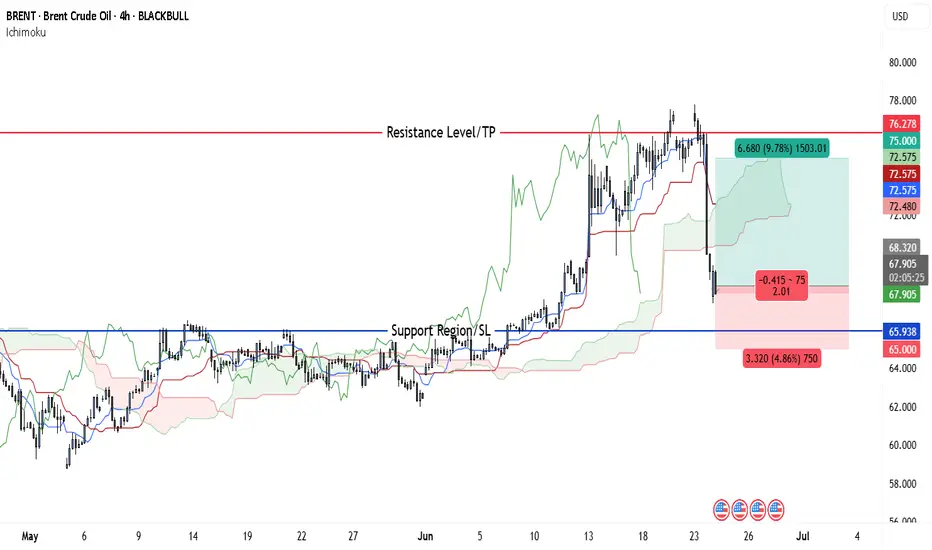
Crude Could Rally to $75 — Entry Opportunity Still Alive at $68Brent Crude Oil is setting up for a potential bullish continuation on the 4-hour timeframe. After a sharp pullback from its recent high near $76.28, price found support around the $65.93–$66 zone—an area that previously acted as strong resistance and now serves as a bullish flip level. The price is consolidating above this reclaimed support and forming a base within the Ichimoku cloud, indicating a possible accumulation phase before the next leg higher.
Ichimoku components support the bullish outlook: the cloud remains green, the Tenkan-sen is curling upward, and price is stabilizing above both the Kijun-sen and the flat Senkou Span A. These are typically early signs of a bullish continuation. The bullish thesis is further strengthened by broader geopolitical risks, particularly Iran’s increased influence over the Strait of Hormuz, which remains a critical oil transit route. Any disruption in this corridor could immediately pressure global supply and send oil prices higher.
This aligns with recent bullish projections (not exactly with the pricing but with the intent): Citi forecasts Brent could reach $75–78 if Iran related disruptions cut 1.1 mbpd, while Goldman and JPMorgan warn $100–120+ spikes if the Strait of Hormuz is threatened. The Guardian notes the shipping chokepoint transports ~20% of global oil, and even brief disruptions could add $8–30 / barrel in volatility.
Trade Setup:
• Entry: $67–$68
• Stop-Loss: $65
• Take Profit: $75
This provides a risk-reward ratio of 1:4, with nearly 12% upside potential. Given the convergence of strong technical structure and real-world catalysts, this setup offers a compelling opportunity for bullish Brent traders aiming to catch the next breakout.