Megaphone Broadening Top Likely on SPXOver the last few months, the market has been increasingly difficult to trade as it searches for direction. Stop losses were triggered for longs on Oct 10, and shorts were equally liquidated on the run up beginning Oct 27th. What has formed is a broadening top, confirmed by two points of touch on each side of the pattern.
Broadening patterns can go in both directions, but supporting information suggests this is the end of the bull market:
On the weekly chart, there is a MACD cross.
There is a clearly defined 5 wave structure from the October 2022 bottom. It is a textbook example of Elliot Wave Theory.
Multiple analysts have shown that stock valuations are near historical extremes. It is highly likely that the market is in an AI bubble.
How am I trading this? I have sold all long positions. I am swinging puts that I will close out at the bottom of the megaphone. Once a breakout occurs, a pullback is highly likely to follow, even going so far as to return inside the pattern (60% of the time). If a pullback does occur, I'll load up on long dated puts to profit off a potential bear market.
Broadening

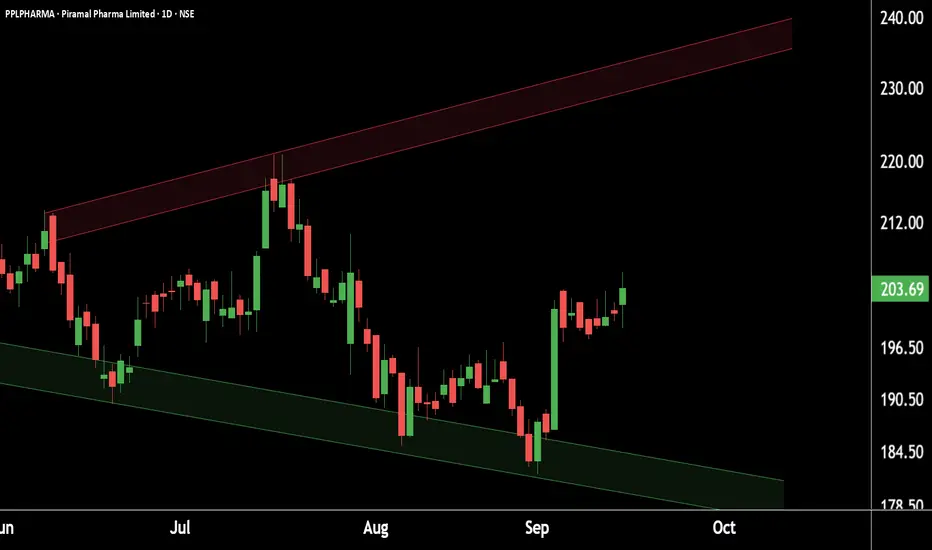
Piramal Pharma setting up for a breakout – pattern looks strong!This is the daily chart of Piramal Pharma (PPLPHARMA).
PPLPHARMA is forming a Bow & Tie pattern and has reversed from the support zone, currently sustaining in the ₹195–200 range.
If this level holds, we may witness higher prices with a potential upside target around ₹230.
Thank you !!
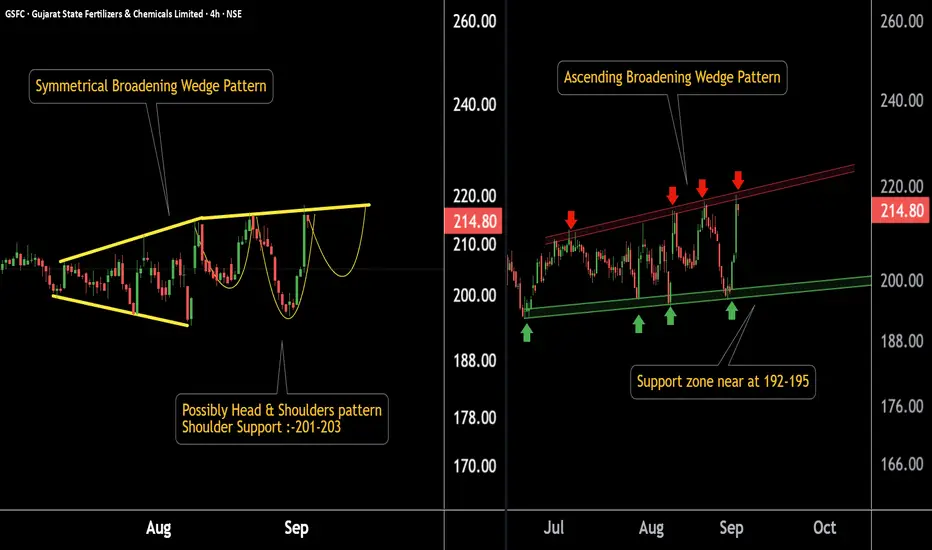
GSFC chart showing a hidden setup… Is this the breakout moment?GSFC Chart Update (4H Timeframe)
Chart 1:
Stock has formed a symmetrical broadening wedge.
If the stock respects the resistance, there is a possibility of a Head & Shoulders pattern.
Key support zone: 202 – 204.
Chart 2:
GSFC is forming an ascending broadening wedge pattern.
Support lies in the 192 – 195 range.
If this level sustains, potential pattern target is around 240.
Thank You !!
NASDAQ at Record Highs after US CPI report, but can it last?In today’s video, we break down the major market moves triggered by the July US CPI report. Headline CPI rose 0.2% month-over-month—right in line with expectations and a slowdown from the previous month. Year-over-year, headline inflation came in at 2.7%, just under the 2.8% forecast, while Core CPI rose 0.3% MoM (matching forecasts) but was a bit hotter at 3.1% YoY (vs. 3.0% expected).
These “not as bad as feared” inflation numbers kept hopes alive for a September Fed rate cut, pushing the odds of a cut to 96%. Markets responded strongly: the NASDAQ 100 closed at a record high, just shy of the 24K handle, with broad gains in tech and communication stocks, as traders bet on a more dovish Fed.
We also cover the technical setup for the NASDAQ 100 and key risk factors heading into the second part of August.
This content is not directed to residents of the EU or UK. Any opinions, news, research, analyses, prices or other information contained on this website is provided as general market commentary and does not constitute investment advice. ThinkMarkets will not accept liability for any loss or damage including, without limitation, to any loss of profit which may arise directly or indirectly from use of or reliance on such information.

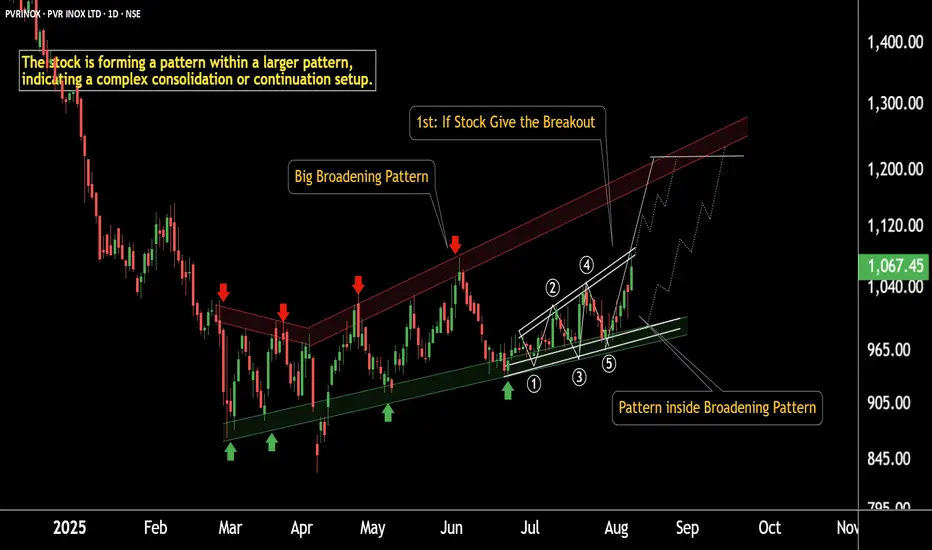
Breakout Alert: PVR Gearing Up for a Strong MoveThis is the daily chart of PVR INOX.
PVRINOX is forming a broadening pattern within a larger broadening structure.
The smaller pattern has a breakout target of ₹1200, which coincides with the major resistance level of the larger pattern.
PVRINOX having a strong support zone near at 970-990 zone.
If this level is sustain then we may see higher prices in PVRINOX.
Thank You !!
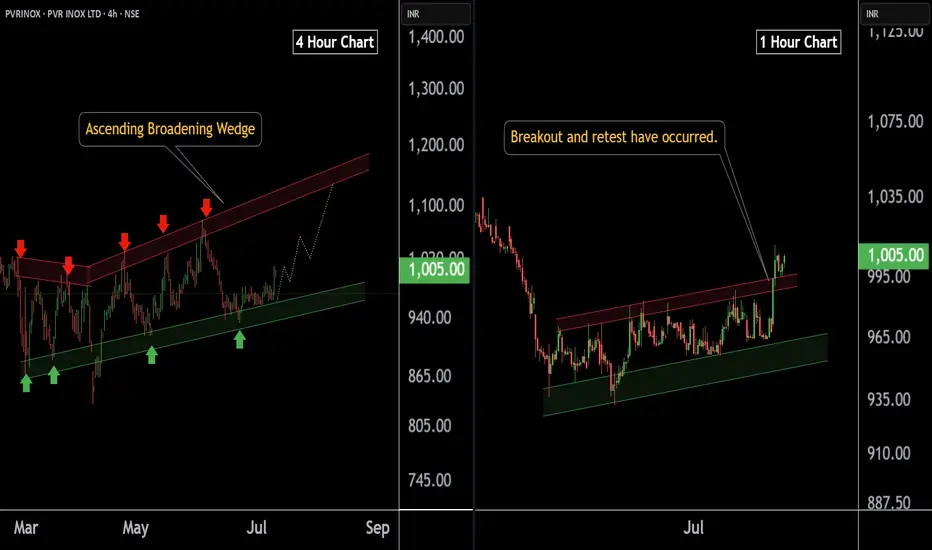
PVR INOX LTD at Best Support !! Breakout Alert !!Here are two charts of PVERINOX — one in the 4-hour timeframe and the other in the 1-hour timeframe.
4-Hour Timeframe Chart:
In the 4-hour timeframe, Power Inox is respecting its lower boundary, with a support range between 930–950.
ChatGPT said:
1-Hour Timeframe Chart:
In the 1-hour timeframe, the stock has given a breakout and has now completed a retest at 980-990 level.
If this level is sustain then , we may see higher in PVRINOX.
Thank you !!
VEDANTA LTD KEY ZONE..This is the 1 hour chart of VEDL.
VEDL is currently trading near its pattern (Broadening) resistance zone in the 462–465 range.
The stock is trading with in a channel, with its support zone in the 440–445 and resistance zone 485-495 range on the hourly chart.
If this level is sustain,we may see higher prices in VEDL
If VEDL breaks below its support zone, we may see lower levels around 415-405 range .
THANK YOU !!

Bitcoin Ascending Broadening Wedge (4H)After a clean breakout above the macro downtrend, BINANCE:BTCUSDT rallied into its supply zone — but price action has since become increasingly volatile, forming a rising broadening wedge (also known as a megaphone pattern).
Pattern Insights
• The structure is defined by diverging trendlines, with each swing becoming larger and more erratic.
• This pattern often signals instability or exhaustion, especially near key resistance.
• While it can break either way, broadening wedges in an uptrend frequently resolve to the downside, especially when supply is overhead.
Key Levels
• Resistance: ~$ 98K-$99.5k supply zone — the upper boundary of the pattern.
• Support: ~$93.5k area — prior S/R, potential flip zone.
• Reversal: A breakdown below ~$93k could confirm a short-term bearish resolution and open the door to ~$88.5k.
• Continuation: A breakout above the upper boundary with volume could trap shorts and ignite a squeeze toward new highs.
Until then, BTC remains in a high-volatility structure, best approached with caution or as a range-trading opportunity.

Market Outlook for 2025: SPY Price TargetsMarket Outlook for 2025: SPY Price Targets
As we navigate through 2025, investors and traders are closely monitoring the S&P 500 ETF (SPY) for signs of where the market might head. Here’s a detailed monthly breakdown of expected price movements:
January:
Downside Target: $574.15
Upside Target: $593.15
Outlook: The new year begins with a cautious note, with a narrow trading range expected. The market might see early profit-taking or a response to late-year 2024 policy news.
February:
Downside Target: $563.75
Upside Target: $589.13
Outlook: February might continue the cautious trend from January, with potential for a slight recovery if early-year economic indicators are positive.
March:
Downside Target: $561.78
Upside Target: $601.45
Outlook: Spring might bring some optimism, with the upside target suggesting a possible rally, perhaps due to seasonal adjustments in investment strategies.
April:
Downside Target: $538.23
Upside Target: $567.03
Outlook: This month could see a dip, reflecting concerns over quarterly earnings or macroeconomic data. However, the upside potential indicates a possible quick recovery or stabilization.
May:
Downside Target: $549.27
Upside Target: $592.61
Outlook: Traditionally, May can be volatile, but the significant upside target suggests optimism, possibly fueled by positive corporate guidance or sector performance.
June:
Downside Target: $572.31
Upside Target: $614.92
Outlook: Summer starts with promise, with a wide range between targets, indicating potential for significant market movements based on mid-year reviews or policy changes.
July:
Upside Target: $618.20
Downside Target: $597.21
Outlook: July might see continued growth from June, with the upside target slightly higher, suggesting sustained investor confidence.
August:
Upside Target: $623.45
Downside Target: $593.93
Outlook: The summer could end on a high note, but with a notable downside risk, reflecting market reactions to economic reports or geopolitical events.
September:
Downside Target: $598.52
Upside Target: $615.57
Outlook: Historically, September is a turbulent month for markets. The narrow range suggests cautious trading with a slight bias towards an upward trend.
October:
Upside Target: $629.96
Downside Target: $597.17
Outlook: October might see a recovery or continuation of September's trends, with a significant upside potential if the market absorbs positive economic news.
November:
Upside: $631.56
Downside Target: $618.20
Outlook: Late-year optimism could drive prices up, with the downside target still above previous months' peaks, indicating a bullish sentiment.
December:
Upside Target: $645.83
Downside Target: $632.32
Outlook: The year might end on a high, with both targets suggesting a market that's resilient or buoyed by end-of-year adjustments and holiday spending.
Conclusion:
This outlook for 2025 suggests a year of volatility with significant potential for both gains and corrections. Investors should remain vigilant, adapting to both the micro and macroeconomic environments, and be ready to capitalize on or hedge against these projected movements in SPY. Remember, these targets are speculative and should be used in conjunction with broader market analysis and individual investment goals.

"Scenario B" for Potential Bearish of Broadening WedgeThe 1st scenario is Broadening Wedge with rebound and break resistance, and then raise to another record with possible to break $2700 first.
In this "scenario B" , I try to make some exception for the resistance. Concern the resistance is too strong after the rebound, therefore we will find the correction until it break the support. After that we will find some retrace or swing high about 50% of last wave, and continue with the pressure to 2614 which is known as point B or point 2.
After the dip correction, please becareful with new demand probably will push the price for another uptrend. Well at least it corrected first before making new high on NFP next friday, right?

Broadening Wedge Pattern in JKCEMENETOn Daily timeframe, Broadening wedge pattern breakout occured in JKCEMENT near 4600 level. after this breakout expected strong upside rally upto 5016+ level with intermediate target of 4800 in this stock. This breakout will fail if stock starts trading below 4450 level.

ADA - A good opportunity for LONG tradeBINANCE:ADAUSDT (1D CHART) Technical Analysis Update
ADA is currently trading at $0.6642 and showing overall bullish sentiment. Currently ADA has formed a broadening wedge pattern and now the price is bouncing from the support line. We have a good opportunity a long trade.
Use smaller capital than normal
Entry level: $ 0.6639
Stop Loss Level: $ 0.5606
TakeProfit 1: $ 0.72
TakeProfit 2: $ 0.79
TakeProfit 3: $ 0.88
TakeProfit 4: $ 0.96
Max Leverage: 3x
Don't forget to keep stop loss.
Follow Our TradingView Account for More Technical Analysis Updates, | Like, Share and Comment Your thoughts.
Cheers
GreenCrypto

Vuvuzela Pattern for the JSE ALSI 40 target to blow up to 75000 Well, well, well, we've identified the tumultuous and monotonous pattern on the chart finally.
It's known as a Broadening Triangle or what I call a Vuvuzela Formation.
The price diverges instead of converges in a triangle pattern...
Now this can be a continuation or a reversal pattern. It all depends on the breakout.
Looking at the D&S and liquidity it looks like the JSE really wants to break above the formation and head to new highs of the year.
75,000 is a decent first target...
Also with Smart Money Concepts we can see there is a Sell Side Liquidity Order Block showing how Smart Money is sweeping selling and buying into it, hence there isn't a major push down in price just yet...
I'm bullish with this Vuvuzela. Now we need the JSE to blow up.

Trading the MegaphoneEuro is trending up while the dollar is heading lower. We're at the bottom of the broadening formation, a break in LTF structure is a good trigger for a long to the top of the megaphone, not that I believe in LTF structure breaks per se - I'm already long.
Trade will take 2 - 4 days I expect. You can take profit at the top of structure (BSL), at the top of the broadening formation or at the daily swing high all the way up at 1.236 :)

Bearish on Bajaj AutoBajaj Auto (NSE Ticker: BAJAJ_AUTO) is forming two back to back bearish patterns on the hourly chart.
First bearish pattern: Broadening formation
Second bearish pattern: Head & Shoulders
We see high probability of fall in price in the coming days toward measured move and 200SMA target of 4410.

📢 The Broadening FormationA technical chart pattern recognized by analysts, known as a broadening formation or Megaphone Pattern, is characterized by expanding price fluctuation. It is represented by two lines, one ascending and one descending, that diverge from each other. This pattern typically appears after a significant increase or decrease in security prices and is denoted by a sequence of higher and lower turning points. Normally this pattern is visible when the market is at its top or bottom. The greater the time frame is better the pattern will work.
🔹How to identify
Generally, the Broadening Formation consists of 5 different swings. But the swing has to have a minimum of two higher highs and two lower lows. A trend line is drawn by connecting point 1 and point 3 while points 2 and 4 are also joined together to draw a line.
These two lines create a shape that looks like a megaphone or inverted symmetric triangle. These swings’ highs and lows have to close above or below its pivot line and therefore they will create swing high as pivot high (R1, R2, and R3) and swing lows as pivot lows (S1, S2, and S3).
A breakout occurs when the line does not respect its support or resistance line and closes outside the shape after making the 5th swing.
🔹Volume
Volume plays an important role when it comes to the recognition of this pattern.
In the Broadening Top, volume usually peaks along with prices.
An increase in the volume, on the day of the pattern confirmation, is a strong indicator.
🔹Failures
This pattern also can be traded when it fails but is necessary to identify the failure perfectly.
A failure can be spotted when it fails to break the trend line (upper or lower as the case may be) after completing the 5th swing.
Suppose in a bull market condition, this pattern is formed and if it fails to break the upper trend line, traders go short when the price goes below 3rd swing high (R2).
Similar is the scenario, when the market is in a bear phase and it fails to break the lower trend line (S2), traders take a long position when the price closes above the 3rd swing high.
👤 @AlgoBuddy
📅 Daily Ideas about market update, psychology & indicators
❤️ If you appreciate our work, please like, comment and follow ❤️

Long sdowI don’t see how the market continues on an uptrend after cpi, and the Dow is seriously overextended
Reasoning:
Trendline, daily, weekly and monthly supports
Weekly price exhaustion
Bottom of broadening pattern
Favourable volume

PEOPLEUSDT broadening pattern in ActionThe price is testing the daily resistance inside a broadening pattern.
At the moment the price is testing the 0.5 Fibonacci level on the Daily timeframe.
How to approach it?
IF the price is going to have a clear breakout and retest the resistance as new support, According to Plancton's strategy , we can set a nice order
–––––
Keep in mind.
🟣 Purple structure -> Monthly structure.
🔴 Red structure -> Weekly structure.
🔵 Blue structure -> Daily structure.
🟡 Yellow structure -> 4h structure.
⚫️ black structure -> <= 1h structure.
–––––
Follow the Shrimp 🦐

AXP: Broadening with H&S ConfirmationMain Pattern: Weekly Broadening
the confirmation is on the pullback of the fifth retracement, and it happened with head and shoulders

AUD NZD broadening pattern ^I'm thinking AN will go up to continue this broadening pattern. It just tested the 50 MA, that might act bouncy with a great force.

CADCNH to Continue Lower?CADCNH has completed the broadening top pattern and the price is now in consolidation. I expect CAD to continue gaining strength against CNH and to reach the broadening top's objective, which lies near 5.
We can short the pair once the price breaks below the small consolidation trendline.

⚠️⚠️ ✔️ OR ❌️ ? Is it the bottom for #bitcoin? ⚠️⚠️Building on my previous $BTC logarithmic regression chart, there has now been an almost perfect bounce off of the yellow, dotted, inversion-curve line. This coincides with daily, weekly and monthly RSI's being at extremely oversold levels with the 4hr RSI moving down into oversold territory. Personally, all my limit orders were hit perfectly so it seems I may have at least bought "A" bottom here. This abrupt price drop also has now created a broadening edge pattern, which typically will break to the upside when formed at the bottom of a downtrend. All of these confluences may just spell the final bottom price for $BTC in the short term and validate my "inversion-curve" theory. Of course this can still be invalidated by a close below the inversion-curve line. If that occurs, I would still believe an inversion could be possible, but over a much longer time period. In that scenario, my target range for a price bottom would be between $10,770 & $12,694.
#btcinversion #btcbottom
*These are my personal opinions, based on chat data. This is not financial advice.*

Elrond (EGLD) Surged 24% Today as the Broader Crypto Market SlipToday, the cryptocurrency project Elrond saw a surprising double-digit surge of 24% in the price of its native coin EGLD. In contrast, the overall crypto category slipped 2% as investors processed through the Federal Reserve's decision yesterday to increase interest rates by 0.75% -- marking the largest single-day hike since 1994.
EGLD is often called eGold, which seems fitting today as its price across cryptocurrency exchanges jumped as high as $57.50 over the past 24 hours -- it has retraced a bit since then, however. It also had a whopping 85% pump in trading volume over the same timeframe as a mini-FOMO run that appears to be occurring around one of the few bright spots today within the crypto space.
At the time of writing, most other cryptos in the top-10 projects based on market value were trading down including Bitcoin, Ethereum, BNB, Cardano, and XRP. By comparison to those other blockchains, Elrond's website boasts that it's 1000 times faster than it used to be and able to process 15,000 smart contracts per second while providing settlement for each of those transactions in seconds for only fractions of a penny.
