IS BITCOIN READY FOR A HUGE PUMP?!!!!!! (must see) Yello Paradisers! Enjoy the video!
And Paradisers! Keep in mind to trade only with a proper professional trading strategy. Wait for confirmations. Play with tactics. This is the only way you can be long-term profitable.
Remember, don’t trade without confirmations. Wait for them before creating a trade. Be disciplined, patient, and emotionally controlled. Only trade the highest probability setups with the greatest risk to reward ratio. This will ensure that you become a long-term profitable professional trader.
Don't be a gambler. Don't try to get rich quick. Make sure that your trading is professionally based on proper strategies and trade tactics.
Btc!

Bitcoin 2026- Simple chart : Trend corridor, RSI deeply oversold, Green Bubbles lead the way.
- Whether Bitcoin bottomed at 60k or dips to 50k or even 40k doesn’t really matter.
When it’s trading at 250k+, those differences fade into noise.
- Markets don’t reward perfection, they reward patience, risk management, and timing that’s good enough. If anyone had a magic trick to nail the perfect entry, we’d all be rich already.
- Now is the time to accumulate with discipline through DCA, not to amplify fear or noise.
- As traders, we adapts and executes a plan. We don’t panic over headlines or try to catch the exact bottom.
Happy Tr4Ding!

COIN, Elliot wave degree changed, Wave 2 complete?NASDAQ:COIN has a larger sell off then expected completely falling out of its rising wedge. This suggests that the top was a wave 1, completing 5 wave ups diminishing with wave V, with a poke above all time high, IPO launch.
The Elliot wave count is textbook. Wave C of 2 looks to have complete 5 waves down, just below the weekly 200EMA at the major High Volume Node support, 0.382 Fibonacci retracement. While the trend remains down and below the weekly pivot I think Friday was a capitulation event and we move up from here. Theres always a sweep of the lows possible first.
Friday closed at the daily candle high, showing investor confidence to hold over the weekend news and BTC price cycle.
Weekly RSI is tapping oversold, with slight hidden bullish divergence.
Safe trading

CLSK Still in a triangle, nothing change on the weekly/macroNASDAQ:CLSK remains firmly in the macro triangle boundaries and has not penetrated wave E on last weeks dumping price action.
In fact, wave (2) is still alive and now printing weekly bullish divergence!
Fib depths for the triangle remain deep 0.786+ which is a characteristic of triangle.
Price left a long lower wick and Friday closed at the high of a 22% bullish engulfing daily candle. Closing at the high on a Friday is a significant move as it shows investors are confident in holding over the weekend news cycle and Bitcoin price action.
The goal is still to break wave D to end the triangle and thrust us in our final move to take profits around $40. This will be highly likely one we get back above the weekly pivot and 200EMA ~£14.
Safe trading

BITCOIN - LONG - Value Holds While Leverage PanicsBitcoin 4H Analysis
Price is currently trading inside the Point of Control of the Jan 14 impulse up. This is a high participation area where both buyers and sellers have done the most business, making it a key decision zone.
As long as we hold this PoC, the market is accepting value. A clean acceptance and breakout from this range opens continuation toward Target 1 at ~80k (Zone 1), followed by Target 2 at ~92.5k (Zone 2), both aligned with higher timeframe liquidity and fib-based resistance clusters.
Order flow perspective
Spot CVD is showing a clear bullish divergence. While price went sideways to slightly lower, spot buyers continued to step in. This signals real demand absorbing sell pressure rather than chasing price.
Stablecoin-margined futures CVD remains firmly negative. Perp traders are still selling and pressing shorts without downside expansion. Coin-margined futures CVD confirms the same behavior, showing leverage positioned defensively.
Open interest across both stablecoin and coin-margined contracts continues to bleed. This suggests leverage is being flushed rather than new risk being added, which supports a basing structure.
Accumulation / Distribution
The A/D indicator is turning up after a sharp downside sweep. Despite the volatility, accumulation is increasing, which confirms that smart money is absorbing supply during consolidation rather than distributing into strength.
Coinbase spot flow
Coinbase Spot CVD is trending hard up. Large spot participants are aggressively accumulating while derivatives remain skewed short. This divergence historically favors upside resolution once price exits value.
Summary
We are trading at value. Spot is leading, accumulation is increasing, leverage is leaning the wrong way, and acceptance above the PoC sets the stage for continuation into ~80k first, then ~92.5k. Until value is lost, downside looks corrective rather than impulsive.

BTC macro trend, good place to start DCA for the next 1-2 yearsSeeing us hitting a new low soon unless we already did; 200 EMA on the weekly is a huge support for BTC

$BTC - Intraday OutlookCRYPTOCAP:BTC | 2h
72k is acting as a clear area of resistance for now.
Not much follow-through yet and price is still stuck in chop. For the time being, I’m expecting more rotation within the 67–72k range rather than a clean directional move.
If we get a deviation into 66–65k sweeping those lows, that’s where I’d be more interested in looking for a long, ideally setting up a rotation back toward 74–76k, assuming acceptance and momentum start to build.

BTCUSD: Structural Recovery and Demand Zone Defense – Target 78kMarket Context: Bitcoin is exhibiting a strong bullish recovery on the 15-minute timeframe after successfully defending the major demand zone near 64,911. This level has served as a solid structural floor, leading to a decisive momentum shift.
Technical Breakdown:
Demand Zone Defense: The price found aggressive buying interest at the 64,911 level, initiating a "V-shaped" recovery and reclaiming previous local resistance.
Structural Momentum: We are observing a series of higher highs and higher lows, with the price now pushing toward the blue ascending trendline.
Projected Trajectory: The analysis anticipates a minor corrective retest of local support followed by an impulsive move to clear overhead supply.
Liquidity Targets: The primary objective for this move is the significant supply cluster located near 77,916.
Trade Execution Details:
Entry Area: Around 68,725 – 69,360 (Current Market Interest).
Stop Loss (SL): 64,911 (Safely placed below the demand floor).
Take Profit (TP): 77,916 (Major overhead liquidity target).

Unlocking Altseason: Chart Signals You Can't IgnoreAltseason without myths: what actually shows up on charts before alts go crazy
Everyone loves to say “altseason is coming” the same way kids say “summer is coming” in March. Feels good, zero responsibility.
But altseason isn’t magic. It’s just money rotating. And that rotation leaves fingerprints on the charts way before your favorite microcap does +500%.
Let me walk you through the main conditions I usually want to see before I start taking alt setups seriously – not memes, not hopium, just price.
1. King Bitcoin does his move first
Healthy altseasons rarely start from flat Bitcoin.
Typical pattern:
- First, a strong impulsive move up on BTC
- After that move, BTC stops trending and starts chopping in a range
- Volatility cools down, candles get smaller, volume drops
TL;DR: Big boys rode BTC, locked in chunky profits, and now their fresh capital is looking for higher beta plays. That’s when alts start feeling “lighter”.
If BTC is nuking or making fresh parabolic highs every day, alts usually just get dragged around like bags on a train.
2. BTC dominance stops climbing and starts bleeding
Open BTC.D (Bitcoin dominance) and zoom out.
Before most big alt runs, I usually see:
- A clear uptrend in dominance while BTC is running
- Then a topping structure: double top, lower high, or a fake breakout above the previous high
- And then – the key part – a confirmed breakdown with lower lows
That’s literally money leaving BTC relative to alts.
No need to overcomplicate:
Rising dominance – market respects Bitcoin.
Falling dominance – market starts gambling on the side quests.
3. ETH vs BTC wakes up
ETHBTC is my canary in the coal mine.
If ETH can’t even beat BTC, why should I expect your random GameFi coin to do it?
Before many altseasons I’ve watched:
- ETHBTC prints a base or higher low
- Breaks local resistance
- Starts grinding up, even if slowly
ETH often leads the rotation. When this pair wakes up, liquidity is starting to accept “more risk”.
4. Total alt market cap breaks structure
Open TOTAL2 or TOTAL3 – that’s your x-ray of altcoins as a whole.
What I like to see:
- A clear downtrend turning into a sideways accumulation range
- Higher lows forming under a big horizontal resistance
- Breakout of that resistance with expanding volume
That’s not your random lucky pump – that’s the whole sector getting repriced.
5. Volume rotation: BTC quiet, alts noisy
Check the volume bars:
- BTC: volume fades while it ranges
- Major alts: volume spikes on green days, pullbacks on lower volume
That’s exactly what “rotation” looks like. Money doesn’t appear from nowhere – it walks from chart to chart.
Maybe I’m wrong, but I think “altseason” is mostly a marketing word influencers use when they ran out of Bitcoin content. On charts it’s just a sequence:
BTC pumps → BTC chills → dominance tops → ETHBTC turns → alt market cap breaks out → volume rotates.
Last nuance: don’t try to guess the exact start like it’s New Year’s midnight. Focus on conditions, not dates. When several of these signals line up, I start hunting alt setups. When they disappear, I stop dreaming about 50x and go back to trading what the market actually gives.
In the end, altseason is just greed with a chart pattern. Learn to spot the pattern – and the greed will find you on its own.

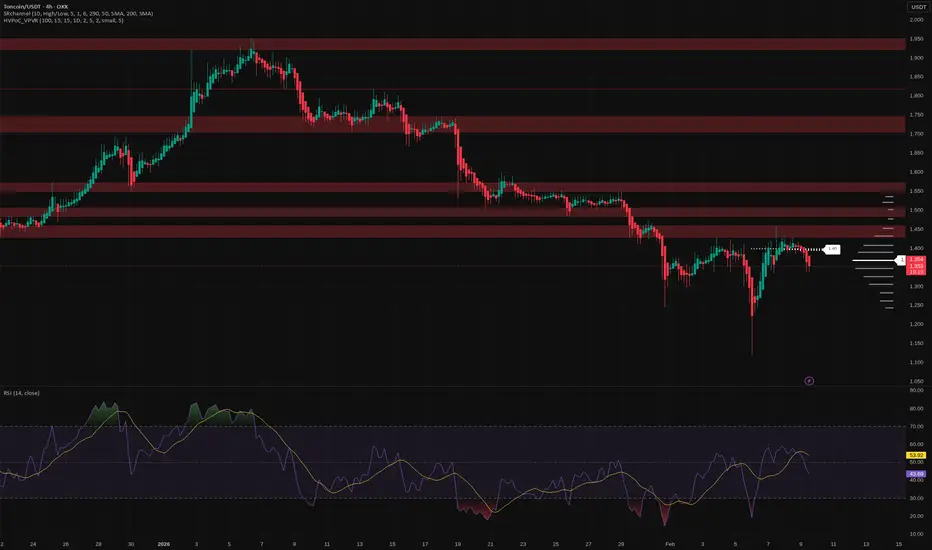
Toncoin: bounce or breakdown? key levels to watch this weekToncoin. Tired of watching it bleed or ready to trade the bounce? After the hype around its ecosystem partnerships and the recent shakeout across majors, Toncoin is still stuck in a heavy downtrend and every pop is getting sold into, according to market chatter. Volatility is back, which means opportunity if you’re precise with levels.
On the 4H chart price is pressing under a chunky supply area around 1.38-1.40 with repeated rejections there and point of control slightly below. RSI made a lower high while price retested that zone - classic bearish divergence. With that and the dominant downtrend, I lean short bias, expecting sellers to defend 1.40 unless some fresh catalyst brings real spot demand.
My base plan: as long as 1.40 holds as resistance, I expect a slide toward 1.32, then 1.26-1.22 where the next demand cluster sits ✅. If buyers suddenly push and we get a clean 4H close above 1.40 with volume, that invalidates the short idea and opens the door to 1.47 then 1.55 ⚠️. I might be wrong, but for now I’m hunting shorts near 1.38-1.40 with tight risk above the range high.
ASTER Rejected at Resistance — Support Retest LikelyASTER has just faced a rejection at a key resistance level, signaling a potential move back down toward support. This pullback could offer a solid opportunity for bulls to re-enter if price stabilizes. The current structure remains valid as long as price doesn’t break below the invalidation zone.
🔔 Trade Setup
Entry Zone: $0.56 – $0.57
Take Profit Targets:
• TP1: $0.64
• TP2: $0.70
• TP3: $0.80
Stop Loss: $0.48
Risk management is key. Wait for confirmation.

BTC/USDT 1H Short-Term🔎 Market Structure
• We are still in an uptrend (higher lows, price holding above the black trend line).
• The recent downward move looks like a trend correction, not a trend reversal.
🟥🟩 Key Levels
Support:
• 69,670 – very important level (reaction + prior consolidation)
• 68,780 – last strong low, dynamically defended
• 67,340 – critical support, its loss = structure change
Resistance:
• 70,340 – current price, local resistance
• 71,360 – range high / supply zone
• 72,230 – upper resistance, target on breakout
📈 Price Action
• The bounce from ~68.8k was impulsive → demand is entering aggressively
• Now we have a pullback / consolidation below resistance ~70.3k
• No strong rejection = the market is gathering strength, not distributing
📉 RSI / Stoch RSI
• Stoch RSI: high, possible short cooldown (small Pullback or sideways)
• Classic RSI: returns above 50 → bullish signal
• No bearish divergence (this is important 👀)
🧠 Scenarios
✅ Bullish:
• Holding 69.7k
• Breakout of 70.5k → attack on 71.3k, then 72.2k
⚠️ Corrective:
• Rejection of 70.3k
• Pullback to 69.7k / 69.0k
• Only from there another attempt at an upside
❌ Bullish Negation:
• Close of H1 below 68.7k
• Then target: 67.3k and change of bias

BTCUSD — Structure FirstAfter the recent liquidation-driven sell-off, BITSTAMP:BTCUSD has entered a very different phase.
Momentum is gone, volatility has compressed, and price is no longer behaving like it did during the impulsive advance that preceded the correction.
From a structural point of view, this move looks less like the start of a new bearish trend and more like a reset within a broader cycle. Higher-timeframe supports are still holding, and instead of continuation to the downside, price has stabilized and begun to balance.
This type of behavior usually appears between phases, not at the beginning of a strong directional move.
From a fundamental perspective, the picture is equally mixed.
Liquidity conditions remain tight, rate expectations are still uncertain, and risk assets are highly sensitive to macro data and policy communication. At the same time, Bitcoin is no longer trading in isolation — ETF flows, institutional positioning, and broader market correlation are now part of the equation.
In this environment, extremes tend to be punished.
Price needs time to absorb information, reposition participants, and rebuild structure.
That is why, at this stage, structure matters more than narrative.
Key Levels
Major structural support: 65,000 – 68,000
This is the area that separates consolidation from continuation. As long as it holds, the broader structure remains constructive.
Current acceptance zone: ~70,000
Price is stabilizing here. Acceptance or rejection around this level will define the next leg.
First meaningful resistance: 78,000 – 80,000
A clear supply zone where reactions are likely.
Higher-timeframe supply: 90,000+
A reference level if the market successfully rebuilds bullish structure.
Trade Framework
Base case (balance / recovery):
Acceptance between 70k–72k favors a rotation toward 78k → 80k → 85k.
This scenario assumes continuation of consolidation and gradual structure rebuild.
Recovery continuation:
Sustained acceptance above 74k–75k opens the path toward 85k → 90k, suggesting renewed confidence and participation.
Bearish continuation:
A daily close below 68k would invalidate the balance and shift the focus toward 62k and 58k as next downside areas.
Bitcoin is not in a momentum phase right now.
It is in a decision-making phase, shaped by both technical structure and a complex macro backdrop.
The reaction around 68k, 70k, and 78k will be far more important than short-term headlines.
Until structure resolves, patience and level-based execution remain the edge.
Illyrian Finance — Trading structure, not predictions.

BITCOIN: WHY!? Long-Term Structure Still IntactIt's time to be real..
Everyone is calling for an immediate bull run, or bull run soon, but markets don't move on excitement - they move in cycles.
Bitcoin has always required time, consolidation and patience before its next expansion phase. Price rarely moves in straight lines, especially on higher timeframes.
This weekly chart highlights the broader structure and long-term trend rather than short-term noise. If history continues to rhyme, the coming phase is more likely to be a a boring continued consolidation and accumulation phase, not instant acceleration. For those that know, the "boring" phase is often the most exciting. When everyone's portfolio has been hit hard followed by some up and down consolidation for long period of time, that's when they get the "i better sell, this is BS" attitude. That's when i buy with excitement.
The goal here isn't to predict a top or bottom, but to respect structure and allow the cycle to play out. Patience is often the hardest part - and usually the most rewarding.
So everyone wants prices and dates right? Well looking at the chart, I suspect that we have already hit the bottom lows of 60k, and the boring accumulation is about to begin. This will go for a year, most will not be able to cope. We will be bouncing around the bottom of the parallel channel a few times around 64k again.
When's the next bull run you ask? well i suspect it won't officially start until early to mid 2027.
SAVE this chart, track as time goes on.
Cheers,
Activeaus

XRPUSD 1H Chart Targets...XRPUSD – 1H Chart Targets 📊
Based on the chart (strong sell-off → demand reaction + Ichimoku resistance above):
🔍 Market Bias
Short-term Bullish Pullback (Relief Rally)
Overall trend still bearish until major resistance breaks.
📈 Buy Setup (from demand zone)
Buy Zone:
1.22 – 1.25 (highlighted demand area)
Targets:
🎯 TP1: 1.45
🎯 TP2: 1.55
🎯 TP3: 1.60 (major resistance / marked target)
Stop Loss:
🛑 Below 1.18
⚠️ Trade Notes
This is a pullback trade, not trend reversal
Expect rejection near Ichimoku cloud
Secure partial profits at each target

Bitcoin(BTC), has yet to reach a cyclical low.BINANCE:BTCUSDT
It’s been about four months since my post calling the end of Bitcoin’s bullish season, and here is an updated cycle-based outlook.
(CME chart during the 22-year bear market)
After forming a downside gap near the 81K level, Bitcoin saw a one-way selloff down to around 60K, followed by a technical rebound.
I believe this 81K gap is likely to be filled in the next bullish cycle, similar to the price action observed during the 2022 bear market.
From a cycle perspective, the macro bottom is expected to form around August–September 2026. Until then, Bitcoin may continue moving in a prolonged consolidation phase driven more by time correction than sharp price movements.
My projected downside target zones are:
• Primary zone: 49K–52K
• Deeper correction: below 39K
• Extreme scenario: toward the 32K region
However, if price moves up first and fills the 81K gap, this bearish cycle scenario will be invalidated.
Your follow and boost would mean a lot. 🚀

CIFR Triangle path played out nicely..NASDAQ:CIFR triangle in wave B played out, following my path closely, touching the daily 200EMA and major High Volume Node support line, at the 0.236 Fibonacci retracement. This is a highly probable place for wave 4 to end.
Triangle are a penultimate pattern, so that thrust lower last week should mark the end of the downtrend.
There is no divergence in the daily RSi and has a little room left to hit oversold but can do so on a bullish divergence without a new low.
Price closed Fridays candle at the highs +16% showing consumer confidence to hold over the weekend news cycle.
Safe trading

BTC — Range Deviation Play & Bear Flag TargetBitcoin continues to trade inside a clearly defined sideways range. Recently, the price made a deviation above the range high — a classic false breakout — and quickly returned back inside the channel, confirming the upper boundary as strong resistance.
Now, on the daily timeframe , the market is forming a bear flag , which typically acts as a continuation pattern to the downside. If this structure breaks lower, it opens the way toward the $68–67K zone , which aligns perfectly with the lower boundary of the range.
A move into this area would likely create a deviation below the range low, mirroring the earlier deviation at the top. Such symmetrical deviations often signal liquidity grabs before a potential mid-term reversal.
Key Points:
Range structure remains intact
Upper deviation confirmed — failed breakout
Daily bear flag suggests continuation lower
Target: $68–67K (potential lower deviation zone)
This scenario remains valid as long as BTC stays below the mid-range and the bear flag structure holds.

RIOT entering Wave (3) of 3 of III?This will be crazy if so...NASDAQ:RIOT has been trying to go on a tear for months, but keeps getting knocked back by broader economic and BTC uncertainty.
Price is testing the weekly 200EMA and previous range trend-line with RSI printing bullish divergence at the EQ, a bullish sign. Price recovered the weekly pivot, leaving a long lower, bottoming wick. All of this is just above the golden pocket Fibonacci retracement.
It closed Friday at the high of a 20% candle. Closing at the high on a Friday is a significant move as it shows investors are confident in holding over the weekend news cycle and Bitcoin price action.
Elliot Wave (3) of 3 of III will be crazy fast and bullish, hitting my $80 target at the very least.
Safe trading

SOLUSD (2H) chart pattern...SOLUSD (2H) chart pattern.
Market Structure
Strong overall downtrend (lower highs + lower lows).
Price is below the descending trendline.
Current price is consolidating inside a supply / resistance zone (red box).
Ichimoku cloud is above price → bearish pressure intact.
Bias = SELL continuation unless trendline is broken strongly.
🎯 Sell Targets (Primary Scenario) 🔴
Target 1 (TP1)
➡ 82.0 – 80.0
Recent demand
First liquidity pool
Target 2 (TP2)
➡ 75.5 – 74.0
Previous strong rejection area
Matches my marked TARGET POINT
Extended Target (If momentum is strong)
➡ 70.0 – 68.0
❌ Invalidation
A clean 2H close above 92.5–94.0
Break & hold above trendline + cloud = bearish idea fails
📌 Trade Plan Idea
Sell zone: 90.0 – 92.0
SL: Above 95.0
TPs: 82 → 75 → 70
Summary
✅ Trend intact
✅ Supply respected
⚠️ Wait for rejection candle for safest entry

ETHUSD – 2H (Chart pattern)...ETHUSD – 2H (Chart pattern).
What the chart is saying
Overall downtrend (descending trendline).
Price has broken above the trendline and is now holding above Ichimoku support (yellow cloud).
This looks like a trend reversal / pullback-buy structure, not a continuation sell.
Key levels I see
Current zone (buy area):
2,050 – 2,090
(inside the cloud + above broken trendline → good base)
🎯 Targets (Bullish continuation)
Target 1 (safe / partial):
2,300 – 2,350
Target 2 (main):
2,450 – 2,500
Target 3 (extended, only if momentum stays strong):
2,800 – 2,900
These match my marked “target points” on the right side of the chart.
🛑 Invalidation / Stop idea
Below 1,980 – 1,950 If price goes back under the cloud and holds there, bullish idea is weak.
Bias summary
Above 2,050 → Buy on dips
Below 1,950 → Avoid longs / reassess

BTCUSD: Successful Defense of 65k Demand Zone – Bullish RecoveryMarket Outlook: Bitcoin is showing strong structural resilience on the 15-minute timeframe after finding significant buying interest at the 64,911 – 65,000 demand zone.
Technical Breakdown:
Accumulation Confirmation: The price has formed a solid base following a recent corrective phase, with a clear "V-shaped" recovery emerging from the lows.
Trend Shift: We are observing the start of a new bullish cycle, marked by the reclamation of local resistance levels and a strong impulsive candle higher.
Projected Trajectory: The analysis anticipates a continuation toward the primary liquidity targets, as highlighted by the large bullish momentum arrow.
Key Objective: The main goal for this move is the major overhead supply cluster near 78,000.

This Volatility Period: February 6th - 8th
Hello, fellow traders!
Follow us to get the latest information quickly.
Have a great day!
-------------------------------------
(BTCUSDT 1M Chart)
The price fell from the critical 69,000 - 73,499.86 range.
We need to see if it finds support near the previous high of 57694.27 to 61299.80.
I believe the price range it cannot return to is below the 42283.58 to 43823.59 range.
-
(1D chart)
This period of volatility is expected to last from February 6th to 8th.
Therefore, the key question is how far it can rebound.
We need to see if it can rise to the critical 69000 to 73499.86 range.
If not, we need to see if it can rise above the left Fibonacci level of 0.618 (65760.59).
The next period of volatility will be around February 17th (February 16th-18th), so the key question is where the price will begin its sideways movement after this period of volatility.
The 57694.27-61299.80 range represents the previous high point, the first significant uptrend, and thus holds some significance.
The M-Signal indicator on the 1D chart is still forming at 87944.84, so we should also monitor whether it re-forms after this period of volatility.
This is because an uptrend begins when it meets the minimum DOM (-60) or HA-Low indicator.
-
Thank you for reading to the end.
I wish you successful trading.
--------------------------------------------------
- This is an explanation of the big picture.
(3-year bull market, 1-year bear market pattern)
I will explain in more detail when the bear market begins.
------------------------------------------------------
