Bitcoin weekly & EMA55 —Above $90,000 confirmedWe are now looking at Bitcoin on the daily timeframe, same chart. Notice EMA55, how it produced a strong rejection leading to three consecutive weeks closing red.
This week is the fourth week. It started red but it is uncertain if it will close red or green, which is irrelevant as we are going up.
Last week produced a long lower shadow. The low was $60,000 but the close was $70,330. A huge difference.
The same this week. A long lower shadow reaching $65,118 yet all selling has been bought already as prices continue to climb. This week has a higher low compared to last week; bullish.
Support was challenged on multiple fronts. The previous bull market all-time highs, April and November 2021, Fib. levels, etc. Bitcoin moved below these just to recover.
It was a brutal crash but it is now over.
This chart calls for a move toward EMA55. The same level that worked as resistance needs to be tested again to see if it holds or breaks. The same EMA377 daily analysis but on a bigger timeframe.
Just as it took weeks for Bitcoin to cover a space from $98,000 toward $60,000; It can take several weeks for Bitcoin to cover the distance between $60,000 toward $100,000. It can take a while before any major correction shows up.
Will there be a bearish continuation once the next move reaches its end?
It depends. If we get a higher high on the current move, higher than $100,000, the bear market being over will be confirmed. If we get a lower high... Oh well, things can get bad but we have to wait and see (the bear market is already over—higher high next). The market is turning green today.
Today is a special day.
Thank you for reading.
Namaste.
Btc!

Bitcoin & EMA377 —Headed towards $94,400A month ago, 14-January, Bitcoin stopped a small period of growth once it found resistance at EMA377. This level produced a strong rejection leading to a $60,000 crash.
Now that the market is turning, the bearish wave being over; the same level that worked as resistance will be tested again to see if it holds or breaks. This would give us a minimum target close to $94,400.
Based on Fibonacci levels, we have $83,903 as the next target with $100,000 also being possible.
Here we are using a different method to confirm that $83,900 is actually a very easy target, one that will definitely break on the way up. We can expect to see Bitcoin growing for months.
The same EMA377 daily matches EMA55 on the weekly timeframe. This further supports an advance above $90,000 on the current move.
After a small retrace Bitcoin is turning green today, but the bullish phase started 6-February. This phase can last 1-3 months before a correction shows up.
Remain open to all scenarios. Looking at the altcoins market, it is possible that the bear market is already over and we are set to experience long-term growth.
The first milestone and full bullish confirmation comes once Bitcoin moves and closes daily above $72,300. After this level the next resistance sits at $78,500 followed by 84K.
This move can take its time to unfold. As Bitcoin is confirmed bullish, the altcoins market will produce outstanding growth. Many are already moving up strong. And this is just day one.
Ethereum is already trading back above $2,000. A major bullish development.
The big three are green. The big projects are moving ahead. The smaller projects are also bullish. Everything will speed up. The market was bearish long enough.
Namaste.

#BTC #BTCUSD #BTCUSDT #BITCOIN #Update #Analysis #Eddy#BTC #BTCUSD #BTCUSDT #BITCOIN #Update #Analysis #Eddy
As I said in my previous signals and analysis, Bitcoin's fall occurred exactly according to my analysis. (I hope you used and enjoyed my previous signals and analysis)
Now what is the next move for Bitcoin in my opinion?
Considering the demand area that Bitcoin is confirming and the PRZ area and the important one, Bitcoin is likely to rise from the price range of $60,000 to $70,000 to the area of $103,000 to $109,000.
On the other hand, we are witnessing the formation of the Quasimodo "QM" pattern in the RMT style, and from the ICT point of view, we are witnessing CHOCH, and considering the LIT style and observing IDM, we can say that this structure can be the continuation of Bitcoin's movement. That is, the rise to areas above $100,000 and then continuing to fall towards $30,000.
I have identified important demand areas for you in higher time frames.
I have indicated for you the type of movement it can make from the specified areas with PATH arrows.
This analysis is based on a combination of different styles, including Dow and Wyckoff theories, as well as market structure and Quasimodo pattern in RTM style with a combination of ICT and LIT styles.
Get the necessary confirmations to enter the trade from this analysis based on your strategy and style.
Don't forget about risk and capital management.
You are responsible for the transactions and I am not responsible for your failure to comply with risk and capital management.
💬 Note: This is only a possibility and this analysis, like many other analyses, may be violated. Given the specific conditions of Bitcoin, it cannot be said with certainty that this will happen and this is just a view based on the RTM and ICT style and strategy with other analytical styles, including the liquidity style.
Be successful and profitable.
Review the result of my previous analysis of Bitcoin:

BTC: The "Liquidation Sandwich" & Falling Wedge SetupBTC sits at $69,214 inside the Discount Zone relative to the equilibrium ($78,866). We are currently compressing within a classic Falling Wedge pattern, holding above the critical Bullish Order Block demand zone ($65,081-$67,221). While the macro narrative is dominated by fear, the 4H structure reveals a "Liquidation Sandwich" where Smart Money is accumulating for a squeeze.
MARKET STRUCTURE & PATTERN 📐
Falling Wedge: Price has respected the descending resistance line (currently ~$82k) 11 times. This pattern typically resolves with an explosive upside breakout.
Demand Zone (The Shield): The Green Box on the chart ($60k - $64k) represents a massive wall of spot bids and $2.4B in long liquidations. We are looking for absorption here.
Supply Zone (The Magnet): The Red Box overhead ($72k - $75k) is the target. A dense cluster of $5.45B in short liquidations sits here, acting as a magnet for Market Makers.
INDICATOR CONFLUENCE 📊
MACD: Showing a clear Bullish Divergence with momentum shifting upward despite the price chop.
RSI (60.8): Neutral but climbing from oversold territory, indicating room for expansion.
EMA Support: Price is holding above the EMA20 ($67,748), maintaining the short-term bullish structure despite the fear.
THE MONOCOIN TRADE PLAN 🎯
We are avoiding the "chop" in the middle and playing the edges of the sandwich.
Scenario A (The Trap): A wick down into the $60,000 - $62,000 zone to sweep weak hands. This is the institutional Buy Zone.
Scenario B (The Breakout): A confirmed 4H close above $69,623 (Bollinger Upper Band) triggers the run to resistance.
Target 1: $72,300 (Short Liquidity Flush).
Target 2: $82,103 (Wedge Trendline Test).
Invalidation: A 4H close below $65,081 invalidates the immediate bullish order block.

BTCUSD Coming back to the trading lab, I’m filled with mixed feelings about the world and how I perceive the market after being here for almost ten years.
Being a trader is hard work. Anyone who tells you it’s easy or cheap is lying. Yes, some people grasp it quickly, and there are naturals—but I consider myself lucky, and I’ve also endured my share of struggles to earn my place as a trader today. The journey has been full of ups and downs. Returning now leaves me feeling exposed yet clear-headed, free from my usual anxieties and the rush for instant gratification.
All I want now is to relax on the beach, work from my laptop, drink a beer, enjoy good food, and spend time with great company. I deeply desire to become a successful trader—not just for the returns, but for the freedom it brings: the ability to work anywhere, everywhere, or nowhere at all.
Anyway, Bitcoin is at a good price to buy for the long term.
Blessings to you all.
Alex

BTC/USDT 1H CHART📊 1️⃣ Market Structure
➤ Access:
Clear descending channel
LH (lower high) + LL (lower low) series
Price respected the upper trend line
➤ Now:
💥 STRONG breakout from the downtrend
💥 Impulsive bullish candle
💥 Return above 68,400 (important level)
This is the first sign of a change in short-term momentum.
🧱 2️⃣ Key Horizontal
🔴 68,431
Former resistance → should now be support
If held = bullish signal
🔴 66,690
Strong local support
Loss = return to declines
🟢 69,751
First real target
🟢 71,131
Main target (high range)
🟢 72,722
HTF resistance / resolution
📈 3️⃣ RSI + Stoch RSI
RSI existed (breakout of 60)
Stoch RSI overbought
Meaning:
👉 interim summary / retest
👉 but momentum is on the consumer side

You will ask "how did he know Btc would do that"?On Nov 18th 2025 I suggested that Btc was headed for a bottom at $84K (+/-2K).
I expressed concerns about a very bearish move if price fell below $81K. On Nov 21st that low $80s target was hit. Only later to be violated to the downside.
On Nov 30th I suggested that Btc had bottomed at $80K & would bounce up to $98-99K and get rejected. On Jan 14th 2026 my target of $98K was hit with strange accuracy...and rejected as anticipated.
Once Btc was rejected at $98K, I suggested the recent lows at $80K would be swiped. I once again expressed concerns about a very bearish move if price fell below this local low.
Once the $80K low was swiped (T1), I suggested (on Jan 31st) that the next bearish target would be hit at $60K (+/-2K).
On Feb 6th, my $60K target was hit, and the anticipated significant bounce to follow (20%)
On Feb 6th, I outlined the typical bottoming structures and targets based on my studies of historical price action and statistical analysis. This lead me to expect a bounce from $60K to $71K (+/-1K)...and then a minimum retrace to $62-$65K
On Feb 6th my bullish target at $71K was hit and I suggested that it had met resistance and would be rejected down to my next bearish target ($62K-$65K).
That target of $65K was hit yesterday, as seen in today's chart.
Those that follow me know that I was warning of this significant drop since I mentioned the "three red week down rule" since Sept 2025. I said not only would btc soon crash, but also top alts would follow (ie xrp). This chart called the top for Xrp:
This chart called the top for Btc:
TA works! It works on all assests, in all time frames, across all markets. The question is how? How can someone like me be so "strangely accurate"? After all I don't have a crystal ball. Please know I'm not boasting, I've just been doing this a long time and I want to show you how predicatable it can be. Hopefully this will encourage you to learn TA. Also, I post here to keep track of my calls and to share my trading ideas (I want us all to succeed). Hopefully this offers some insights as to how effective technical analysis can be. I encourage you all to become students of this trade. Education is the only way we can gain any competitve edge in these fast moving markets.
Congratulations to everyone that has taken these trades and are in significant profit.

Taking Profit on BTC Shorts; Looking to Get Tiny Long ExposureOriginally Posted: 02/05/2026
Reposted For Compliance: 02/13/2026
BTC and MSTR are at potential PCZs of Bullish Gartley; The two assets moved down leading to MSTR earnings and negative unrealized losses expectations. I do think that BTC will ultimately move back down, but from where it is now, looking at all of the downside short leverage that has been building at these lower levels, I think there is a high chance of it short squeezing to the upside and for it to be fast and violent move up to around 90-106k before then confirming a lower high and going back down to even lower lows in a fashion similar to the green projection I have drawn out. Meanwhile we could see MSTR pump back to around $200. In this scenario I would see these pumps as nothing more than Bear Cat Bounces and would be looking to reenter my shorts on these bounces where we could then continue the main bearish trade. Here is a link to a chart of the original underlying bearish trade :
The short squeeze we could be set up for is something similar to what we got near the end of 2019 where BTC was in a bear trend but rallied 40% in 2 days within that bear trend before continuing much lower into 2020. Here is the chart focused around that time period:
At the time it was the greatest BTC short squeeze in the history of the asset yet despite how great it was it still ultimately went lower later so I will be on the lookout for this kind of movement once more as short positions accelerate not only at the bullish trendline but also at the PCZ of Bullish Gartleys on both MSTR and BTC.
I suspect MSTR could pump 20-40% from the PCZ and in terms of BTC I think we will get price action similar to what I have projected in the white brush marker.
I actually posted this last week but it was taken down by a mod so this is a repost which should now be compliant enough for them; Since then, BTC pumped 15% and MSTR is up over 20% but we have since pulled back decently towards the entry zone so there may be way more upside to go from here. However; I have mainly reposted this for archival purposes.
On a side note CLSK, another crypto miner looks like it could be set to rise from it's 0.886 PCZ of a Bullish Bat around 10 dollars all the way back up to around 18 dollars.
BTCUSD: Bearish Logscale Butterfly with Bearish RSI DivergenceJul 18, 2025:
Bitcoin has been setting up at the log adjusted 1.902 HOP for a Type 2 retest of the Logscale Bearish Butterfly for the last few months but recently pushed a bit above it and appears to be settling at the linear 1.902 HOP of the local price around the $118,000 area. Between $104,000 and $118,000 is a zone of linear of logscale Fibonacci confluence pointing towards the being the area to look for a more major downside reaction than we got off the initial Type 1 Reaction 1.618 PCZ reversal in 2021.
The most recent push to the linear 1.902 seems to have allowed the structure of the RSI to develop a more Bearishly Distributive and Divergent curve, while the MACD is in the process of developing a 2nd layer of Bearish Divergence. Ultimately at these highs we'd like to see the RSI weaken further as price begins to settle back within the 1.902 bearish zone of confluence before being more sure of downside.
Additionally, during the push higher, longer dated bearish call interest came in around the 123-125k levels which to me signals a newly formed hard resistance that will be hard to gap over and will make failure here more likely. I think if we do see failure we can of course fill the CME gap down at 91.8k, but ultimately the true first target is down at 30k with max targets down near the 0.886 around $4.8k and the 100 percent retrace down at around $3,123.51 over the coming quarters.
Taking into account the wide range in downside exposure I think the best and safest way to speculate on this downside would be through the buying of the March, 27th, 2026 Puts at the $95,000 strike or the closest IBIT equivalent March, 20th, 2026 Puts at the 58 strike this will give plenty of time, as well as plenty of range for the puts to appreciate 10's of thousands of dollars in value as BTC trades down into the targeted zones below it.
02/05/2026
Trade closed manually
Closed for now; details here:
www.tradingview.com
This is a Repost: because the original post from Jul 18, 2025, got taken down by a TradingView moderator for having a custom moving average indicator that was not made public. Despite the moving averages only just being simply and exponential moving averages anyone could add to their charts. In light of this issue I have published the multi-moving average indicator so hopefully that should stop mods from taking down past and future posts.
For the time being I will keep this post in neutral status as we've already moved down significantly, are in the oversold zones in the RSI, and are likely due for a retrace back up which I will go into details about on my next post which will be a repost from last week's idea which was also taken down by a moderator.

XAUUSD (Gold) – 2H timeframe...XAUUSD (Gold) – 2H timeframe.
🔍 Structure
Price respected the ascending trendline
Fake breakout below → strong recovery
Back above short-term structure
Trying to push above minor resistance near 5,050
Bias right now: Bullish continuation
📈 Buy Targets
Current price around 4,990 – 5,000
🎯 TP1: 5,080 – 5,100
(previous resistance / intraday high)
🎯 TP2: 5,200
(clear structure resistance)
🎯 TP3: 5,300
(major resistance – matches my marked top target zone)
❌ Invalidation
2H close below 4,960
Clean break below trendline again
📌 My View
Fake breakdown + trendline support = liquidity grab
Upside toward 5,100 first, then continuation possible.

GBPUSD – 2H timeframe....GBPUSD – 2H timeframe.
I can see:
Head & Shoulders pattern
Neckline already breaking
Price below short-term structure
Inside / near Ichimoku cloud → momentum shifting bearish
📉 Bearish Setup (Primary Scenario)
Current price around 1.3625
🎯 Sell Targets:
TP1: 1.3560 (recent support)
TP2: 1.3500 (psychological + structure)
TP3: 1.3450 (measured move of H&S – matches my lower marked target)
📏 Measured Move Logic:
Head to neckline projected downward ≈ 150–180 pips → Gives target around 1.3450 area
❌ Invalidation
2H close above 1.3700
Strong break above right shoulder high
📌 My View
Neckline break + cloud resistance = downside likely
Best continuation below 1.3600

BTC/USDT | Bull or Bear ? (READ THE CAPTION)By analyzing the #Bitcoin chart on the weekly timeframe, we can see that price continued its bullish expansion and successfully rallied up to the $71,300 level. After this strong move, Bitcoin is currently trading around the $68,500 area, which can be considered a healthy corrective phase within the broader uptrend.
All previous assumptions of the analysis remain valid. As long as price holds above the key $66,000 demand zone, the bullish structure stays intact, and we can expect further upside once consolidation is completed. The recent pullback does not invalidate the bullish scenario and instead supports a continuation-based setup.
This chart will continue to be updated step by step as price reacts to key levels.
Please support me with your likes and comments to motivate me to share more analysis with you and share your opinion about the possible trend of this chart with me !
Best Regards , Arman Shaban

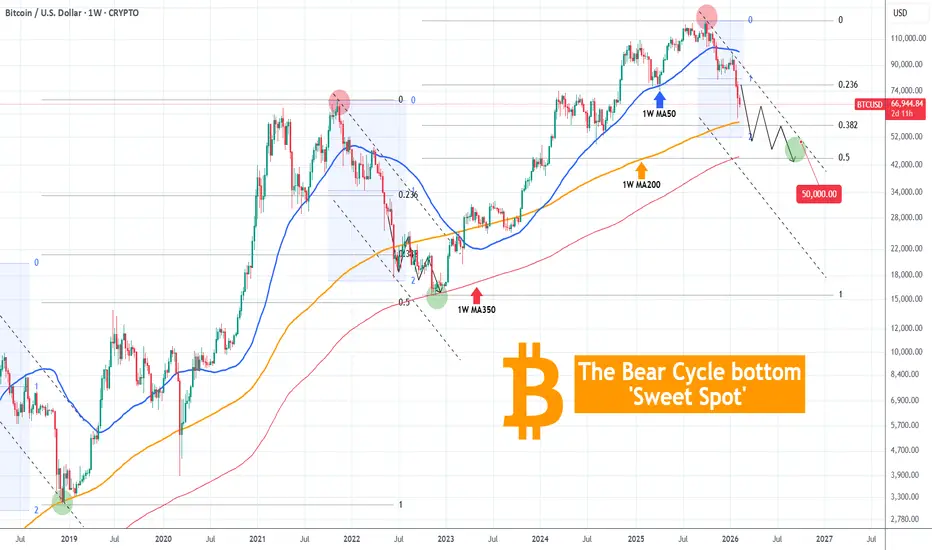
BITCOIN The Bear Cycle 'Sweet Spot'Bitcoin (BTCUSD) is currently sitting on the 4th straight red week following last week's near test of its 1W MA200 (orange trend-line). As we've discussed before, the Bear Cycle may be entering Phase 2 when the 1W MA200 finally breaks.
From a Fibonacci perspective, last week's Low also came close to the 0.382 Fibonacci retracement level from the last Bear Cycle bottom. That was when the lengthy bottoming process started for BTC. Also that 1W MA200/ 0.382 Fib break coincided with a near test of the 2.0 Fib extension (blue) from the first Low of the 2022 Bear Cycle.
That is currently around $51000 and the Zone within that and the 0.5 Fibonacci retracement from the Bear Cycle bottom (around $45000) is the 'Sweet Spot'. Practically this is a 'no-miss' Buy Zone on a cyclical perspective where long-term investors can start feeling comfortable enough to initiate buying again. We've already discussed why a 1W MA350 (red trend-line) bottom would technically make sense, as this is where the 2022 Bear Cycle bottomed.
So do you think the 51000 - 45000 Zone is a 'Sweet Spot' buying range for BTC? Feel free to let us know in the comments section below!
---
** Please LIKE 👍, FOLLOW ✅, SHARE 🙌 and COMMENT ✍ if you enjoy this idea! Also share your ideas and charts in the comments section below! This is best way to keep it relevant, support us, keep the content here free and allow the idea to reach as many people as possible. **
---
💸💸💸💸💸💸
👇 👇 👇 👇 👇 👇
EURUSD going down!EURUSD has lost strength and is making Lower Lows and Lowe Highs. Good opportunity to get in on pullbacks.

Where is Bitcoin (BTC) real bottom?During the 2021 to 2022 cycle, BTC built a very clear structural sequence on the weekly chart. We had the major top at A, followed by a correction to B, then a failed continuation attempt at C. From there, the market transitioned into a broader downtrend with D, E, F, and finally the cycle bottom at G. After that bottom, price still produced a pullback toward H before consolidating and starting a new bullish cycle.
What stands out now is the structural similarity with the 2024 to 2026 movement. We formed A at the recent top, corrected to B, attempted continuation at C, failed, lost strength into D, reacted into E, and are now accelerating lower into F.
If structural symmetry continues, the logical next step would be a move toward G again, meaning a renewal of the current low. Historically, the first major support test rarely ends a correction. The market tends to sweep the low, generate liquidity below it, and only then build a stronger base.
The 50,000 to 40,000 USD region stands out as the most attractive long term buying zone if this scenario unfolds. Structurally, that range aligns with prior support, liquidity concentration, and projected symmetry with the previous cycle’s final leg down.
In terms of timing, the most probable window for this correction to end lies between August and November this year. That is also the period where price is most likely to reach the 50k to 40k region, potentially creating the best asymmetric buying opportunity of the cycle from both a structural and temporal perspective.

BTCUSDT: Structure Break & Bearish Channel ContinuationHi!
Bitcoin has shifted into a clear bearish market structure after breaking the long-term ascending trendline and losing the key horizontal support zone. Price is now trading inside a descending channel, confirming downside momentum.
The recent breakdown below the 68K support area turned previous support into resistance, increasing the probability of continuation toward lower liquidity zones.
Market Structure
Broken ascending macro trendline
Lost major horizontal support
Clean rejection from broken support → resistance flip
Price respecting bearish channel boundaries
Bearish Scenario (Primary Bias)
If the price continues to respect the channel resistance, further downside is likely.
Target Zones:
Target 1: 60,000 – 58,000
Target 2: 55,000 – 53,500
Important Context – Monthly Support
This setup comes with reduced statistical confidence because the price is approaching a higher timeframe (monthly) support region.
That means:
Downside continuation is possible
But sharp bounces can happen unexpectedly
Overall win rate of this bearish continuation idea could be lower than usual due to higher timeframe demand presence

BTC: another Drop??????Hi everyone!
After a strong rally, BTC formed a rising wedge pattern and has now broken to the downside. Price is currently sitting at a very important support zone, which could be difficult to break.
🔴For now, it’s better to stay patient and wait for a clear breakdown below the $74,400 support level, or a breakdown followed by a retest/retracement, before considering any short positions.
🎯If this support fails, the potential downside target would be around $63,500.

Bitcoin's Volume Profile: If $60k Gives Up $27k Catches Knife Bear Flag alert played out accurately
In this chart, I would like to share with you a different perspective on the charting for educational purpose. I'm gonna show you "underwater world"
that can be displayed with the Volume Profile indicator
I put three lines on the chart that highlight 3 levels of support based on highest traded
Coinbase exchange volume areas
1) yellow one is located at $61k and recently it absorbed all the downside pressure
from the Bear Flag drop and rejected the sell-off so far
2) orange line represents shallow interim support around $42k
it could hardly survive once another fall appears
3) red line is a die-hard support at $27k that shows the highest traded volume
that lasts solid down to $19k
This is what we can see under the "iceberg" to have all perspectives:
price/patterns and volume based levels

TradeCityPro | Bitcoin Daily Analysis #267👋 Welcome to TradeCityPro!
Let’s move on to Bitcoin analysis. Today, Bitcoin could give us a trading opportunity.
⏳ 1-Hour Timeframe
Yesterday, after Bitcoin made another pullback to the 68,365 level, selling volume entered the market and price moved downward to 65,402.
✔️ Right now, price is going through a corrective move again, and volume is decreasing. This shows that sellers are still in control, and if 65,402 gets broken, we can look for a short position.
✨ As I mentioned in previous analyses, the main short trigger is still 62,824. A break of this level would confirm the start of the next bearish wave. Until that happens, we shouldn’t expect strong bearish momentum in the market.
⭐ If price manages to stabilize above 68,365, we can get the first confirmation of a bullish shift in Bitcoin. However, in my view, the main long trigger is still the 71,670 area.
❌ Disclaimer ❌
Trading futures is highly risky and dangerous. If you're not an expert, these triggers may not be suitable for you. You should first learn risk and capital management. You can also use the educational content from this channel.
Finally, these triggers reflect my personal opinions on price action, and the market may move completely against this analysis. So, do your own research before opening any position.

BTC Intraday (Feb 13, 2026)### A) Market Context (The "Why")
* **Macro Cycle:** BTC is in a **mid-cycle reset**. After hitting an ATH of ~126k in Oct 2025, price has drawn down 45–50% to the 60k region. The long-term trend remains bullish, but the current structure is fragile.
* **Today’s Regime:** Price is chopping around **66–67k**. The market is heavily **derivatives-driven** (Futures Vol ~$63.7B vs Spot ~$6.9B), increasing the risk of "wicks" and stop-hunts.
* **CRITICAL EVENT:** **US CPI Data** releases today at **08:30 ET (14:30 CET)**.
* *Implication:* This is a binary risk event. **NO TRADES before 14:30 CET.** Any technical setup prior to the release is gambling. Wait for the reaction and structural clarity.
---
### B) Structure & Key Levels (The "Where")
Mark these zones on your chart:
**1. HTF Context (4H/Daily)**
* **Supply (Resistance):** **72k – 75k** (Major breakdown zone).
* **Demand (Support):** **60k – 62k** (Recent crash lows) & **58k** (200-Week MA – the "line in the sand").
* *Note:* Current price (~66k) is **Mid-Range**. Swing trading here has poor R:R.
**2. LTF Context (15M/1H)**
* **Current Range:** **65k – 68k**.
* **Local Resistance:** **68.5k – 69.5k** (Top of current consolidation).
* **Local Support:** **65k – 65.5k** (Yesterday's lows pre-CPI).
---
### C) Trade Scenarios (The "How")
**Status:** Conditional. Valid **ONLY POST-CPI** and if specific triggers occur.
#### 📈 Scenario 1: Post-CPI Momentum LONG
*Targeting a breakout of the local range toward HTF supply.*
* **Zone of Interest:** **68.5k – 69.5k**
* **Precise Entry Trigger (Must see this):**
1. **Breakout:** CPI impulse pushes price above 69.5k with a **15M candle close** above the level.
2. **Retest:** Price pulls back into **68.5–69.5k**.
3. **Confirmation:** On the retest, look for a **Bullish Engulfing** or **Pinbar** (5M/15M) followed by a **micro-BMS** (break of market structure to the upside on 5M).
* **Invalidation (SFP):** If price spikes above 69.5k but immediately closes back inside the range (<68.5k), cancel the long.
* **Stop Loss:** Below the retest low (approx. **67.6k – 67.8k**).
* **Take Profit:**
* **TP1:** **71.5k – 72k** (Secure 50%).
* **TP2:** **74k – 75k** (Main target).
#### 📉 Scenario 2: Post-CPI Momentum SHORT
*Targeting a breakdown of support toward cycle lows.*
* **Zone of Interest:** **64k – 65k**
* **Precise Entry Trigger (Must see this):**
1. **Breakdown:** CPI impulse pushes price below 65k with a **15M candle close** below the level.
2. **Retest:** Price bounces back up to **64.5–65.5k** (from below).
3. **Confirmation:** On the retest, look for a **Bearish rejection** (long upper wicks) and a **micro-BMS** (lower low on 5M).
* **Invalidation (V-Shape):** If price wicks below 65k but the same 15M candle closes back above 65–66k, cancel the short.
* **Stop Loss:** Above the retest high (approx. **66.3k – 66.5k**).
* **Take Profit:**
* **TP1:** **61k – 62k** (HTF Demand).
* **TP2:** **59k – 60k** (200W MA zone).
---
### D) Execution Summary
| Component | Guideline |
| --- | --- |
| **Timing** | **Strictly Post-CPI (After 14:30 CET).** |
| **Strategy** | Reactive Intraday (Trend Following). No Swings today. |
| **Order Book** | **Longs:** Look for bid absorption at 69k on the retest.
**Shorts:** Look for sell walls reloading at 65k on the retest. |
| **Risk** | High volatility expected. Wait for candle closes to avoid "whipsaws." |
**Daily Verdict:**
Patience is the edge today. The market is trapped between 60k and 75k. Let the CPI print force the price out of the **65–68k** box, then trade the retest of the broken level.

GOLD slowly climbing. GOLD is in the move UP. We will wait to hit RESISTANCE and then go in LONG if a BreakOut happens next week.

bitcoinPrice has reached the bottom of the wedge, and now it’s time for it to move toward the top of the wedge. This move could take several days to complete.

The channel or trend line confluence observation for BitcoinWas just dabbling with a trend line and then I explored if it had confluence with future price action. Surprisingly it did. It not recommended as a strategy but its just another chart element that can be a supporting confluence level for future trades for bitcoin. Just putting it out there.
If you have free time, and open minded, this approach might fit into your trading strategy.
Cheers,
S.SAri
