GBPUSD is in retesting PeriodGBPUSD on the 4H timeframe is holding above a well-defined support zone after a corrective pullback from the recent bullish impulse, suggesting the market is respecting higher structure and building a base for potential continuation. Price action shows a clean reaction from demand with higher lows forming, indicating bullish order flow remains intact while liquidity below the range has already been mitigated, which often precedes an expansion move to the upside. From a macro perspective as of 10 Feb 2026, the pound remains sensitive to Bank of England rate expectations, inflation persistence, and UK growth outlook, while the US dollar is being driven by interest rate differentials, ongoing focus on inflation control, and US labor market resilience, keeping volatility elevated around key sessions. This environment supports a technical-fundamental confluence where buyers may look to defend support and target higher liquidity zones, making this structure favorable for trend continuation setups, breakout confirmation, and momentum-based trading aligned with smart money behavior and risk-on sentiment.
Btc!

Bitcoin 2026- Simple chart : Trend corridor, RSI deeply oversold, Green Bubbles lead the way.
- Whether Bitcoin bottomed at 60k or dips to 50k or even 40k doesn’t really matter.
When it’s trading at 250k+, those differences fade into noise.
- Markets don’t reward perfection, they reward patience, risk management, and timing that’s good enough. If anyone had a magic trick to nail the perfect entry, we’d all be rich already.
- Now is the time to accumulate with discipline through DCA, not to amplify fear or noise.
- As traders, we adapts and executes a plan. We don’t panic over headlines or try to catch the exact bottom.
Happy Tr4Ding!

BTC Elliott Wave IdeaSome nice fib interactions on BTC that make me think this move down is WXY
$80534 was the 1.618 extension for wave C in wave W
$97884 was the 0.382 retracement of wave W
The 1:1 extension for wave Y is at $52874 and there is a CME trading gap around $54000 from September 2024

BTC macro trend, good place to start DCA for the next 1-2 yearsSeeing us hitting a new low soon unless we already did; 200 EMA on the weekly is a huge support for BTC

BITCOIN: WHY!? Long-Term Structure Still IntactIt's time to be real..
Everyone is calling for an immediate bull run, or bull run soon, but markets don't move on excitement - they move in cycles.
Bitcoin has always required time, consolidation and patience before its next expansion phase. Price rarely moves in straight lines, especially on higher timeframes.
This weekly chart highlights the broader structure and long-term trend rather than short-term noise. If history continues to rhyme, the coming phase is more likely to be a a boring continued consolidation and accumulation phase, not instant acceleration. For those that know, the "boring" phase is often the most exciting. When everyone's portfolio has been hit hard followed by some up and down consolidation for long period of time, that's when they get the "i better sell, this is BS" attitude. That's when i buy with excitement.
The goal here isn't to predict a top or bottom, but to respect structure and allow the cycle to play out. Patience is often the hardest part - and usually the most rewarding.
So everyone wants prices and dates right? Well looking at the chart, I suspect that we have already hit the bottom lows of 60k, and the boring accumulation is about to begin. This will go for a year, most will not be able to cope. We will be bouncing around the bottom of the parallel channel a few times around 64k again.
When's the next bull run you ask? well i suspect it won't officially start until early to mid 2027.
SAVE this chart, track as time goes on.
Cheers,
Activeaus

$BTC - Intraday OutlookCRYPTOCAP:BTC | 2h
72k is acting as a clear area of resistance for now.
Not much follow-through yet and price is still stuck in chop. For the time being, I’m expecting more rotation within the 67–72k range rather than a clean directional move.
If we get a deviation into 66–65k sweeping those lows, that’s where I’d be more interested in looking for a long, ideally setting up a rotation back toward 74–76k, assuming acceptance and momentum start to build.

ETH — Price Slice. Capital Sector. 1839.34 BPC 3© Bolzen | The Architect | BPC Framework
Bolzen Market Institute
🏷 ETH — Price Slice. Capital Sector.
Publication date on TradingView: 08.02.2026
🏷 1839.34 — at the time of publication, the price had not been reached.
🏷 BPC — The Bolzen Price Covenant — Strength Index: 3
The energy block reflects the intentions of capital. The direction of capital flow is determined dynamically. The key mechanism of liquidations lies in the tendency of price to gravitate toward areas where real participants of the system are concentrated — regardless of whether they are in longs or shorts.
Such zones represent areas of asymmetric advantage: when the price approaches them, some participants are forced to close positions at a loss, others lock in profits, and a third group (institutional players) uses this flow to enter in the direction of the next concentration zone.
Institutional players generate energy blocks through miners. Subsequently, these energy blocks form the range of capital movement across various timeframes for exchange speculators. However, the ultimate goal in ensuring liquidity is to reach the energy block mark.
The results are presented in the dashboard for the international arena. It is necessary to manually determine, without third-party software, the direction of the impact node and the concentration of real system participants. This is achieved through high cognitive and intellectual effort — without templates and solely through pure chart analysis.
Three-dimensional analytics is intellectual property. The methodology is closed and does not require evaluation from the standpoint of the old world. We offer the ability to think but do not provide trading recommendations and are not educators.
We thank you and regard TradingView as an impartial platform for demonstrating the transition into a new analytical reality.
Quantum structure of obligations and capital movement in price formation within energy blocks.
🏷 Vertical chart — Energy Grid Dashboard.
🏷 Static tape No. 1: The price is published according to the production order of the energy block.
🏷 The energy block price is already ordered — not by time but by the priority of block execution. It is important not to confuse: block priorities dynamically reorganize in response to hidden energetic impulses, while the execution order of prices fixes their manifestation in the market. Each price in the dynamic tape is linked to energy production measurement indicators, unavailable to the general public. Those who see the structure before its manifestation do not follow the price — they anticipate it.
EΞ2Φ8Ψ45Θ·ζ⁻¹·106Λ732·Ω²
📎 Screenshot:
🏷 When trading from levels, use liquidation zones from BPC 10 and higher.
🏷 Bolzen Liquidity Map — ETH (numerical equivalent of the map):
Updated versions of the Bolzen Liquidity Map — ETH are in restricted access.
The permanent Energy Grid Dashboard for ETH and BTC is publicly available and intended for international institutional review.
Dear international community,
I thank the TradingView moderation for their neutrality and support of analytical work on a global scale, as well as everyone who follows my research. This platform serves as a space to demonstrate the contribution to analytical development.
Attention and time are your key resources. ATH — is emotion; timeframes — are your best allies. Thank you.
— The Architect
BPC — The Bolzen Price Covenant

This Volatility Period: February 6th - 8th
Hello, fellow traders!
Follow us to get the latest information quickly.
Have a great day!
-------------------------------------
(BTCUSDT 1M Chart)
The price fell from the critical 69,000 - 73,499.86 range.
We need to see if it finds support near the previous high of 57694.27 to 61299.80.
I believe the price range it cannot return to is below the 42283.58 to 43823.59 range.
-
(1D chart)
This period of volatility is expected to last from February 6th to 8th.
Therefore, the key question is how far it can rebound.
We need to see if it can rise to the critical 69000 to 73499.86 range.
If not, we need to see if it can rise above the left Fibonacci level of 0.618 (65760.59).
The next period of volatility will be around February 17th (February 16th-18th), so the key question is where the price will begin its sideways movement after this period of volatility.
The 57694.27-61299.80 range represents the previous high point, the first significant uptrend, and thus holds some significance.
The M-Signal indicator on the 1D chart is still forming at 87944.84, so we should also monitor whether it re-forms after this period of volatility.
This is because an uptrend begins when it meets the minimum DOM (-60) or HA-Low indicator.
-
Thank you for reading to the end.
I wish you successful trading.
--------------------------------------------------
- This is an explanation of the big picture.
(3-year bull market, 1-year bear market pattern)
I will explain in more detail when the bear market begins.
------------------------------------------------------

BTC/USDT 1H Short-Term🔎 Market Structure
• We are still in an uptrend (higher lows, price holding above the black trend line).
• The recent downward move looks like a trend correction, not a trend reversal.
🟥🟩 Key Levels
Support:
• 69,670 – very important level (reaction + prior consolidation)
• 68,780 – last strong low, dynamically defended
• 67,340 – critical support, its loss = structure change
Resistance:
• 70,340 – current price, local resistance
• 71,360 – range high / supply zone
• 72,230 – upper resistance, target on breakout
📈 Price Action
• The bounce from ~68.8k was impulsive → demand is entering aggressively
• Now we have a pullback / consolidation below resistance ~70.3k
• No strong rejection = the market is gathering strength, not distributing
📉 RSI / Stoch RSI
• Stoch RSI: high, possible short cooldown (small Pullback or sideways)
• Classic RSI: returns above 50 → bullish signal
• No bearish divergence (this is important 👀)
🧠 Scenarios
✅ Bullish:
• Holding 69.7k
• Breakout of 70.5k → attack on 71.3k, then 72.2k
⚠️ Corrective:
• Rejection of 70.3k
• Pullback to 69.7k / 69.0k
• Only from there another attempt at an upside
❌ Bullish Negation:
• Close of H1 below 68.7k
• Then target: 67.3k and change of bias

Bitcoin up-close —Expect more and additional growthTo look at Bitcoin we have to focus on the short-term, we already looked at the weekly and monthly timeframes. I already showed you why a recovery now is unavoidable.
I know you don't like these really short-term analyses because the view, the perspective is just too narrow; but we've been going deep into the bigger price. Let's see what is happening daily and if this confirms our broader bullish bias.
The last move is the exact same as Ethereum. An ABC correction. First a steep decline, then sideways followed by a bearish continuation. This much calls for bullish action now.
After a move is completed the market tends to move the other way.
I think the most important candle to consider is 6-Feb. The same day that produced the lowest price in years, since October 2024, also recovered most of the losses and ended up closing green. The ensuing day there wasn't a bearish resumption, nor the next day nor today. Instead, the market is green.
This all points to the correction being over. It is the same that happened in April 2025, the end of the previous correction and the start of the bullish wave that ended with the $126,000 all-time high.
Looks like we will have a v shaped recovery. The "baseline level" is the previous trading range, now a resistance zone. Around this level there can be a reversal followed by another crash to end the bear market in the latter part of 2026.
The current move doesn't have to be a sudden rise, Bitcoin can take its time.
The signal that confirms a bear market, apart from the 4 consecutive months Bitcoin closed red, is the monthly MACD. There is no going back once the chart becomes like this.
The good news is that we are getting a relief rally now —bullish. And the situation is similar to what I showed you with Ethereum.
Bitcoin recovered 6-February to peak at $71,725, the low was $60,000. The action is always happening at the top of the range, which is extremely bullish.
7-Feb. Bitcoin moved lower with the lowest point being $67,360. Today again, lower but all selling was quickly bought. The lowest point today was $68,308.
Notice how it is not possible for the market to push prices below $65,000 and how resistance continues to be challenged.
On a bearish continuation, we would see Bitcoin trading between $64,000 - $61,000, this isn't the case.
On a bullish move, Bitcoin would stay close to resistance making it weaker with each passing day. This is exactly what is happening.
On a bullish move, the smaller altcoins would start to grow really, really strong. Just today, many projects are high with two digits green, the first time since the correction low.
We have bullish signals coming from Bitcoin, Ethereum and the smaller altcoins. All this combined supports growth.
Truly, it is not a surprise, it is exactly what we have been expecting so, let it grow. We will adapt to market conditions as the relief rally unravels.
Long-term: Up now, then big down followed by the accumulation phase—sideways trading at bottom prices. After the accumulation phase, late 2026, we get the start of the next market cycle... The best ever!
Stay true, stay live and alive, continue to trade.
Good opportunities come and go, the market will continue to fluctuate.
Whatever your plan, just make sure to always stay in the game. As time goes by, we gain experience. With this experience, we will achieve long-term financial success.
From the top to higher. There is no limit to how high we can go. Nothing can stop us. The difficult life experiences will only stimulate more and additional growth.
Thanks a lot for your continued support.
Namaste.

BTCUSD — Structure FirstAfter the recent liquidation-driven sell-off, BITSTAMP:BTCUSD has entered a very different phase.
Momentum is gone, volatility has compressed, and price is no longer behaving like it did during the impulsive advance that preceded the correction.
From a structural point of view, this move looks less like the start of a new bearish trend and more like a reset within a broader cycle. Higher-timeframe supports are still holding, and instead of continuation to the downside, price has stabilized and begun to balance.
This type of behavior usually appears between phases, not at the beginning of a strong directional move.
From a fundamental perspective, the picture is equally mixed.
Liquidity conditions remain tight, rate expectations are still uncertain, and risk assets are highly sensitive to macro data and policy communication. At the same time, Bitcoin is no longer trading in isolation — ETF flows, institutional positioning, and broader market correlation are now part of the equation.
In this environment, extremes tend to be punished.
Price needs time to absorb information, reposition participants, and rebuild structure.
That is why, at this stage, structure matters more than narrative.
Key Levels
Major structural support: 65,000 – 68,000
This is the area that separates consolidation from continuation. As long as it holds, the broader structure remains constructive.
Current acceptance zone: ~70,000
Price is stabilizing here. Acceptance or rejection around this level will define the next leg.
First meaningful resistance: 78,000 – 80,000
A clear supply zone where reactions are likely.
Higher-timeframe supply: 90,000+
A reference level if the market successfully rebuilds bullish structure.
Trade Framework
Base case (balance / recovery):
Acceptance between 70k–72k favors a rotation toward 78k → 80k → 85k.
This scenario assumes continuation of consolidation and gradual structure rebuild.
Recovery continuation:
Sustained acceptance above 74k–75k opens the path toward 85k → 90k, suggesting renewed confidence and participation.
Bearish continuation:
A daily close below 68k would invalidate the balance and shift the focus toward 62k and 58k as next downside areas.
Bitcoin is not in a momentum phase right now.
It is in a decision-making phase, shaped by both technical structure and a complex macro backdrop.
The reaction around 68k, 70k, and 78k will be far more important than short-term headlines.
Until structure resolves, patience and level-based execution remain the edge.
Illyrian Finance — Trading structure, not predictions.

Bitcoin Cycle Déjà Vu? Phase 4 Has Arrived!Bitcoin doesn’t move randomly.
It repeats behavior; just at different prices.
When you zoom out and compare the previous cycle to the current one, the structure is almost identical.
Let’s break it down 👇
📈 Phase 1: Higher High
Both cycles started the same way.
A strong bullish expansion that convinced everyone the trend would last forever.
🐂 Momentum was strong. Sentiment was euphoric.
🔻 Phase 2: Structural Break
After the higher high, price failed to continue.
Support zones broke. Momentum shifted.
🧱 Phase 3: Weekly Low Reaction
In both cycles, Bitcoin found a major weekly low.
Buyers stepped in. Hope returned.
This is where most traders got confused... thinking the worst was over.
⏸️ Phase 4: Range
This is where we are now.
Price is no longer trending.
It’s digesting the prior move inside a wide range.
Volatility increases. Direction disappears.
Traders get chopped. Investors get tested.
This phase is not about speed, it’s about patience.
💡 Key Insight
Phase 4 is not bearish.
But it’s also not bullish.
It’s a transition phase... where weak hands exit, strong hands accumulate, and the next big move is quietly prepared.
The same movie.
Different year. Different price.
🤔 Question:
Do you think this range resolves the same way as the last cycle… or does Bitcoin surprise everyone this time?
⚠️ Disclaimer: This is not financial advice. Always do your own research and manage risk properly.
📚 Stick to your trading plan regarding entries, risk, and management.
Good luck! 🍀
All Strategies Are Good; If Managed Properly!
~Richard Nasr

Bitcoin Dips Below Key $70,000 LevelBitcoin Dips Below Key $70,000 Level
Bitcoin (BTC-USD) has slipped below the critical $70,000 threshold, down 2.41% amid broader crypto volatility and market rotations. This dip follows a wild ride, potentially signaling the end of a bear phase based on Sharpe Ratio metrics, but questions linger on sustained recovery.
Key facts: Trading near $68,500, BTC faces support at $65,000 with resistance at $72,000. The move correlates with tech sell-offs and AI capex shifts, where energy demands indirectly pressure crypto mining costs. Ethereum (ETH) shows similar weakness, down in tandem.
Implications: This could present buying opportunities 💡 for long-term holders, especially with interconnections to AI (e.g., data center energy) and commodities (gold as a hedge). However, risks from regulatory scrutiny and market sentiment tied to upcoming US jobs/CPI data warrant caution ⚠️. Altcoins may follow, amplifying volatility.
Links to bigger pictures: Bitcoin's movements often preview tech trends; watch for rebounds if Dow sustains above 50,000. Consider staking strategies for yields above 4% in stable protocols.

Bitcoin(BTC), has yet to reach a cyclical low.BINANCE:BTCUSDT
It’s been about four months since my post calling the end of Bitcoin’s bullish season, and here is an updated cycle-based outlook.
(CME chart during the 22-year bear market)
After forming a downside gap near the 81K level, Bitcoin saw a one-way selloff down to around 60K, followed by a technical rebound.
I believe this 81K gap is likely to be filled in the next bullish cycle, similar to the price action observed during the 2022 bear market.
From a cycle perspective, the macro bottom is expected to form around August–September 2026. Until then, Bitcoin may continue moving in a prolonged consolidation phase driven more by time correction than sharp price movements.
My projected downside target zones are:
• Primary zone: 49K–52K
• Deeper correction: below 39K
• Extreme scenario: toward the 32K region
However, if price moves up first and fills the 81K gap, this bearish cycle scenario will be invalidated.
Your follow and boost would mean a lot. 🚀

Bitcoin’s Unfilled CME Gap: A Price MagnetBitcoin currently has a CME gap between $79,600 and $83,730, which remains unfilled.
From a historical and statistical perspective, CME gaps have a strong tendency to be filled over time, making them important reference zones for both swing traders and long-term market participants.
At the moment, price has moved significantly away from this range, which reduces the probability of a gap fill in the short term and makes any immediate retracement less likely without a clear catalyst. Strong momentum and trending conditions can delay gap fills for extended periods.
However, this does not invalidate the gap. Instead, it should be viewed as a high-probability magnet zone that may come into play during future corrections, deeper pullbacks, or broader market structure shifts.
As long as this CME gap remains open, it represents a key area of interest for liquidity, potential support/resistance reactions, and higher-timeframe mean reversion. Traders should keep this zone marked on their charts and be patient, as sooner or later the market tends to revisit and fill these inefficiencies.
Risk management and confirmation from price action are essential when approaching this area.
If you have a coin or altcoin you want analyzed, first hit the like button and then comment its name so I can review it for you.
This is not a trade setup, as it has no precise stop-loss, stop, or target. I do not publish my trade setups here.

BTC/USDT — Exhausted Sell-Off: Consolidation or Slow Grind Lower✔️ The week closed with a red candle and a long lower wick, but it does not qualify as a reversal pattern.
🟢 RSI is extremely oversold on higher timeframes.
🟢 Buyer reaction is visible at the support block.
Price spent ~250 days in the 55–70k range — it’s reasonable to expect at least a pause or consolidation here.
🟢 US employment is weakening — a potential signal for rate cuts ahead.
🟠 The structure resembles May 2022, as if only half of the downside move has played out.
This scenario is now widely discussed on social media, which reduces the odds of a direct repeat.
🟠 Extreme fear, with the index dropping to 5.
🔴 The market is highly exhausted, but hasn’t reached full apathy yet.
🔴 Both institutional and retail investors continue selling crypto ETFs.
🔴 Negative cumulative delta: –$1.62B.
🔴 The risk of entering a prolonged bear cycle is increasing.
🧠 The sell-off unfolded faster than expected, but the rebound failed to produce a reversal.
Base case: slow grind lower for 1–3 weeks, with a reversal near the lows — possibly with a sweep, possibly without.
The key is that a reversal eventually forms.

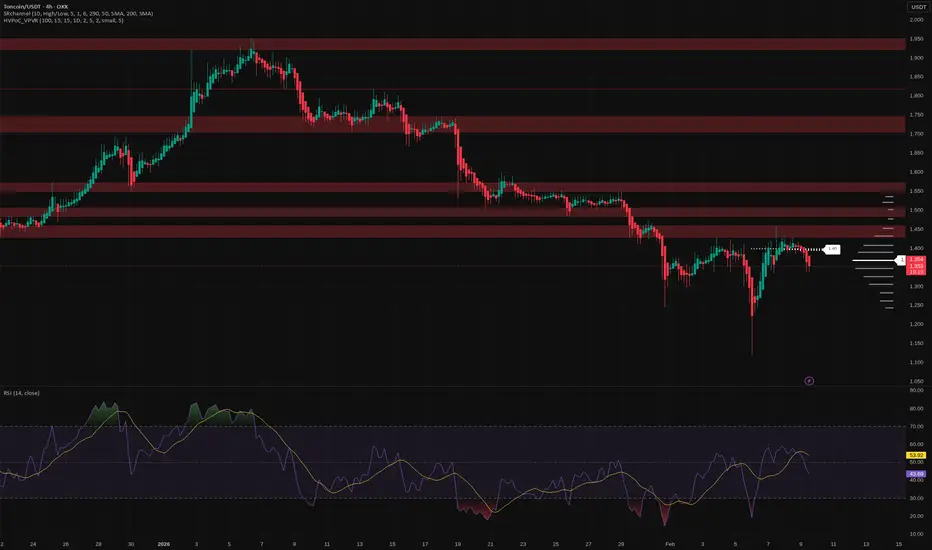
Toncoin: bounce or breakdown? key levels to watch this weekToncoin. Tired of watching it bleed or ready to trade the bounce? After the hype around its ecosystem partnerships and the recent shakeout across majors, Toncoin is still stuck in a heavy downtrend and every pop is getting sold into, according to market chatter. Volatility is back, which means opportunity if you’re precise with levels.
On the 4H chart price is pressing under a chunky supply area around 1.38-1.40 with repeated rejections there and point of control slightly below. RSI made a lower high while price retested that zone - classic bearish divergence. With that and the dominant downtrend, I lean short bias, expecting sellers to defend 1.40 unless some fresh catalyst brings real spot demand.
My base plan: as long as 1.40 holds as resistance, I expect a slide toward 1.32, then 1.26-1.22 where the next demand cluster sits ✅. If buyers suddenly push and we get a clean 4H close above 1.40 with volume, that invalidates the short idea and opens the door to 1.47 then 1.55 ⚠️. I might be wrong, but for now I’m hunting shorts near 1.38-1.40 with tight risk above the range high.
Unlocking Altseason: Chart Signals You Can't IgnoreAltseason without myths: what actually shows up on charts before alts go crazy
Everyone loves to say “altseason is coming” the same way kids say “summer is coming” in March. Feels good, zero responsibility.
But altseason isn’t magic. It’s just money rotating. And that rotation leaves fingerprints on the charts way before your favorite microcap does +500%.
Let me walk you through the main conditions I usually want to see before I start taking alt setups seriously – not memes, not hopium, just price.
1. King Bitcoin does his move first
Healthy altseasons rarely start from flat Bitcoin.
Typical pattern:
- First, a strong impulsive move up on BTC
- After that move, BTC stops trending and starts chopping in a range
- Volatility cools down, candles get smaller, volume drops
TL;DR: Big boys rode BTC, locked in chunky profits, and now their fresh capital is looking for higher beta plays. That’s when alts start feeling “lighter”.
If BTC is nuking or making fresh parabolic highs every day, alts usually just get dragged around like bags on a train.
2. BTC dominance stops climbing and starts bleeding
Open BTC.D (Bitcoin dominance) and zoom out.
Before most big alt runs, I usually see:
- A clear uptrend in dominance while BTC is running
- Then a topping structure: double top, lower high, or a fake breakout above the previous high
- And then – the key part – a confirmed breakdown with lower lows
That’s literally money leaving BTC relative to alts.
No need to overcomplicate:
Rising dominance – market respects Bitcoin.
Falling dominance – market starts gambling on the side quests.
3. ETH vs BTC wakes up
ETHBTC is my canary in the coal mine.
If ETH can’t even beat BTC, why should I expect your random GameFi coin to do it?
Before many altseasons I’ve watched:
- ETHBTC prints a base or higher low
- Breaks local resistance
- Starts grinding up, even if slowly
ETH often leads the rotation. When this pair wakes up, liquidity is starting to accept “more risk”.
4. Total alt market cap breaks structure
Open TOTAL2 or TOTAL3 – that’s your x-ray of altcoins as a whole.
What I like to see:
- A clear downtrend turning into a sideways accumulation range
- Higher lows forming under a big horizontal resistance
- Breakout of that resistance with expanding volume
That’s not your random lucky pump – that’s the whole sector getting repriced.
5. Volume rotation: BTC quiet, alts noisy
Check the volume bars:
- BTC: volume fades while it ranges
- Major alts: volume spikes on green days, pullbacks on lower volume
That’s exactly what “rotation” looks like. Money doesn’t appear from nowhere – it walks from chart to chart.
Maybe I’m wrong, but I think “altseason” is mostly a marketing word influencers use when they ran out of Bitcoin content. On charts it’s just a sequence:
BTC pumps → BTC chills → dominance tops → ETHBTC turns → alt market cap breaks out → volume rotates.
Last nuance: don’t try to guess the exact start like it’s New Year’s midnight. Focus on conditions, not dates. When several of these signals line up, I start hunting alt setups. When they disappear, I stop dreaming about 50x and go back to trading what the market actually gives.
In the end, altseason is just greed with a chart pattern. Learn to spot the pattern – and the greed will find you on its own.

Lighter (LGT) Swing Trade Setup – Approaching Key SupportLighter (LIT) is currently pulling back and heading toward a critical support zone between $1.50 and $1.54. This area has historically acted as a demand region, and price action is now slowing — signaling a potential bounce setup. If support holds, this could be a solid swing opportunity.
🟢 Trade Plan
Entry Zone: $1.50 – $1.54
Take Profit Targets:
• TP1: $1.68
• TP2: $1.80
Stop Loss: $1.50 (hard stop — close below invalidates setup)

ASTER Rejected at Resistance — Support Retest LikelyASTER has just faced a rejection at a key resistance level, signaling a potential move back down toward support. This pullback could offer a solid opportunity for bulls to re-enter if price stabilizes. The current structure remains valid as long as price doesn’t break below the invalidation zone.
🔔 Trade Setup
Entry Zone: $0.56 – $0.57
Take Profit Targets:
• TP1: $0.64
• TP2: $0.70
• TP3: $0.80
Stop Loss: $0.48
Risk management is key. Wait for confirmation.

TradeCityPro | Bitcoin Daily Analysis #263👋 Welcome to TradeCity Pro!
Let’s move on to Bitcoin analysis. Today, the market may continue its bearish move.
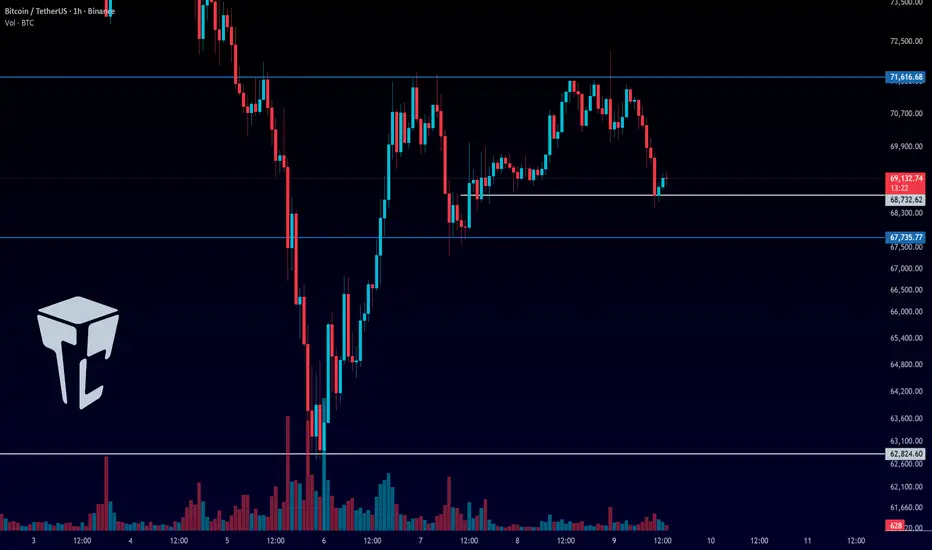
⌛️ 1-Hour Timeframe
On this timeframe, after getting rejected from the 71,616 high, Bitcoin is moving down toward its support at 67,735.
🔍 At the moment, price has reacted around 68,732, and it could now enter a ranging phase. In that case, we can look to open a short position on a break of 68,732.
📊 Otherwise, we can wait and look for a short entry on the break of 67,735.
✨ For long positions, our trigger remains the break of 71,616. If buying volume starts to increase, we can enter a long position once this level is broken.
⚡️ A break above 71,616 would give us the first bullish signal, and after that, forming higher highs and higher lows above this area would confirm a trend reversal to the upside.
✔️ However, if the short trigger at 67,735 gets activated, price could move toward 62,824. A break below 62,824 would then signal the start of the next bearish leg.
❌ Disclaimer ❌
Trading futures is highly risky and dangerous. If you're not an expert, these triggers may not be suitable for you. You should first learn risk and capital management. You can also use the educational content from this channel.
Finally, these triggers reflect my personal opinions on price action, and the market may move completely against this analysis. So, do your own research before opening any position.
BTC NOT CLEARBitcoin looks stuck in a range, trading heavily without clear momentum. It’s consolidating, and the next decisive move will show whether it breaks higher or lower.

BTC — Range Deviation Play & Bear Flag TargetBitcoin continues to trade inside a clearly defined sideways range. Recently, the price made a deviation above the range high — a classic false breakout — and quickly returned back inside the channel, confirming the upper boundary as strong resistance.
Now, on the daily timeframe , the market is forming a bear flag , which typically acts as a continuation pattern to the downside. If this structure breaks lower, it opens the way toward the $68–67K zone , which aligns perfectly with the lower boundary of the range.
A move into this area would likely create a deviation below the range low, mirroring the earlier deviation at the top. Such symmetrical deviations often signal liquidity grabs before a potential mid-term reversal.
Key Points:
Range structure remains intact
Upper deviation confirmed — failed breakout
Daily bear flag suggests continuation lower
Target: $68–67K (potential lower deviation zone)
This scenario remains valid as long as BTC stays below the mid-range and the bear flag structure holds.
