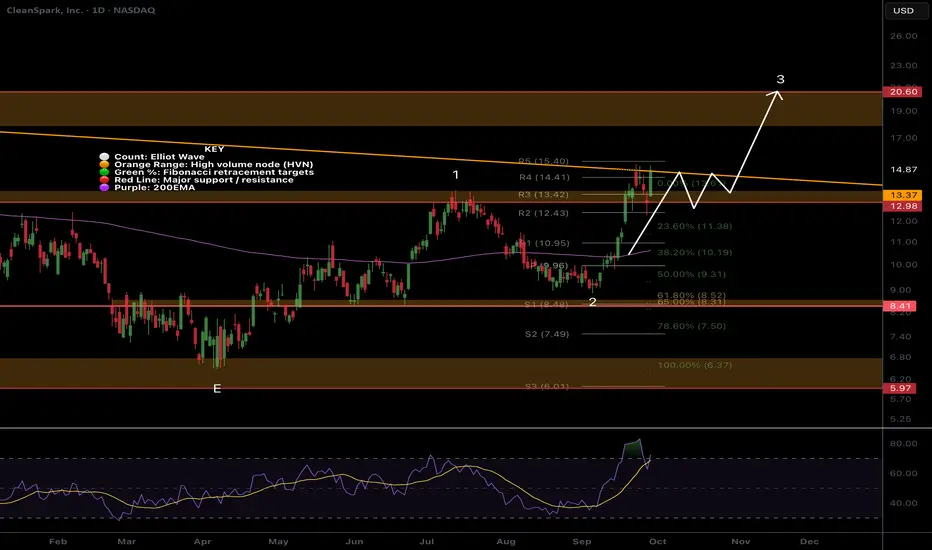
CLSK Attempting a significant resistance breakout!NASDAQ:CLSK has awoken at long last and has smashed through the wave 1 resistance High Volume Node straight into the Macro Triangle upper boundary i have been sharing in the weekly time frame posts. Breaking out above this and wave D at $20 will be a bullish signal with significant upside to come!
The High Volume Node resistance held as support in the big drop last week, quickly recovering back to highs showing strong demand.
The next local target is the wave D resistance $20 with continued upside in wave 3
Daily RSI is overbought but divergence yet and daily 200EMA has flicked positive.
Analysis is good unless we go back below wave 2 into the golden pocket.
Safe trading
Btc-bitcoin
$BTC Following $GOLD - Parabola Incoming !P.S. CRYPTOCAP:BTC still on track to follow the TVC:GOLD parabola with this 10-12 week fractal which we should see between Thanksgiving and Christmas 🦃🎅
Will be following GOLD a bit more closely as Total Global Liquidity gave its first real fake-out showing ATH at EOM.

BTC OutlookI strongly believe BTC reached the ultimate top. Sell the Top!
I predicted the 2022 BTC bottom, now I predict the 2025 top.

Bitcoin Bounces Strongly from Key Support – What’s Next?🔎 Technical Outlook (BTC/USDT, 4H):
1. Key Support: Bitcoin held the 110K – 112K zone, a historically strong demand area that triggered a solid rebound.
2. Channel Breakout: Price has broken out of a short-term descending channel, shifting momentum in favor of the bulls.
3. Immediate Resistances:
• First resistance: 115.5K – 116K
• Next major resistance: 118K – 120K (upper channel boundary)
4. Scenarios:
• 🟢 A confirmed breakout above 115.5K opens the path toward 118K → 120K.
• 🔻 Failure to clear resistance could trigger another pullback toward 112K or even a retest of 110K.
📌 Summary: Bitcoin has defended its major support and is showing bullish momentum in the short term. However, the upcoming tests at 115K+ will decide whether this move evolves into a stronger rally or just a corrective bounce.

BITCOIN SIGNAL: MOST PEOPLE ARE DOING THIS NOW (wrong)Yello Paradisers! In this video, we are going through multi-timeframe analysis on Bitcoin as professional traders. We are using advanced technical indicators, and we are properly analyzing with an Elliot Wave perspective. We are digging deep into the sub-waves and structure. Enjoy.
And Paradisers! Keep in mind to trade only with a proper professional trading strategy. Wait for confirmations. Play with tactics. This is the only way you can be long-term profitable.
Remember, don’t trade without confirmations. Wait for them before creating a trade. Be disciplined, patient, and emotionally controlled. Only trade the highest probability setups with the greatest risk to reward ratio. This will ensure that you become a long-term profitable professional trader.
Don't be a gambler. Don't try to get rich quick. Make sure that your trading is professionally based on proper strategies and trade tactics.

28/09/25 Weekly OutlookLast weeks high: $115,537.51
Last weeks low: $108,606.86
Midpoint: $112,072.19
As BTC continued to trend down post FOMC the key HTF level of $108,500, after some chop at this level a late rally on Sunday has pushed BTC back to the Midpoint of the range for this week.
As September comes to a close we are at the point where banks window dress their balance sheets by de-risking going into Q4. Banks taking cash out of the market to appear there is less risk and more liquid to hide their true risk over the quarter. This lowers liquidity and for this reason I do not expect the bulls to be out of the woods yet and the weekly low ($108k) could be under attack again before the week closes.
The story is the same for much of the altcoin market, after continued downtrend majors are bouncing off key HTF S/R levels but conviction is still low due to quarter end.
This week I am looking at how BTC finishes the week once the month/quarter end is out of the way. If their is renewed optimism October.
In terms of seasonality October has an average return rate of 21.89% since 2019.
Should price break below weekly low the bullish HTF trend would be questioned and would open the door to a deeper correction. With the 4-year cycle predicted to end in late October there would be huge talk of the cycle repeating and the bear market beginning.
Good luck this week everybody!

Bitcoin - Bitcoin Left Behind the Stock Market!?Bitcoin is in its descending channel on the four-hour timeframe, between the EMA50 and EMA200. In case of an upward correction towards the specified supply zone, it is possible to sell Bitcoin with a better risk-reward.
It should be noted that there is a possibility of heavy fluctuations and shadows due to the movement of whales in the market and compliance with capital management in the cryptocurrency market will be more important. If the downward trend continues, we can buy in the demand range.
A group of U.S. lawmakers has called on the Securities and Exchange Commission (SEC) to enforce an executive order issued by President Donald Trump that opens the door for cryptocurrency investments within the $12.5 trillion 401(k) retirement fund market. Signed in August, the order authorizes 401(k) plans to offer cryptocurrencies as a new investment option.
Members of the House Financial Services Committee, in a formal letter, praised the order for its potential to help Americans boost their retirement savings. They urged the SEC to work with the Department of Labor to update existing rules and guidelines, with the aim of enabling millions of Americans to gain access to such investment opportunities for their retirement.
The letter further stated: “We also ask the SEC to review the bipartisan bills currently advancing in the 119th Congress regarding accredited investors. We hope these measures will allow the 90 million Americans who are currently excluded from alternative investments to secure a more dignified and comfortable retirement.”
Meanwhile, the Senate Finance Committee announced that it will hold a hearing this week on the issue of digital asset taxation, as industry stakeholders continue to press for greater clarity in federal regulations.
According to Committee Chairman Mike Crapo, the session—titled “Examining the Taxation of Digital Assets”—is scheduled for October 1. The official notice confirmed that Lawrence Zlatkin, Vice President of Tax at Coinbase, and Jason Somensatto, Policy Director at Coin Center, will testify at the hearing.
The committee had earlier invited public comments on how existing tax laws should apply to digital assets and whether new legislative frameworks are needed. The upcoming session is expected to draw heavily on the recommendations of the White House Digital Asset Working Group, which urged lawmakers to recognize cryptocurrencies as a distinct asset class and establish tailored tax rules separate from those applied to commodities and securities.
From a market perspective, liquidation heatmaps in the futures market highlight clusters of leveraged positions at key levels. When the price fell between $114,000 and $112,000, a wave of long liquidations occurred simultaneously, leading to heavy wipeouts and accelerating the downward momentum.
Risk pockets remain around the $117,000 level, making both sides of the market vulnerable to liquidity-driven volatility. Without strong demand at these levels, fragility persists, increasing the likelihood of another sharp downward move.

#BTCUSDT.P (15m Chart)#BTCUSDT.P
(15m Chart)
🔹️ Update 🔹️
Entry zone (109,800 – 109,500) was not reached,
but Targets 1, 2, and 3 (111,000 – 112,400) have been hit ✅
⚠️ Bullish scenario played out, but no entry was triggered. Risk management first.
🆔 @Rasoolahmadi

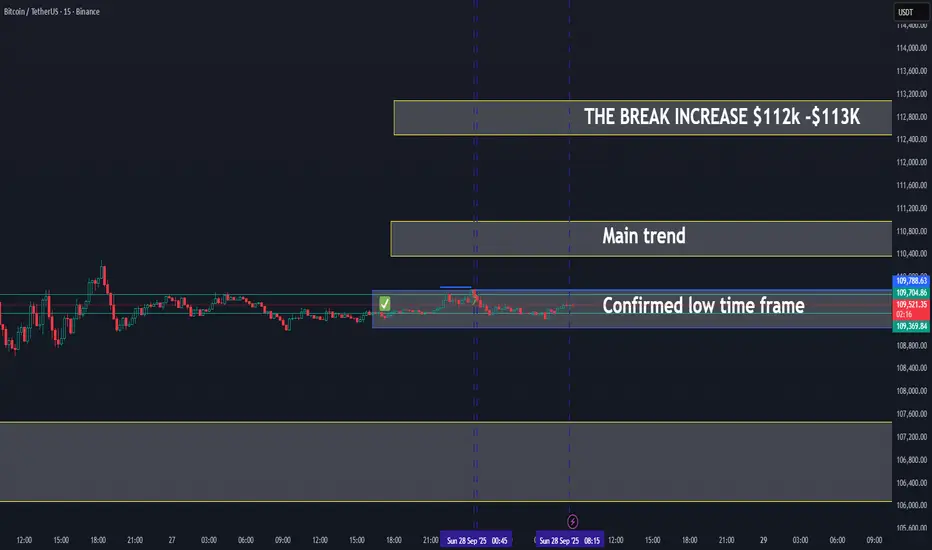
BITCOIN ON WAY TO MAINTREND - UPDATE 28-09-2025📊BTC/USDT Trading Update
✅ Low time frame confirmed: Bitcoin has established support in the $109.3K – $109.7K zone, which now acts as a strong base.
📈 Price is moving toward the main trend zone ($110.8K – $111.5K). This will be the key resistance area to watch.
🔑 Breakout potential:
If BTC clears the main trend zone, momentum could accelerate with the next target around $112K – $113K.
This would confirm a stronger continuation of the short-term uptrend.
Scenarios:
Bullish case: Hold above $109.3K and break $111.5K → expansion toward $112K – $113K.
Bearish case: Failure to break the main trend could lead to sideways action or retest of $109K support.
📌 Summary:
BTC has confirmed its low time frame breakout and is now targeting the main trend zone. A break above this range will likely fuel a push toward $112K – $113K.
$BTC Sunday Update Bitcoin dumped over 8K, exactly as I warned CRYPTOCAP:BTC Sunday Update
Bitcoin dumped over 8K, exactly as I warned many times at 115K. This is now the 2nd time price has rejected and fallen below 110K. I’m still holding shorts, and if we push back to 115K again, I’ll add more. My downside targets haven’t changed: 105K, 100K, 95K, 90K or below. Altcoin pumps are only traps before the bigger drop.
BTC TREND CHANNEL - BITCOIN TRENDING UPTRENDBitcoin is in a new uptrend on the lower time frames. There is a high chance BTC will target between $112K and $113K in the short term. From there, we could see the daily trend of Bitcoin develop further.
Follow this channel for daily BTC updates
Thank you

BTC 1H Analysis - Key Triggers Ahead | Day 48❄️ Welcome to the cryptos winter , I hope you’ve started your day well.
⏰ We’re analyzing BINANCE:BTCUSDT on the 1-Hour timeframe .
👀 On the 1-hour timeframe, Bitcoin previously formed a consolidation box at a higher range. After breaking the bottom of that box, it moved down to its support area around $108,800. Since the start of the weekend, price has been ranging in this zone, forming a new consolidation structure. The bottom of this range overlaps with the Tether Dominance resistance, creating a key confluence level. Candle size has been shrinking, signaling an incoming decision point for the next move.
A break above the range high at $109,755 could trigger upward momentum. An important detail here is the fakeout at the top of the range, where buyers failed to push higher and sellers drove price back down.
🧮 The RSI oscillator shows two key levels:
52: Slightly above the 50 baseline, acting as momentum resistance.
30: At the oversold boundary, where a breakdown could start a stronger move.
The previous fakeout at the range high was aligned with a rejection from the RSI resistance around 52, which reinforces the validity of this level. A momentum breakout through this zone could support a long setup.
🕯 Candle size and volume have significantly decreased due to consolidation and the weekend lull. With increased volume at the start of the new week, we can expect stronger candles. It doesn't matter which direction initiates the move — the breakout from this range will likely occur through a whale candle that clears the orderbook in one direction.
💵 From earlier Tether Dominance analysis, a break below 4.46% could inject bullish volume into the market and allow Bitcoin to break its range high and begin a new upward leg. However, a break above 4.72% on Tether Dominance could trigger deeper correction in Bitcoin, pushing it toward lower supports.
🧠 Two main scenarios for Bitcoin positions are currently in play:
1️⃣ Long Setup :
Wait for multiple rejections to complete and for Tether Dominance to lose the 4.46% support. A small green indecision candle before the breakout on Bitcoin would offer a clean entry with a tight stop. As volume increases and confirmation appears, the long position can be held to a suitable reward target. This setup can be taken in inverse correlation to Tether Dominance, using bearish candles there as confirmation.
2️⃣ Short Setup :
If Tether Dominance breaks above resistance and Bitcoin loses its current range support — combined with RSI dropping below 30 and price stabilizing under current support, ideally with a red indecision candle — a short setup becomes valid. However, note that Bitcoin demand is currently rising, and upward movement could occur at any moment. Personally, you prefer not to take short positions here.
❤️ Disclaimer : This analysis is purely based on my personal opinion and I only trade if the stated triggers are activated .

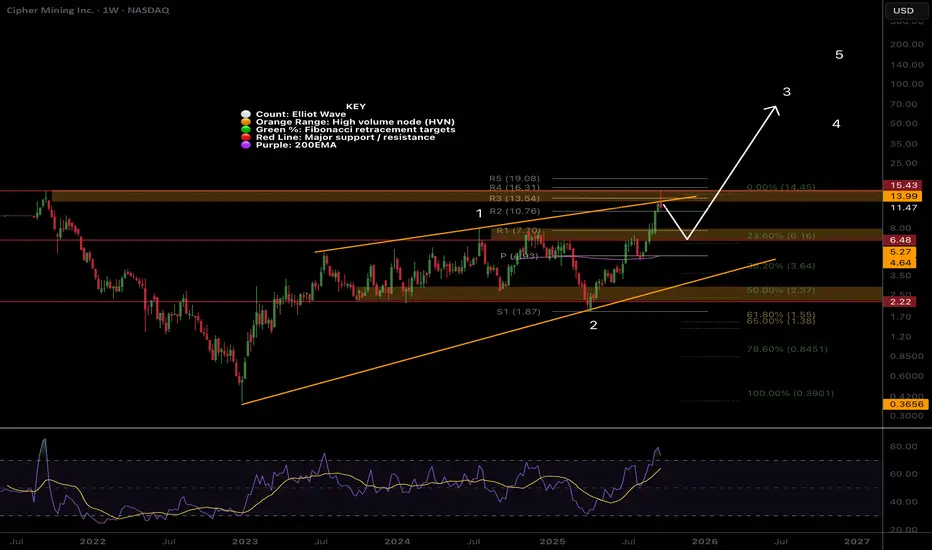
CIFR Ready for retracement...Wave 3 appears to be underway on NASDAQ:CIFR with wave (1) peaking with a pop into the all time high volume node as expected for wave 1 termination, trapping new traders and investors with the excitement!
Sentiment is very greedy on social and mainstream media suggesting a top is here!
Wave 2 retracement is expected to find support at the High Volume Node and 0.236 Fibonacci retracement $6.48 where it should find confluence with the weekly 200EMA and R1 pivot.
Weekly RSI is overbought with no divergence.
Wave 3 has an expected target of at least $50
Safe trading
IREN Wave 3 complete Wave 3 appears to be complete with a thrust above the weekly R5 pivot on NASDAQ:IREN .
Sentiment is extremely greed on social and mainstream media warning of a top.
Wave 4 has a target of the R3 pivot and 23.6 Fibonacci retracement at $28, new traders and investors will be trapped buying the hype...
I will look for new longs in this area as I think we go higher long term...
Safe trading

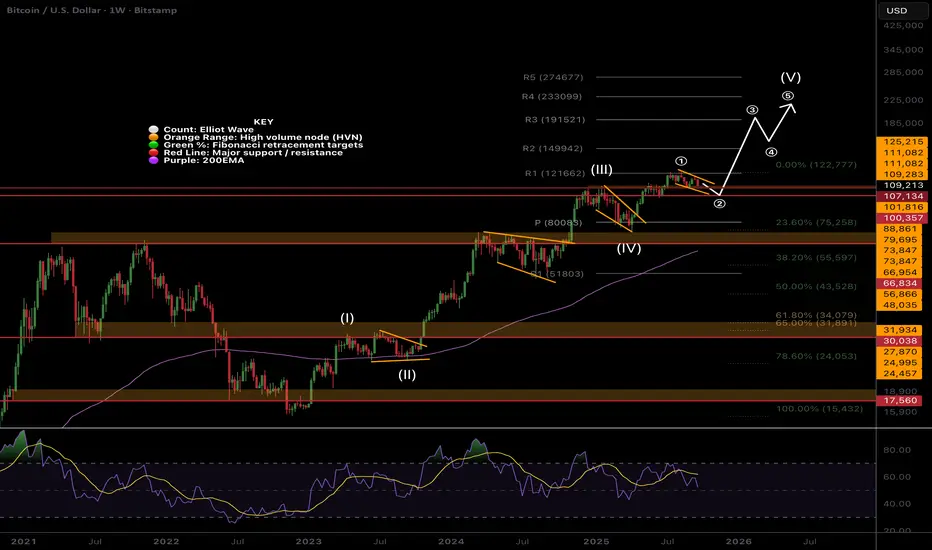
BTC Macro Outlook, Why all the Worry?When you zoom out CRYPTOCAP:BTC looks fantastic, sitting in a range at all time high, but the sentiment is extremely negative, a winning combination for continued upside!
Wave (1) of V into all high appears complete at the R1 pivot. Wave 2 has a downside target of the next High Volume Node at $107k the previous all time high range.
A deeper pullback to the weekly pivot would not be surprising and hit investors hard into capitulation, reminiscent of 2017. Price would meet with the rising weekly 200EMA around $80k. This move could present an excellent buy opportunity and would still have the same terminal targets in the long run!
For now the trend is up with price so far doing a x8 from bottom. TradFi dream of returns like this.
Weekly bearish divergences are dropping away as RSI is back at the EQ.
Safe trading
BTC LOOKS POSITIVE ON LOW TIME FRAME - UPDATE 27-09-2025BTC/USDT Update
On the low time frame, BTC has turned positive, showing signs of recovery after consolidation.
Price action is now trending upward toward the main trend zone, which will be the key resistance area to watch.
Key levels:
Low time frame zone → currently acting as support after the bounce.
Main trend zone → upcoming resistance. A clean breakout and confirmation above this level would strengthen the bullish case.
Upside scenario: If BTC can reclaim and hold above the main trend zone, momentum could expand strongly, shifting structure back into an uptrend.
Downside risk: Failure to break into the main trend zone could keep BTC stuck in sideways or corrective action.
📌 Summary
BTC is up on the low time frame → short-term momentum is bullish.
Next target: main trend zone for confirmation.
Break above main trend = uptrend confirmation; rejection = sideways risk.

BITCOIN SIGNAL: PROBABILITIES SHOWING THIS NOW!! (careful) Yello Paradisers! Enjoy the video!
And Paradisers! Keep in mind to trade only with a proper professional trading strategy. Wait for confirmations. Play with tactics. This is the only way you can be long-term profitable.
Remember, don’t trade without confirmations. Wait for them before creating a trade. Be disciplined, patient, and emotionally controlled. Only trade the highest probability setups with the greatest risk to reward ratio. This will ensure that you become a long-term profitable professional trader.
Don't be a gambler. Don't try to get rich quick. Make sure that your trading is professionally based on proper strategies and trade tactics.

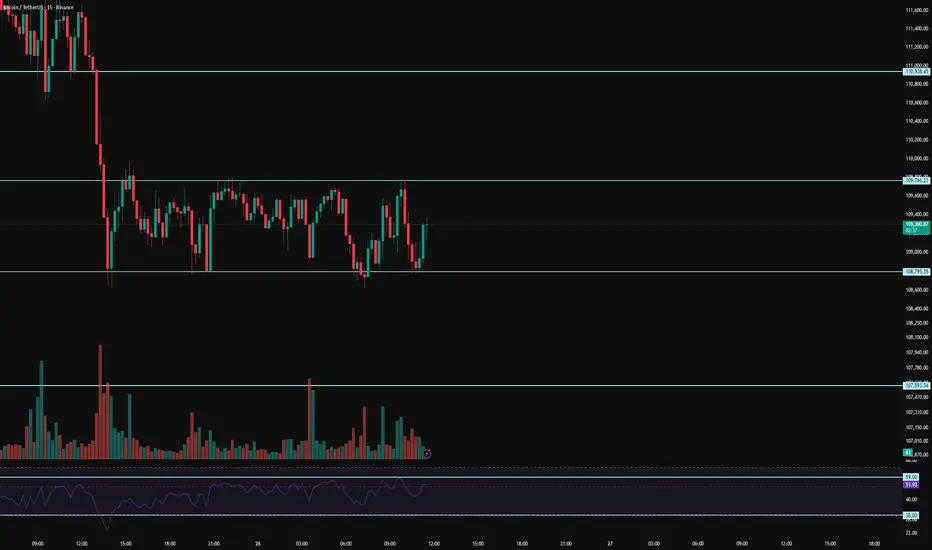
BTC 15M Analysis - Key Triggers Ahead | Day 47❄️ Welcome to the cryptos winter , I hope you’ve started your day well.
⏰ We’re analyzing BTC on the 15-Minutes timeframe .
👀 After several days of decline from the zones we previously identified, we are back to analyze Bitcoin for you. On the 15-minute timeframe, Bitcoin is consolidating above the $108,800 support level, with the upper boundary of this consolidation at $109,760. A breakout above this level could signal the beginning of a new structure and trend. A breakdown below support, however, seems less convincing for a short position, as many traders who feel they missed out are now stepping in to buy. Current support zones are acting as both maker and taker buy levels. Bitcoin requires increased volume to confirm either a breakout or breakdown. With the upcoming weekend, however, risks must be carefully managed due to typically lower market activity.
🧮 Looking at the RSI oscillator, it is currently holding above the 50 level but facing resistance around 59. A breakout above 59 could enable Bitcoin to break consolidation resistance and push higher. On the other hand, a key zone lies near the oversold boundary; if Bitcoin enters this area, selling pressure could intensify and trigger a deeper correction.
🕯 Candle size and volume on the 15-minute chart remain within a range. We must wait for significant volume inflow—either upward or downward—to confirm direction. Bitcoin is shaping a new structure for the upcoming week, so patience is required until a breakout with decisive green or red candles occurs.
🧠 Trading outlook: It is preferable to wait for market structure to mature, with multiple tests of both support and resistance. The candlestick type used for entry is crucial, along with momentum confirmation at key RSI levels. A breakout above $109,766 combined with RSI surpassing 59 could provide a long setup. A breakdown below $108,795 combined with RSI falling below 30 and stronger selling pressure could trigger a short setup. Keep in mind that weekend trading usually comes with lower volume, which may result in indecisive structures—unless an unexpected global event sparks volatility.
❤️ Disclaimer : This analysis is purely based on my personal opinion and I only trade if the stated triggers are activated .
Bitcoin Roadmap: Can BTC Hold the $108K Before Next Big move!?Bitcoin( BINANCE:BTCUSDT ) managed to break the Support zone($110,920-$109,900) and Support lines yesterday with the help of a Bearish Marubozu Candle(the Marubozu candle volume was acceptable).
Bitcoin is still moving in the Heavy Support zone($112,000-$105,800) and near the important Support line, Potential Reversal Zone(PRZ) , Cumulative Long Liquidation Leverage($108,165-$107,000).
In terms of Elliott Wave theory, Bitcoin appears to be completing microwave 5 of the main wave 3. Microwave 4 of the main wave 3 is of the Contracting Triangle type, and the main wave 3 is of the extended type.
I expect Bitcoin to start rising and attack the Resistance lines after completing the main wave 3 from the Potential Reversal Zone(PRZ) , Support zone($108,200-$107,240), and Important Support line.
Cumulative Short Liquidation Leverage: $110,624-$109,836
Note: If Bitcoin touches $106,800, we can expect a break of the Heavy Support zone($112,000-$105,800).
Note: If Bitcoin goes above $111,000, we can expect a renewed rise in Bitcoin.
---------------------------------------------
One of the indices that helps the Roadmap of Bitcoin and other tokens is the USDT.D%.
USDT.D% currently seems to have managed to break the heavy resistance zone and this is NOT good news for Bitcoin and other tokens, and perhaps a further correction in the crypto market is on the way.
USDT.D%’s roadmap for me is that it is almost in line with today’s analysis of Bitcoin.
---------------------------------------------
Please respect each other's ideas and express them politely if you agree or disagree.
Bitcoin Analysis (BTCUSDT), 1-hour time frame.
Be sure to follow the updated ideas.
Do not forget to put a Stop loss for your positions (For every position you want to open).
Please follow your strategy and updates; this is just my Idea, and I will gladly see your ideas in this post.
Please do not forget the ✅' like '✅ button 🙏😊 & Share it with your friends; thanks, and Trade safe.

Bitcoin dominance VS. Altcoins run phaseBTC dominance has broken below its major uptrend, and we may see very positive movements in altcoins in the coming period.

btc run itEvery correction in Bitcoin bull run is the preparation for a new parabolic rise.
CRYPTOCAP:BTC

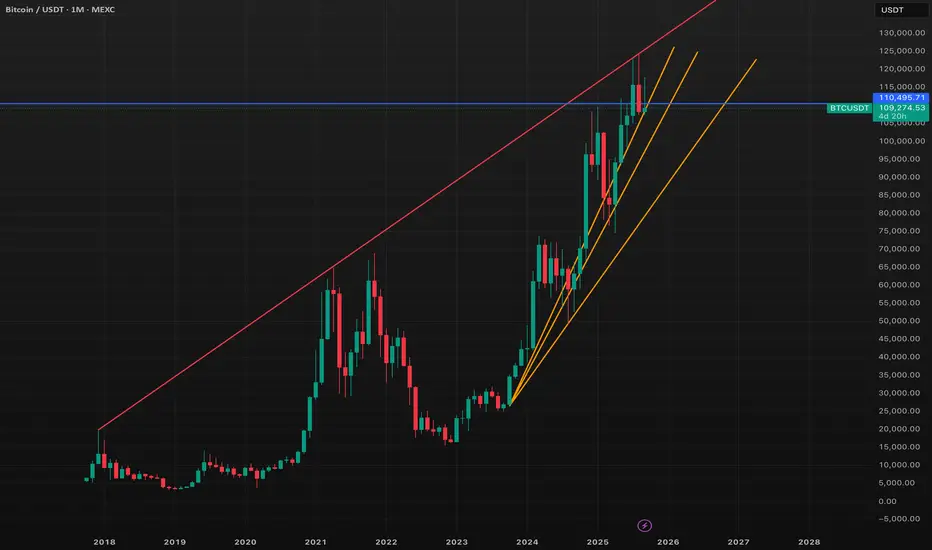
Bitcoin Analysis: Critical Support LevelsBitcoin's current price action presents an interesting technical setup that can be analyzed through the lens of the fan principle. This approach reveals multiple key support levels that deserve attention, particularly the crucial 109-110K zone where Bitcoin currently finds itself.
Understanding the Fan Principle
The fan principle is a technical analysis concept that uses multiple trendlines emanating from a common point, creating successive support and resistance levels. In Bitcoin's case, these fan lines have developed over several years and now present a clear hierarchy of critical price levels that the market must respect or break.
The most immediate and important of these levels sits at 109-110K. This zone represents more than just another support level - it serves as the foundation for Bitcoin's current market structure. How Bitcoin reacts at this level will likely determine the near-term direction and set the tone for what could be a significant move in either direction.
The 8-Year Resistance: Two Rejections and Counting
A critical element in Bitcoin's current technical picture is the 8-year resistance trendline, clearly visible as the red line on the chart. This long-term resistance has proven its significance through price action, having already rejected Bitcoin twice upon contact. These two previous rejections demonstrate the strength and importance of this multi-year technical level.
The pattern of rejection followed by renewed approach is a classic technical setup. Each time Bitcoin has touched this 8-year resistance, it has been turned away, creating a well-defined ceiling that has influenced price action over an extended period. However, repeated tests of resistance levels often lead to eventual breaks, as the selling pressure at these levels can become exhausted over time.
Should Bitcoin manage to hold the current 109-110K support zone and mount another attempt at this 8-year resistance, a successful break would represent a major shift in market structure. Given the two previous rejections, a third attempt that results in a clean break could open the door to new all-time highs, as it would finally eliminate this long-standing technical barrier that has capped Bitcoin's upward movement.
Multiple Scenarios at Play
The fan principle suggests several potential outcomes from the current position. If the 109-110K level holds as support, Bitcoin could use this as a springboard for higher prices, potentially testing and breaking the 8-year resistance. The orange and yellow fan lines extending upward provide potential targets in such a scenario, with projections reaching into 2026 and beyond.
Conversely, a failure to hold the 109-110K zone would shift focus to lower fan support levels. The fan structure provides a roadmap for where Bitcoin might find its next significant support should the current level fail to hold.
Market Structure Considerations
The convergence of multiple technical factors at current levels makes this period particularly noteworthy. The fan principle, combined with the 8-year resistance test, creates a situation where Bitcoin faces both significant support below and meaningful resistance above. This compression often leads to decisive moves in one direction or the other.
The long-term nature of these technical levels also suggests that any major move from here could have lasting implications for Bitcoin's price trajectory. Breaks of multi-year technical levels tend to trigger substantial follow-through in the direction of the break.
Looking Ahead
Bitcoin's position relative to these fan-based support levels and the 8-year resistance creates multiple potential paths forward. The key will be monitoring how price action unfolds around these critical levels, as they provide a technical roadmap for both bullish and bearish scenarios.
The fan principle analysis suggests that maintaining the 109-110K level is crucial for any bullish continuation, while a break of this support could lead to a test of lower fan levels. Meanwhile, any eventual break of the 8-year resistance would represent a significant technical development with potentially far-reaching implications for Bitcoin's long-term trajectory.
As with any technical analysis, these levels provide guidance rather than guarantees, and market participants should monitor price action closely as it unfolds around these critical zones.
Treasury General Account MAJOR Impact on $BTC PriceI’ll be the first to admit I failed to closely follow and analyze the impact of the Treasury General Account (TGA).
We all know it’s a liquidity suck on ₿itcoin and cryptocurrencies, which are the most highly sensitive assets to liquidity, but have you ever dove into the data to see just how impactful it is?
I went through all the refills and calculated how much it drew down the CRYPTOCAP:BTC price.
Note how TGA refills also marked cycle tops in 2017 and 2021.
This really is something to closely monitor going forward alongside Total Global Liquidity (TGL).
What I have found is when TGA refills are occurring, they have more impact on the price of BTC than TGL.
We can see this in the current state of market, where TGL is at an ATH and the TGA is currently being refilled.
GOOD NEWS: The TGA refill is just about complete 🏁
Moon on brave soldiers 🌛
