BITCOIN PREDICTION: a SECRET PATTERN is FORMING (watch out)!!!Yello paradisers! In this Bitcoin prediction, I'm updating you about the crash we predicted earlier in previous videos. I'm showing you on a high timeframe chart the ABC corrective mode wave; we are now forming the C wave. The C wave subdivides itself into five smaller waves because it's a motive mode wave. We are taking a look at the volume. We understand that bears are still in power, so we are waiting for some nice volume from bulls. We are spectating a bullish divergence on the MACD indicator. On RSI, there is exaggerated bullish divergence, and in stochastic RSI, we are in an oversold area.
Then, we are shifting our focus to a medium timeframe. We are zooming into the fourth wave, where we are making our sub-waves right now. On the medium timeframe, we are also spectating bearish divergence. We are waiting for the second booby that will basically increase the probabilities of absorption.
As we have seen previously, that helped us to predict that Bitcoin will be crashing. We are also taking a look at our head and shoulders target, which is at $109,000.
Then we are shifting our focus to a lower timeframe, where we are seeing the secret pattern, triple three. Right now, we are creating a sub-wave XX, which is forming itself as a possible zigzag. Paradisers, make sure that you are trading professionally, focus on long-term growth, and avoid get-rich-quick schemes. Any shortage in trading usually ends up sooner or later in bankruptcy.
Remember, don’t trade without confirmations. Wait for them before creating a trade. Be disciplined, patient, and emotionally controlled. Only trade the highest probability setups with the greatest risk to reward ratio. This will ensure that you become a long-term profitable professional trader.
Don't be a gambler. Don't try to get rich quick. Make sure that your trading is professionally based on proper strategies and trade tactics.
Btc-bitcoin

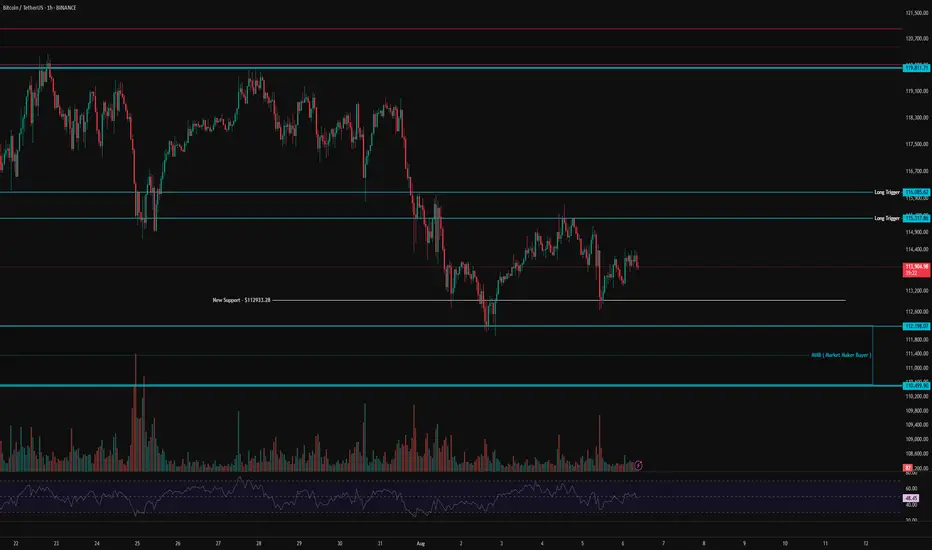
BTC 1H Analysis – Key Triggers Ahead | Day 3💀 Hey , how's it going ? Come over here — Satoshi got something for you !
⏰ We’re analyzing BTC on the 1-hour timeframe .
⏱ We’re analyzing Bitcoin on the 1-hour timeframe.
👀 After bouncing from the current $113,000 area, Bitcoin moved upward, indicating the presence of market maker buyers in this zone. A short-term support has formed at $113,000, and yesterday we saw a strong rejection from this level, which helped prevent further selling pressure.
Bitcoin now faces a resistance zone and a potential long entry trigger between $115,317 and $116,085. If long positions increase and short positions get squeezed, this resistance could be broken, potentially fueling a bullish move.
⚙️ On the RSI, our key level is the 50 range. A confirmed hold above this level could signal a higher low forming relative to the previous bottom at $112,933.
🕯 We’re seeing an increase in trading volume, and as the price moves closer to $110,499, there's a noticeable liquidity pull from long positions—more buyers are stepping in around this area.
📈 Our long position trigger lies within the resistance zone mentioned. A confirmed breakout and hold above this level, alongside RSI entering Overbought across multiple timeframes and volume expansion, would give us a solid entry for a long position.
📉 Our short position trigger is below $112,200. A sharp drop with strong selling pressure and RSI entering Oversold would justify a short entry—though I do not recommend taking this trade.
❤️ Disclaimer : This analysis is purely based on my personal opinion and I only trade if the stated triggers are activated .
BTC 8H – Fib Support Holds, Will Bulls Defend This Reclaim Zone?Bitcoin is back at a key decision point on the 8H chart — retesting the exact zone it broke out from just two weeks ago. This former resistance has flipped to support, but with momentum cooling off, bulls need to step in fast to avoid a deeper retrace.
🔹 Structure & Levels
Price is hovering inside a reclaimed range (blue box), retesting it from above.
Just below sits the Golden Pocket (0.5–0.618) retracement zone from the July rally — a classic bounce zone if the reclaim fails.
The 0.5 level at $110,879 aligns with previous consolidation structure, adding extra confluence.
Further below lies the 0.786 at $103,802, which marks invalidation for most swing long setups.
🔹 Momentum Check
The Stoch RSI has started curling down from overbought, suggesting momentum may stall short term.
If bulls can’t defend the current reclaim zone, we could see a flush into the Fib pocket before trend continuation.
🔹 Bias & Trade Idea
Holding this level = bullish continuation toward $118K–$120K range highs.
Lose it cleanly = watch for signs of reversal inside the golden pocket.
Risk is defined, structure is clear — and BTC has a habit of reacting cleanly to these zones.
Are you buying the dip now — or waiting for a cleaner tag of the Fib levels?
Drop your thoughts 👇

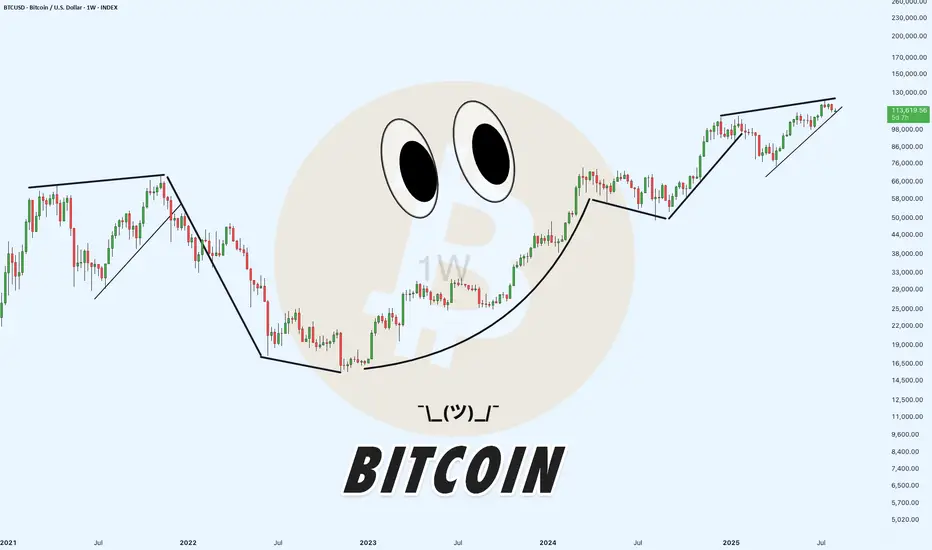
BITCOIN RUN IS NOT OVER!bitcoin historically ends its run in Q4, the year after the year in which the major downtrend breakout occurs

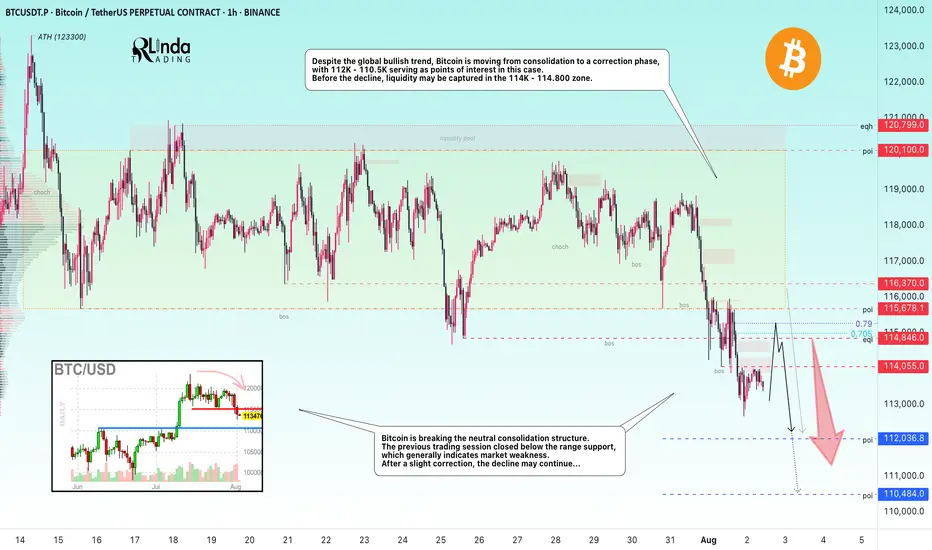
BITCOIN → From consolidation to distribution. Market weaknessBINANCE:BTCUSDT.P is moving from consolidation to a correction phase. The price broke through the support zone of 114.5–115.5, closing within the Friday trading session in the sell zone...
Previous idea from July 22: BITCOIN → Consolidation and compression to 116K. Correction?
The fundamental background is shifting to neutral, the hype has temporarily ended, and there are no bullish drivers yet. And for the health of the market, a correction is needed. Bitcoin is breaking the neutral consolidation structure. The previous trading session closed below the support range, which generally indicates market weakness. Despite the global bullish trend, Bitcoin is moving from consolidation to a correction phase, with 112K - 110.5K serving as points of interest in this case. Before the fall, liquidity may be captured in the 114K - 114.800 zone.
Resistance levels: 114.05, 114.85, 115.67
Support levels: 112.03, 110.48
After a strong movement, the market may enter a correction or local consolidation, during which it may test the specified resistance zones before continuing its downward movement to the zone of interest and liquidity at 112 - 110.5.
Best regards, R. Linda!
BITCOIN CRASH PREDICTED! HERE’S WHAT HAPPENS NEXT! (scary)Yello Paradisers, Bitcoin crashed exactly as we predicted in the previous videos that it will happen with the highest probability.
In this video I am explaining to you what's gonna happen next.
Head and shoulders, neckline, is be breaking to the downside, we need a clear confirmation of a reclaim Our channel on high timeframe is getting breakout to the downside and confirmation was that a reclaim was already successful.
In this video I'm sharing with you Elliott Way theory on low timeframe and what needs to be done for confirmation perspective in order for us to continue to go to the downside or have a reversal to the upside.
Don't be a gambler. Don't try to get rich quick. Make sure that your trading is professionally based on proper strategies and trade tactics.

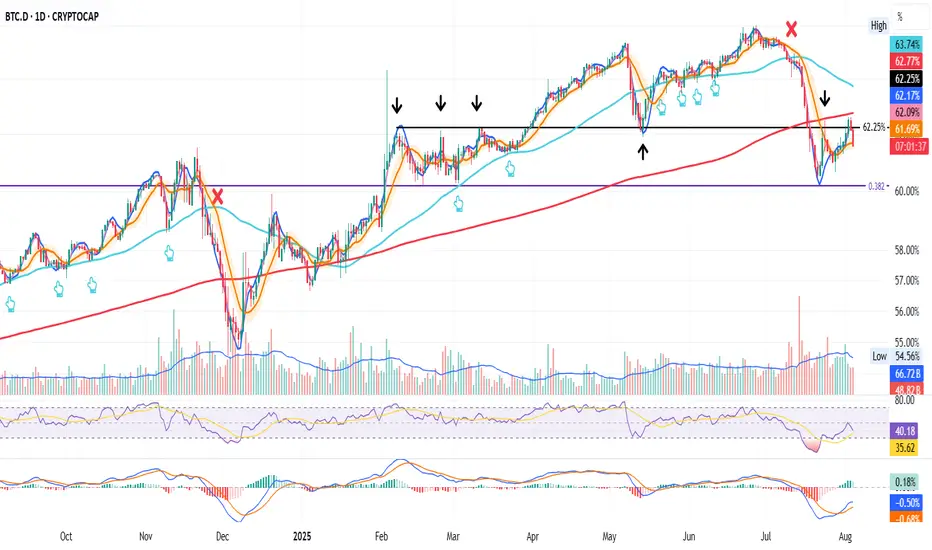
BTC.D on the Daily – Key Rejection in Play
BTC Dominance pushed into the 200MA on August 2nd.
On August 3rd, it got rejected and closed below the 62.25% key resistance.
Today, August 4th, that same level is acting as resistance again.
If today's candle closes below the BB center (orange),
we could see another move back to the bottom of the range
with the 0.382 Fib near 60% as the next key level to watch.
Momentum is fading at resistance.
Structure favors a deeper retest.
We’ll be here to watch it unfold.
Always take profits and manage risk.
Interaction is welcome.
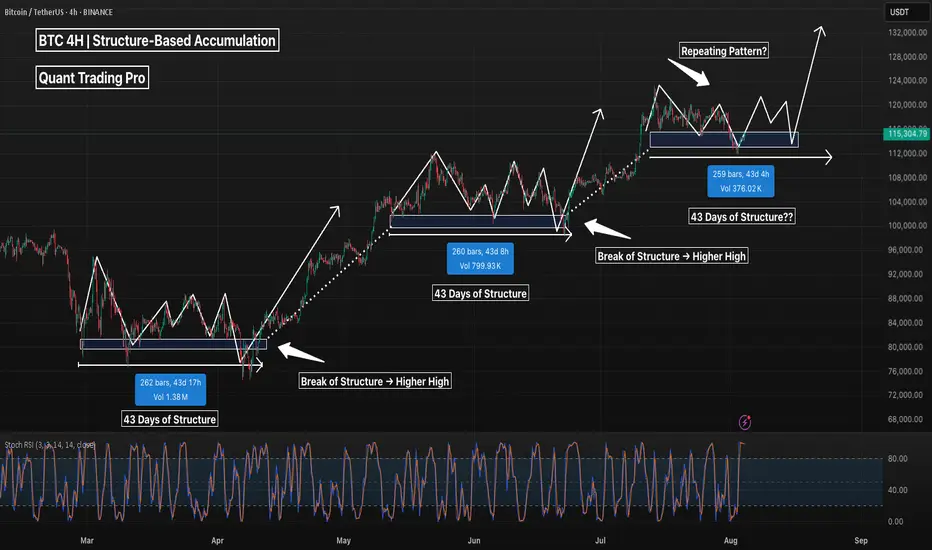
BTC 4H – Repeating Accumulation Pattern, But Will It Hold Again?Bitcoin has shown a clear structural tendency to consolidate for ~43 days at key demand zones before breaking to new highs. This 4H chart highlights three nearly identical accumulation phases, each lasting around 260 bars with a clear base, fakeout, and bullish continuation.
We’re now sitting in the fourth demand zone, with price revisiting the same volume pocket and reclaiming key structure. If history repeats, we may be looking at another breakout leg above $124K+.
Key observations:
– Each consolidation zone lasted ~43 days
– Volume decreases into the base → demand absorption
– Reclaim of structure precedes each leg up
– Current consolidation mirrors previous 3 (in time, shape, and volume)
⚠️ A clean break below ~$112K would invalidate the pattern and suggest deeper retracement.
Are we seeing another accumulation leg… or distribution in disguise?
Drop your thoughts below.
#Bitcoin #BTCUSDT #Crypto #TradingView #PriceAction #MarketStructure #BTC4H #CryptoAnalysis #Accumulation #Wyckoff #SwingTrading #PatternRecognition #TechnicalAnalysis
others \ btcOthers bitcoin pair has found support from the rising trend line since 2016 2017 and continues to recover

04/08/25 Weekly OutlookLast weeks high: $119,809.82
Last weeks low: $111,917.76
Midpoint: $115,863.79
First net outflow for BTC in seven weeks (-$643m) following the FOMC data release and also month end. Yet again no change by the FED but the chances of Septembers FOMC giving us a rate cut has drastically increased, currently at a 78.5% chance of a 25Bps cut.
Month end usually gives us a pullback/sell-off as larger institutions window dress which often includes de-risking somewhat. We saw this last Thursday combined with the weekends typical lower volume has resulted in quite a significant correction for BTC. Altcoins have down the same as many assets reject from HTF resistance areas, the correction has been on the cards and isn't too worrying on the face of it.
What I would say is August seasonality is generally not a bullish month and so expecting price to rebound and extend the rally would go against historical trends. I could see more of a ranging environment taking place for several weeks before any next leg up is possible.
This week I would like to see where altcoins find support and establish a trading range where some rotational setups tend to present themselves.

Bitcoin - Will Bitcoin reach its previous ATH?!Bitcoin is below the EMA50 and EMA200 on the four-hour timeframe and is in its short-term descending channel. In case of an upward correction, Bitcoin can be sold from the specified supply zone, which is also at the intersection of the ceiling of the descending channel.
It should be noted that there is a possibility of heavy fluctuations and shadows due to the movement of whales in the market and compliance with capital management in the cryptocurrency market will be more important. If the downward trend continues, we can buy in the demand range.
In recent days, Bitcoin has stabilized below the $120,000 mark, a development that reflects increasing structural maturity in the market and strong institutional capital inflows. Unlike in previous cycles, where price rallies were largely driven by retail hype, the current liquidity flows are channeled through regulated and professional instruments like ETFs. During the month of July alone, Bitcoin ETFs attracted over $6 billion in inflows, marking the third-highest monthly inflow in their history. Leading this trend were BlackRock’s IBIT and Fidelity’s FBTC, which together recorded more than $1.2 billion in net inflows within a single week. This signals a shift in trust from traditional investors toward crypto markets—within transparent, traceable, and regulated frameworks.
On-chain metrics further validate this shift. The MVRV ratio, which compares market value to realized value, is currently fluctuating between 2.2 and 2.34. These levels do not indicate profit-taking extremes nor fear of major corrections, but instead point to a healthy and rationally profitable market. Meanwhile, the supply of Bitcoin held in non-exchange wallets is rising, while exchange-held balances have dropped to their lowest levels in a decade, now accounting for just 1.25% of total supply. This trend implies reduced short-term selling pressure, as coins transition from liquid to long-term holdings.
Trader behavior is also evolving. Unlike previous bull runs, profit-taking remains controlled. The SOPR index, which measures realized profit relative to purchase price, has not yet reached saturation levels. This suggests that current holders are not satisfied with existing gains and are anticipating higher price levels. Furthermore, metrics like daily active addresses remain stable, indicating a lack of speculative retail influx. The network’s current dynamics resemble those of mature traditional markets, where investment decisions are guided by analysis, discipline, and long-term perspective.
Analysts at major financial institutions believe that if this trend continues, Bitcoin could reach targets of $180,000 to $200,000 by year-end. A more conservative scenario places the $95,000 to $100,000 range as a strong support zone—especially if political, regulatory, or macroeconomic pressures intensify. Overall, the convergence of institutional capital, rational trader behavior, stable on-chain conditions, and regulatory clarity has transformed Bitcoin into a more structured and dependable asset than ever before.
Ultimately, Bitcoin is no longer just a speculative tool. It has secured its role as a legitimate asset within the portfolios of global financial institutions. Even if the pace of capital inflow is slower than in previous cycles, the underlying structure is more robust and sustainable—offering a clearer path toward broader global adoption and higher valuation.
Nonetheless, recent data from CryptoQuant suggests that long-term Bitcoin holders (LTHs) have begun net selling near the $120,000 resistance zone—a psychologically significant level in Bitcoin’s price history. Analysts interpret this as a potential sign that veteran investors—those who entered during earlier market cycles—are now realizing profits as prices reach historic highs. If short-term holders follow suit, this shift could amplify selling pressure and trigger heightened price volatility.

BTC rally starts / 241.000$Bitcoin is entering the last bullish rally before bear market. I want to see new phase of euphoria on crypto and altcoins also and overbought on RSI indicator

JUST HODL IT BITCOINTrendline breakout from 2017 and 2021 local highs has occurred and is being retested

$BTC Weekly Close Keeps Bullish StructureCRYPTOCAP:BTC looking hopeful closing the Week just above previous ATH POI and above the SMA9.
PA needs to stay above this to keep bullish momentum.
the CME Gap was filled, which was the main objective on this correction.
Let’s see how the market reacts on judgement day tomorrow 🤓
Seven topics explaining why Ethereum might be heading towards atSeven topics explaining why Ethereum might be heading towards at least $4,500 after returning to its trend:
1. Market Sentiment and Bullish Reversal
When Ethereum breaks out of a consolidation phase or a downtrend, it often signals a shift in market psychology. A bullish reversal can be triggered by technical patterns such as ascending triangles, breakouts above key resistance levels, or bullish candlestick formations. Positive news (e.g., regulatory clarity, major partnerships, or favorable market reports) enhances investor confidence. Once traders recognize a trend reversal, it leads to increased buying momentum, further propelling ETH higher. This shift in sentiment often acts as a self-fulfilling prophecy, attracting more capital into the asset.
2. Institutional Adoption and Investment
Institutional investors, including hedge funds, asset managers, and pension funds, play a crucial role in cryptocurrency price dynamics. Large-scale investments, ETFs, or custodial solutions designed for institutional clients can generate significant buy pressure. Notable endorsements from major financial firms or integration of Ethereum-based products into mainstream financial platforms can serve as a validation, encouraging broader participation. This institutional involvement often brings stability and confidence, supporting sustained upward movement towards higher targets like $4,500.
3. DeFi and NFT Growth
Ethereum's ecosystem is the backbone of the decentralized finance (DeFi) sector and NFTs. The expanding adoption of DeFi applications (lending, borrowing, staking) and booming NFT markets increase demand for ETH, since it is essential for transaction fees and smart contract execution. As new projects and use cases emerge, the utility of ETH grows, directly impacting its value. Additionally, mainstream adoption of DeFi and NFTs draws more retail and institutional investors into the ecosystem, contributing to price appreciation.
4. Network Developments
Ethereum continues to undergo significant upgrades to address scalability, security, and sustainability. Ethereum 2.0, with features like proof-of-stake (PoS) consensus, shard chains, and Layer 2 scaling solutions (like Rollups), greatly enhance network efficiency. These upgrades improve user experience and reduce transaction costs, making Ethereum more attractive for developers and users. The improving technology infrastructure can result in increased transaction volume, user activity, and investor confidence, which collectively drive the price upward.
5. Macro and Cryptocurrency Market Factors
Broader macroeconomic conditions influence Ethereum’s price. A declining dollar, inflation concerns, or global economic uncertainty can push investors toward alternative assets like cryptocurrencies. Bitcoin’s market movement often correlates with ETH, and a bullish Bitcoin trend can lift ETH prices as well. Additionally, positive regulatory developments or a general rally in the crypto market can create a favorable environment, supporting Ethereum’s ascent to higher levels.
6. Technical Indicators
Traders rely heavily on technical analysis. Breakouts above significant resistance levels (e.g., previous highs around $3,500 or $4,000), increased trading volume, and bullish chart patterns such as flags or bullish divergence reinforce the upward trend. These technical signals attract momentum traders and institutional players, which accelerate the price increase. Consistent bullish technicals contribute to a self-sustaining upward trajectory toward the $4,500 target.
7. Supply Dynamics
Ethereum's supply mechanics significantly influence its price. The implementation of EIP-1559 introduced a fee-burning mechanism that reduces circulating supply over time, creating a deflationary pressure. When network activity is high, more ETH is burned, decreasing supply and potentially increasing scarcity. Furthermore, the transition to Ethereum 2.0's proof-of-stake reduces issuance, limiting new ETH supply entering the market. These supply-side dynamics, combined with growing demand, can lead to significant appreciation, moving ETH toward and beyond the $4,500 level.

$BTC x $GOLDCRYPTOCAP:BTC , the largest store of value after TVC:GOLD and NASDAQ:XAG , historically follows TVC:GOLD movements!
2025 looks set to be epic for #Bitcoin

SOLANA $250 INCOMING? or $150 again?We can see a wedge is forming, price is at a major point, break above with a failed break below the resistance - we see high potential for $250.
Failed breakthroughs and a rejection? We see $150 once more.
Thoughts?

BTCUSDT 1D – Retesting Key Support, Will Bulls Hold the Line?Bitcoin is retesting a crucial structural support level around $112K after its recent local top near $120K. This zone previously acted as resistance and is now being tested as support — a textbook bullish continuation signal if it holds.
Historically, these flips (from resistance to support) have triggered strong upside momentum, as seen after the $78K breakout earlier this cycle. However, failure to hold this level could open the door for a deeper correction toward $100K or even the $90K region.
This chart outlines the major structural zones:
Long-term accumulation base near $70–78K
Resistance flip zone at $110–112K
Local resistance near $120K
📌 If bulls defend this zone and reclaim momentum, we could see another push toward cycle highs. If not, patience is key — the next high-conviction entry may come lower.
How are you positioning around this zone? Let me know in the comments 👇

$BTC DO NOT BE REKT!bitcoin can create an accumulation process in the mini timeframe after the major rally, which will serve as fuel before another parabolic run

Bitcoin: New All-Time High — What’s Next?Bitcoin had an incredible run, breaking the old all-time high ($111,980) with strong bullish momentum and setting a fresh ATH at $123,218 (Binance). We just witnessed the first major corrective move of ~6% and a decent bounce so far — but the big question is:
What’s next? Will Bitcoin break higher over the summer or form a trading range here?
Let’s dive into the technicals.
🧩 Higher Timeframe Structure
May–June Range:
BTC was stuck between $110K–$100K, forming an ABC corrective pattern. Using trend-based Fib extension (TBFE) from A–B–C:
✅ C wave completed at $98,922 (1.0 TBFE)
✅ Upside target hit at $122,137 (-1 TBFE)
Full Bull Market TBFE:
➡️ 1.0 → $107,301 → previously rejected
➡️ 1.272 → $123,158 → recent rejection zone
Pitchfork (log scale):
➡️ Tapped the upper resistance edge before rejecting.
Previous Bear Market Fib Extension:
➡️ 2.0 extension at $122,524 hit.
2018–2022 Cycle TBFE:
➡️ 1.618 at $122,011 tapped.
Macro Fibonacci Channel:
➡️ Connecting 2018 low ($3,782), 2021 ATH ($69K), 2022 low ($15,476) →
1.618–1.666 resistance band: $121K–$123.5K.
✅ Conclusion: Multiple fib confluences mark the $122K–$123K zone as critical resistance.
Daily Timeframe
➡️ FVG / Imbalance:
Big daily Fair Value Gap between the prior ATH and $115,222 swing low.
BTC broke the prior ATH (pATH) without retest → a pullback to this zone is likely.
Lower Timeframe / Short-Term Outlook
We likely saw a completed 5-wave impulse up → now correcting.
The -6% move was probably wave A, current bounce = wave B, next leg = wave C.
➡ Wave B short zone: $120K–$121K
➡ Wave C target (1.0 TBFE projection): ~$113,326
➡ Confluence at mid-FVG + nPOC
Trade Setups
🔴 Short Setup:
Entry: $120,300–$121,000
Stop: Above current ATH (~$123,300)
Target: $113,500
R:R ≈ 1:2.3
🟢 Long Setup:
Entry: Between Prior ATH and $113,000
Stop: Below anchored VWAP (~$110,500)
Target: Higher, depending on bounce confirmation.
🧠 Educational Insight: Why Fibs Matter at Market Extremes
When markets push into new all-time highs, most classic support/resistance levels disappear — there’s simply no historical price action to lean on. That’s where Fibonacci extensions, channels, and projections become powerful tools.
Here’s why:
➡ Fibonacci extensions (like the 1.272, 1.618, 2.0) help estimate where trend exhaustion or profit-taking zones may appear. They are based on the psychology of crowd behavior, as traders anchor expectations to proportional moves from previous swings.
➡ Trend-Based Fib Extensions (TBFE) project potential reversal or continuation zones using not just price levels, but also the symmetry of prior wave moves.
➡ Fibonacci channels align trend angles across multiple market cycles, giving macro context — like how the 2018 low, 2021 ATH, and 2022 low project the current 1.618–1.666 resistance zone.
In short:
When you don’t have left-hand price history, you lean on right-hand geometry.
That’s why the $122K–123K zone wasn’t just random — it’s a convergence of multiple fib levels, cycle projections, and technical structures across timeframes.
⚡ Final Thoughts
Bitcoin faces major resistance around $122K–$123K backed by multiple fib and structural levels. A retest of the prior ATH zone (~$112K–$113K) looks probable before the next big directional move. Watch lower timeframe structure for signs of completion in this corrective phase.
_________________________________
💬 If you found this helpful, drop a like and comment!
Want breakdowns of other charts? Leave your requests below.

BITCOIN 2025 TOP PREDICTION!This chart represents the M2 Money Supply / BTCUSD correlation with an 84-day delay.
You can see that the M2 Money Supply has formed a double top (with a lower high) in late September.
The price of bitcoin tops out 525–532 days after the halving in every cycle.
What does this mean?
In my opinion, bitcoin will continue to follow the direction of M2 in a highly correlated manner. This would mean that BTC's top is only 2 months away.
What price will bitcoin top?
That I'm not entirely sure of yet. The M2 / BTC correlation can be placed in a plethora of different scales. However, it currently looks like the top will be BELOW $200,000.
I hope to be proven wrong, but as of right now, bitcoin is following previous cycles perfectly (excluding the fact that we created a new ATH prior the halving, this was because of ETFs).
Given diminishing returns (and assuming that "supercycle" is not reached), $135,000 - $190,000 top in late September makes sense.

BITCOIN PREDICTION: NOBODY IS WATCHING THIS PATTERN !!!(warning)Yello Paradisers, I'm updating you about the current Bitcoin situation, which is extremely dangerous for crypto noobs that will get rekt again very soon!
It's going to be a big move soon. I'm telling you on a high timeframe chart we are doing multi-time frame analysis and on a high timeframe chart I'm updating you about the RSI indicator, the bearish divergence, the moving average reclaim, and the channel reclaim that we are having right now.
We are observing a shooting star candlestick pattern, which is a reversal sign, and I'm telling you what confirmations I'm waiting for to make sure that I can say with the highest probability that we are going to the downside. On a medium timeframe, I'm showing you two patterns: one is a head and shoulders pattern, then a contracting triangle, and on a low time frame, I'm sharing with you the ending diagonal because on a high time frame chart, we are either creating ABC or impulse, and I'm telling you what the probabilities are for the zigzag, which is a corrective mode wave, or the impulse, which is a motive mode wave.
I'm sharing with you what's going to happen next with the highest probability. Please make sure that you are trading with a proper trading strategy and tactics, and that's the only way you can be long-term profitable.
Don't be a gambler. Don't try to get rich quick. Make sure that your trading is professionally based on proper strategies and trade tactics.
