Downside protected, upside unprotected — BTC to 500kThere's a ton of intriguing action unfolding with Bitcoin right now. Several cycle low indicators I track have started firing off around the $80K mark—pretty wild if you ask me. Let's break them down step by step.
1. 2-Week RSI Signal
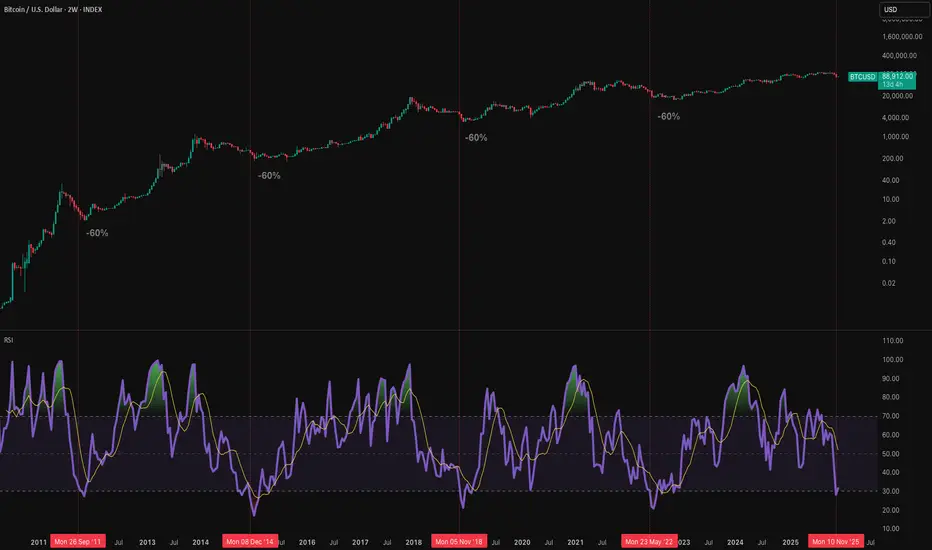
It's a straightforward fact: the two-week RSI is sitting at 42, a level that has consistently marked cycle lows in the past. So, at $80K, we've got our first major cycle low signal.
2. Fear & Greed Index
Historically, after a cycle top, the first wave down has driven the Fear & Greed Index to a reading of 10 in the last two cycles.
The rest of the time? It's signalled cycle lows or major bottoms ahead of massive rallies.
#### What This Means: History Rhyming (Again)
This setup screams repetition—Bitcoin has now topped out after exactly 1,064 days, mirroring the last two cycles. On this first corrective wave, Fear & Greed has already plunged to 10. But here's where it gets really telling: layer in the Sharpe ratio for some nuance.
As the chart shows, the Sharpe ratio has dipped into negative territory—a rare event that *only* occurs during true cycle lows.
Invalidation & Bear Market Confirmation
The chart makes it crystal clear: Bitcoin is primed to echo the last cycle's playbook, with a full rejection at the 0.382 Fibonacci retracement. In the prior two cycles, after the initial drop from the cycle high, any subsequent rally completely fizzled out right there at 0.382.
If Bitcoin fails to rally and close decisively above that level by mid-January 2026, the odds skyrocket for a full-blown bear market. Keep an eye on it—this could be the pivot that defines the next leg.
What do you think then?
500k or 67k by October 2026?
Still fully on the upside boat. Risk is heavily skewed to the top side, not down
Btc-bitcoin

SOL to Bottom Out Around $103-104SOLANA – Eyes on the Final Flush? 🔥 Key Confluence at $103–$104
Solana is approaching what might be the most important support zone of this entire macro structure. Several major technical factors are all pointing to the same potential bottom area:
🟢 1. Head & Shoulders Breakdown Target
The measured move from the H&S pattern puts the projected downside right into the $103–$104 zone, creating a textbook target alignment.
🟠 2. Long-Term Trendline Support (Orange)
Price is now dropping toward a multi-year rising trendline that has held since early 2024.
This line has acted as major dynamic support across multiple cycles, and SOL is now coming back to retest it.
🟣 3. Fibonacci 0.886 Retracement
The 0.886 retrace of the full macro move lands perfectly in the same area.
This fib level is often where deep retracements reverse during strong bullish expansions.
📉 Current Structure
– Breakdown from right shoulder confirmed
– Momentum still down, but seller exhaustion showing up
– Volume declining on the drop → typical late-stage correction behavior
📌 Key Zone to Watch
$103–$104 (Green Box)
This is my “high-probability reaction zone” where I expect Solana to bottom or at least produce a significant bounce.

My Bitcoin plan for next 1 - 2 weeks My Bitcoin plan for next 1 - 2 weeks
I think we are in a bear trend. but it doesnt mean u must take trades in a vad place.
Alwasy better to take trade after a trap into opposite direction
Best sell zone 95 - 100k
with a target 73k

BTC Cup and Handle Still Not CompleteAs you can see the SPX broke out of the cup and handle and completed the measured move. It then corrected back down to the top of the handle and resumed its uptrend. This is what is coming for Bitcoin. Bitcoin has only half way completed the cup and handle. Measured move to around 300k before correcting back down to 70k and then back off to the races. Hold onto your hats. That would be the most epic move of all time a straight shot from here to 300k no pullback then slam back down to 70k and then back up to 500k. Could happen fast dont underestimate Bitcoin.
Just my opinion not financial advice.

BTCUSDT.P - November 26, 2025Bitcoin is consolidating in a choppy range after early gains, with price repeatedly testing support at 86,547 and resistance around 88,200. A breakout above the upper boundary signals momentum toward the next major resistance at 91,882, while failure to hold current support risks a push to the stop level near 83,866. The current price action reflects indecision, as neither bulls nor bears control trend structure. Technicals suggest trend confirmation will depend on a decisive move away from the 86,547–88,200 range.

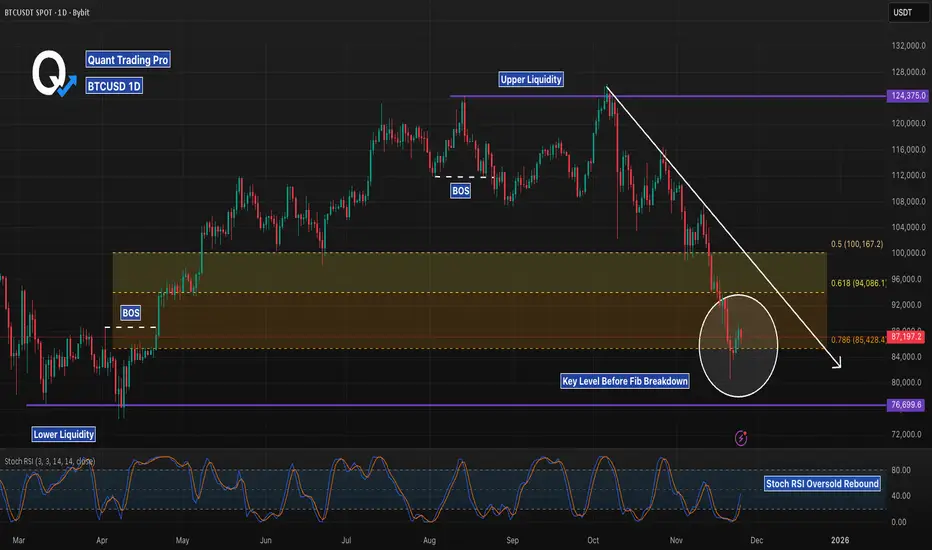
BTCUSD 1D – Testing 0.786 Support, But Is This a Real Reversal?Bitcoin has returned to a major higher-timeframe decision point: the 0.786 Fibonacci retracement, sitting inside a broad demand block that has already produced one sharp wick rejection. This zone combines three powerful confluences — a deep pullback level, prior accumulation structure, and proximity to sweeping lower liquidity from earlier this year.
Price broke structure twice on the way down, showing clear bearish momentum, but the current candle cluster suggests sellers are slowing as demand attempts to step in. A reclaim of the 0.618–0.65 range would signal strength and open the door for a revisit toward the mid-range around 100K. Failure to hold the 0.786, however, exposes the untested liquidity zone near 76.7K — a level that aligns with previous liquidity sweeps.
Stoch RSI is attempting a rebound from oversold territory, hinting at a possible short-term bounce, but trend context remains bearish until a confirmed BOS to the upside forms.
This is a pivotal zone for BTC — the next few daily candles will determine whether this is a macro higher-low or the beginning of a deeper breakdown.
INTERVIEW: Hope phase - EXCAVO’s View 25/11/25
1. Do you believe the bear market has already begun? If yes - from what moment?
Yes. The bear market started in November 2025.
My cyclicality chart shows it clearly: not a single scenario points to continued upside.
Every chart I posted on TradingView confirms the trend reversal.
2. What was the main signal confirming the reversal?
The 153rd week of Bitcoin’s growth — a historic exhaustion point that almost always marks the end of a cycle.
3. What BTC levels are critical for the downside scenario?
The key horizontal level is $74,000.
At minimum, I expect a clean wick below it.
4. What fundamental factors accelerated the bear market?
A massive overbought environment.
The 2-year AI bubble pushed valuations far above fair value.
The market became overheated — even though AI is here to stay.
5. Technical factors confirming the decline?
We’re dropping without any real reason.
Any small headline triggers selling.
October 11 wasn’t about Trump — it was a whale manipulation on big exchanges.
That’s how late-stage cycles behave.
6. Why did most traders fail to see this reversal?
— Short memory
— Conditioned for 3 years to “buy every dip”
— No exit plan
— No clear framework
— And of course: they weren’t following EXCAVO 😉
7. Where could BTC go in the coming weeks?
First: liquidation of short positions.
We may even spike up to $94,000.
But that would be a trap before continuation downward.
In December, I expect the formation of one of the cycle bottoms.
8. Which scenario seems more likely — panic drop or step-by-step bleed?
Most likely: a step-by-step bleed.
9. Is a fake bounce possible before further decline?
Yes. I already mentioned it: a short squeeze → then a big drop.
Practical Part
10. What are you personally doing in this market?
I’m waiting.
Observing.
Studying.
You don’t need to be in a trade every day.
Overtrading destroyed more traders than any correction.
11. What should beginners do now?
Exactly what professionals do: wait for their entry point.
We’re hunters in the bushes — we shoot only when the target is close.
12. What should traders revise in their strategy right now?
— Understand where we are in the macro cycle
— Identify what’s working
— Remove what’s not
— Accept that the bear market will be long and exhausting
Right now we’re in the hope phase.
Disappointment is ahead.
Best regards EXCAVO
If you have any questions, feel free to ask. In the next post, I can do another interview based on the questions you leave under this one.
How to build Discipline & Structured Trading HabitsDiscipline is not something you rely on in the moment; it is something you build through habits that remove emotional decision-making from your trading process.
1. Define Rules Before You Trade
Traders without predefined rules rely on emotion. Traders with rules rely on structure.
Clearly define your entry criteria, risk per trade, maximum daily loss, and exit strategy.
When these rules exist before the session starts, you eliminate most impulsive behaviors.
2. Limit Your Daily Decisions
Every decision drains mental energy. The more choices you make, the weaker your discipline becomes.
Reduce the number of markets you watch, the number of setups you take, and the amount of chart time you expose yourself to.
Fewer decisions lead to higher-quality decisions.
3. Use a Pre-Session Checklist
A checklist forces you into a disciplined routine. It can include:
• Reviewing your trading plan
• Checking upcoming news releases
• Confirming your bias or market conditions
• Ensuring your risk settings are correct
The act of going through the checklist prepares your mind to follow structure.
4. Implement a Hard Stop for the Day
One of the fastest ways to lose discipline is to trade while emotional.
Set a maximum daily drawdown. Once it is hit, the session ends. No exceptions.
This protects both your capital and your psychology.
5. Track Your Rule Breaks
Most traders only track wins and losses. Disciplined traders also track deviations.
Write down every time you break a rule, why it happened, and how you plan to prevent it next time.
Over time, this builds awareness and accountability.
6. Delay Impulsive Actions
If you feel the urge to jump into a trade that does not fit your plan, delay the action by 30 to 60 seconds.
Impulses lose power quickly. By introducing a pause, you give your rational mind time to regain control.
7. Keep Your Environment Clean
Distractions destroy discipline.
Silence notifications, close irrelevant tabs, and avoid multitasking.
A clean trading environment supports clean decisions.
8. End Each Session With a Routine
A consistent end-of-day routine reinforces discipline. Examples:
• Rating your discipline on a scale from 1 to 10
• Reviewing whether you followed your rules
• Logging emotional triggers
Ending the day with structure makes it easier to begin the next one with structure.
Conclusion
Discipline is not built through motivation but through habits that create consistent behavior. A structured trading routine removes uncertainty, minimizes emotional influence, and helps you operate like a professional rather than a reactive participant.
BTCUSDT.P - November 25, 2025Bitcoin is in a corrective phase within a longer-term downtrend, with price recently rejected from the 89,500 resistance area and now trending lower. The chart highlights a short trading range between a defined stop level near 89,500 and a profit level at 85,721, aligning closely to horizontal support and resistance. Current price action and momentum favor sellers, as the market presses toward lower support with weak upward retracement. A break below support could accelerate selling toward the next downside target, while reclaiming resistance might shift bias to a short-term reversal.

Bitcoin 2 Week RSIBitcoinUSD 2 Week stock RSI (14 period close)
The current level has been associated with 50-60% corrections in all of the past cycles
Bitcoin doesn't repeat patterns forever, just until enough people have noticed them
If this pattern does continue, a rapid and large correction could be imminent
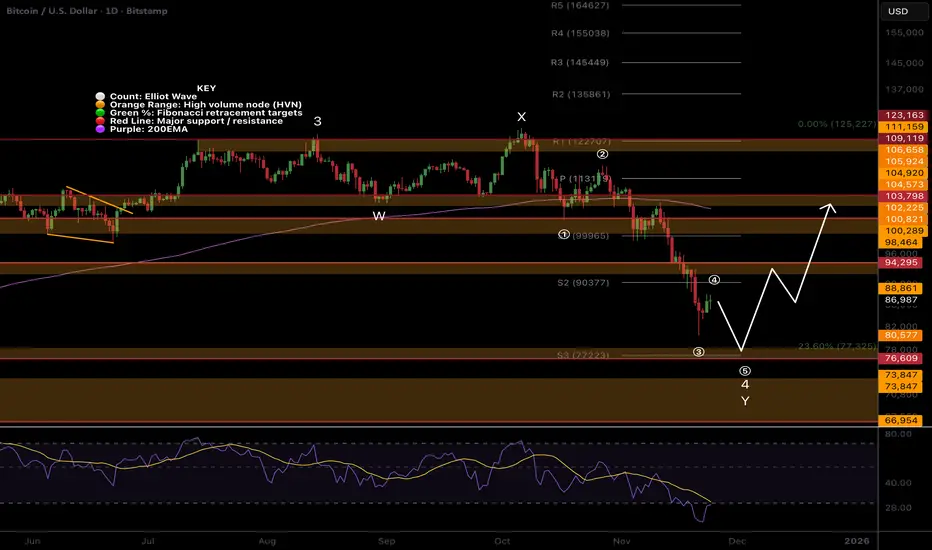
Bitcoin, one more push lower then all time highPrice dropped hard in wave Y of a flat correction, which is expected. Sentiment is at an all-time low for the longest time on record.
This complex correction looks almost complete at the S3 daily pivot, where I bought, but I am giving it room for one more push lower to complete 5 waves down for Y.
Price is well below the daily 200EMA, which will offer some resistance on the way back up. For now, the trend is down, so further downside is the higher probability.
📈 Daily RSI has reached oversold with no divergences. This is where all other ranges bottomed, and the price went on to make new highs.
👉 Continued downside brings up the next High Volume Node at $76000
Safe trading
Bitcoin pump will come soonBitcoin is standing at multiple support areas like the 0.702 Fibonacci, trendline, and weekly 100MA, and a pump is very likely to come soon pushing the price to 110k.

Altcoins Market ETA- So this graphic show only Cryptos and when i speak only Cryptos, it means " No BTC, No ETH, Not Stablecoins ", Only Altcoins !
- This post is not a price prediction, not a FUD, and not a FOMO, it's just my own opinion based on facts.
- Without BTC/ETH and Stables, the crypto market barely reaches $580B MC, a nutshell in the ocean of global finance. Cryptos have already been rejected four times around the $900B MC.
----------------------------------------------------------
- In 2021 we had DeFi.
- In 2022 we had L1/L2 wars.
- In 2023 we had AI.
- In 2024 we had memecoins.
But 2025 has no new narrative.
----------------------------------------------------------
Cycles always go like :
BTC → ETH → Large caps → Mid caps → Micro caps
but this time :
- There's too many new tokens, too many VCs and early insiders droping on retails.
- Altcoins are falling due to a lack of liquidity, no compelling narrative, and absent buyers, while market makers focus on protecting themselves with BTC and stablecoins. ( Dyor on what happened on 10th October 2025 ).
- Right now, most people are holding their breath, waiting for the Fed to launch the next round of QE and another rate cut.
- Money makes Money, the world is working like that.
- My advice for now: be patient. If you already hold crypto and believe in your projects, just HODL. If you’re new to crypto, stay on the sidelines and wait until the market surpasses $1 trillion.
- Comments are welcome but stay sharp and thoughtful.
Be Safe!
Happy Tr4Ding !

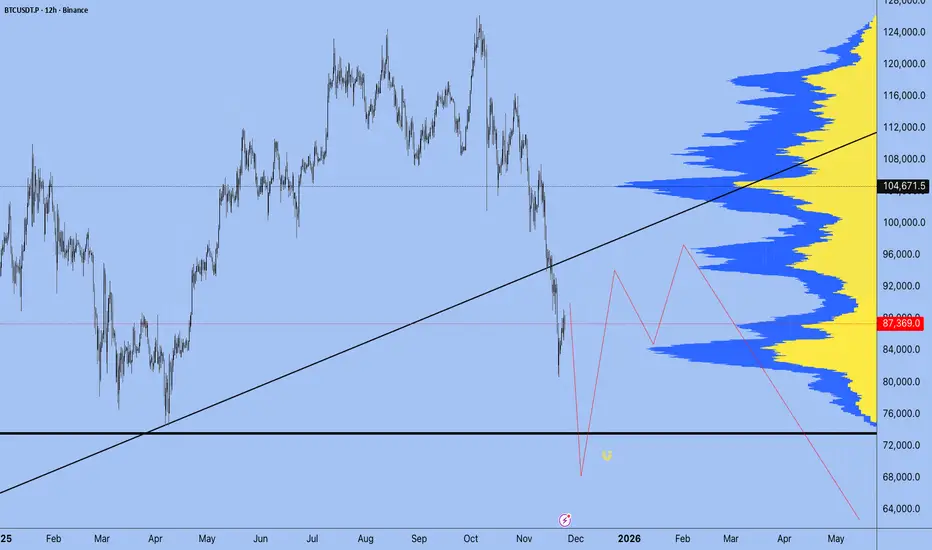
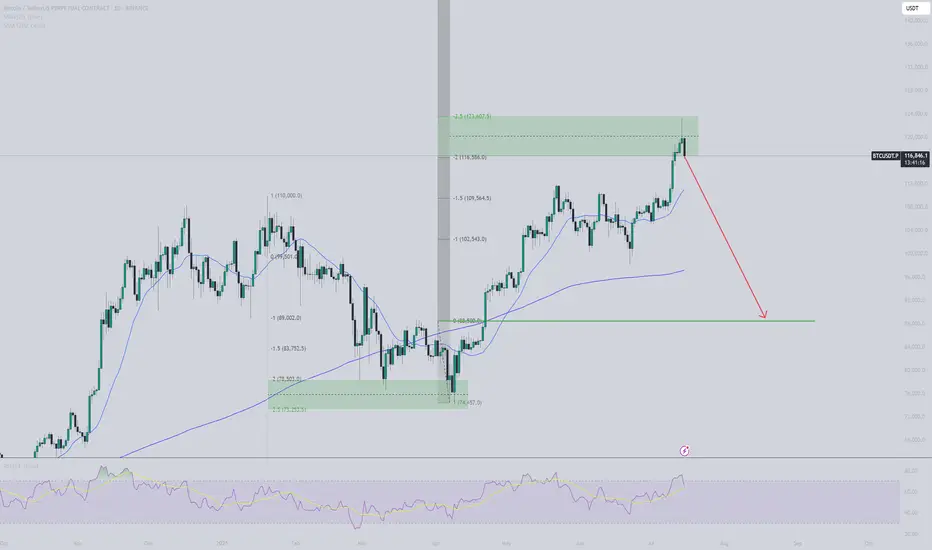
BTC retracement comingBTC seems to follow the 2-2,5 stdv price structure. Based on simply stdv from last manipulation leg down it suggests we are now at reversal zone, and I expect price to retrace down. First reaction seems to support this plan. Aiming at $88,5K.
BTCUSDT.P - November 24, 2025Bitcoin recently formed a short-term ascending channel, showing improving momentum after a strong prior selloff. Price is currently consolidating near 86,900, with key support at 85,900 and 84,400, and resistance at 88,100 and 91,900. A breakout above 88,100 would signal additional bullish momentum toward 91,900, while any failure to hold above the rising trendline could trigger a retest of lower support levels. The current structure suggests neutral to slightly bullish momentum in the immediate term.

BTCUSD Liquidity Sweep Setup Before Bearish ContinuationBTCUSD Liquidity Sweep Setup Before Bearish Continuation
Overview
BTCUSD continues to display persistent downside pressure across the mid-term structure. Price action on the 3H timeframe shows a sequence of lower highs and lower lows, reflecting sustained bearish control. Despite short periods of stabilization, the overall market environment remains distribution-driven.
Market Structure
Recent price behavior confirms multiple break-of-structure (BOS) events, each reinforcing the broader downward momentum. Every attempt at upward expansion has been met with supply absorption, indicating that buyers are failing to regain initiative. The consolidation developing in the current region suggests an accumulation of short-term liquidity, but without structural evidence of reversal.
Supply & Liquidity Context
Price is positioned directly beneath a key supply zone highlighted on the chart. This zone remains unmitigated and acts as the primary area where counter-trend reactions are likely to be absorbed. The tightening range beneath this level indicates liquidity buildup, commonly preceding engineered sweeps by institutional players.
The current model suggests that the market may execute a short-term liquidity run above local highs before resuming its downward trajectory. Such a move would align with previous behavior in this trend cycle, where short-term rallies were primarily used to deliver liquidity into higher-timeframe supply.
Downside Expansion Risk
Should the market complete a liquidity sweep into the supply zone, the next phase of downside continuation becomes probable. The structural projection on the chart anticipates a revisiting of the lower demand region around 74,300 – 75,000, an area aligning with previous inefficiencies and untested demand.
This target supports the continuation of the broader bearish structure unless a significant shift in order flow emerges.
Summary
BTCUSD remains positioned within a well-defined bearish cycle, characterized by repeated structure breaks and unmitigated supply zones controlling price. Current compression suggests the market is preparing for another liquidity-driven move. Unless buyers regain structure above the key supply region, the market retains a high probability of extending toward lower demand zones.

Bitcoin Hits Heavy Support Zone — Is the Next Big Crash Coming?Recently, Bitcoin ( BINANCE:BTCUSDT ) experienced another decline of over -10%, largely due to the sudden drop in the S&P 500( SP:SPX ). As I mentioned in previous ideas, in recent weeks, Bitcoin and the crypto market, especially Bitcoin, have shown a strong correlation with U.S. indices, particularly the S&P 500. This means that even technically sound analyses for Bitcoin can fail if we don’t consider these external factors, which is quite normal. Therefore, it’s crucial to incorporate all parameters—news, fundamentals, on-chain data, and relevant indices—to get an accurate Bitcoin analysis. This complexity can make things a bit challenging.
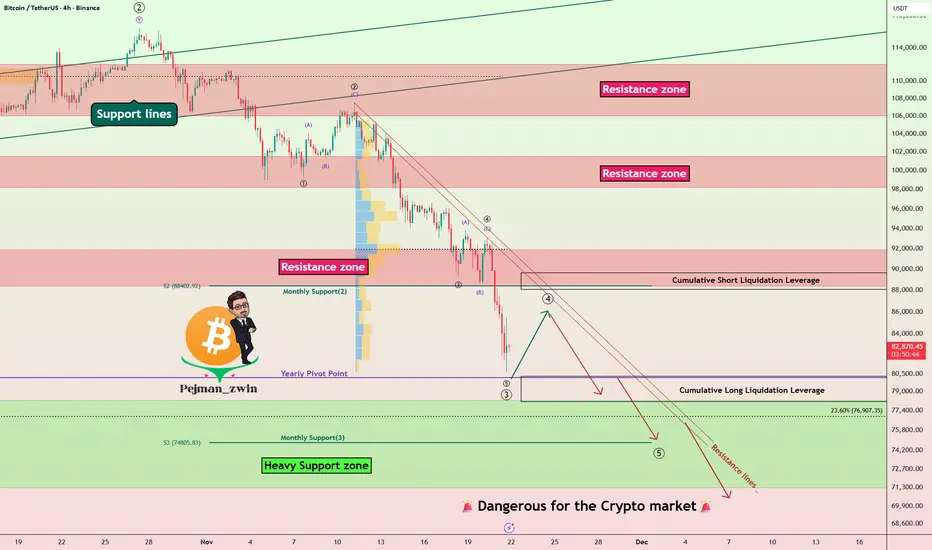
Over the past ten days, Bitcoin has swiftly broken through several support levels. Many factors have contributed to Bitcoin’s decline recently, but it’s now approaching a heavy support zone($78,300-$71,280). This zone is crucial because if Bitcoin loses it, we could see even larger declines, affecting altcoins as well. Altcoins, in general, haven’t matched Bitcoin’s gains in recent months, so a significant drop in Bitcoin could lead to severe losses for them. It’s essential to manage your investments carefully and stay alert.
From an Elliott Wave perspective, the recent decline suggests that Bitcoin might be in the midst of a five-wave downward, which isn’t positive news. There’s a chance that the heavy support zone($78,300-$71,280) might be breached. However, considering that weekends typically have lower trading volumes, it’s less likely that the support will break in the next couple of days. Still, we must remain vigilant and prepared for any scenario.
In terms of Elliott Waves, it seems Bitcoin has completed its main wave 3, and we might be looking at the completion of the wave 4 over the weekend, with another push towards the heavy support zone($78,300-$71,280) at the start of next week.
Also, the USDT.D% ( CRYPTOCAP:USDT.D ) chart looks bullish, which could not be good news for Bitcoin.
I expect that after a brief rebound, Bitcoin will resume its decline and test the heavy support zone($78,300-$71,280) again.
Cumulative Short Liquidation Leverage: $89,642-$88,079
Cumulative Long Liquidation Leverage: $80,263-$78,131
First Target: $78,523
Second Target: $75,123
Stop Loss(SL): $92,123(Worst)
Points may shift as the market evolves
Note: The S&P 500 also might face downward pressure in the coming days, which could further impact Bitcoin’s support levels. It’s essential to manage your investments carefully and wait for strong reversal signals in higher timeframes. You might miss out on some short-term gains, but it will allow for more confident entries later on.
Note: Tensions between the U.S. and Venezuela are escalating day by day. Should these tensions intensify to the point of direct confrontation, it could act as a trigger for another Bitcoin decline. It’s important to keep this in mind.
Note: Additionally, there have been some suspicious transfers involving the Mt. Gox exchange recently. It’s worth monitoring these developments closely.
💡 Please respect each other's opinions and express agreement or disagreement politely.
📌Bitcoin Analysis (BTCUSDT), 4-hour time frame.
🛑 Always set a Stop Loss(SL) for every position you open.
✅ This is just my idea; I’d love to see your thoughts too!
🔥 If you find it helpful, please BOOST this post and share it with your friends.
BTC or Gold?Answer Gold!
The BTC/Gold ratio is on the verge of cracking here.
A crack here will trigger a sell-off in BTC relative to Gold.
This is a very simple, low risk, ratio trade.

BTCUSDT.P - November 23, 2025Bitcoin remains in a pronounced daily downtrend with persistent lower highs and lower lows, reflecting strong bearish momentum. The price is now targeting major support zones near 78,250 and 60,300. There is currently no indication of reversal; a sustained move above support would be necessary to suggest any bullish recovery. Until then, momentum and trend bias remain decisively bearish.

Saylor’s Master Plan at Risk? MSCI Drops the HammerMSCI May Exclude Crypto-Heavy Companies: What It Means for MicroStrategy and the Market
MSCI recently published a proposal that could dramatically reshape how global indices treat companies with large crypto exposure.
According to the framework, companies holding more than 50% of their market capitalization in digital assets may be excluded from national and international indices.
This sounds technical - but the consequences are huge.
What This Means in Practice
If the rule is implemented, companies like MicroStrategy, Bitfarms, Marathon, Hut8, Coinbase, or any firm holding a large percentage of crypto on their balance sheet, may:
be excluded from major indices,
lose exposure to institutional investors,
be off-limits for pension funds, insurers and conservative hedge funds,
face reduced liquidity and forced selling.
This is not a small development.
This is a structural shift.
🧩 Why MicroStrategy Is the Most Exposed
MicroStrategy’s business model has been extremely straightforward:
issue new shares
raise debt (including convertible notes)
use the proceeds to buy Bitcoin
rising BTC → rising MSTR
rising MSTR → more borrowing capacity
A perpetual loop.
But if MSTR gets excluded from key indices, the loop breaks:
passive funds must sell
institutional investors face compliance risk
liquidity dries up
volatility increases
borrowing costs rise
And remember:
MicroStrategy currently trades below the fair value of its Bitcoin holdings.
A forced outflow amplifies the structural imbalance.
⚠️ Why Institutions Bought MicroStrategy Instead of Bitcoin
Many funds legally cannot buy Bitcoin.
They also cannot buy high-risk crypto exchange stocks like Coinbase.
But they can buy:
reputable corporate debt
convertible notes
equity from a listed U.S. corporation
Michael Saylor gave them a regulatory loophole:
“Want Bitcoin exposure? Buy my convertible debt.
If BTC rises, convert the notes into shares.”
This workaround is now cracking.
Convertible Debt Holders Are in a Tough Spot
If MSTR is excluded from indices:
index funds sell → share price drops
falling price → convertible notes lose value
institutions holding the debt face losses
the balance sheet risk increases
This is why regulatory decisions matter so much.
Insider Selling: VP of Bitcoin at MicroStrategy Sells ~$19.7M Worth of Stock
The timing is… interesting.
Started selling on September 18
Sold options-based shares in multiple lots
Continued selling until November 14
Total realized profit: ~$19.69M
Selling into regulatory uncertainty is not random behavior.
It’s a signal.
Key Takeaways
1. MSCI’s proposal changes the rules:
companies with >50% crypto exposure may become “non-indexable”.
2. MicroStrategy’s core model—borrowing to buy BTC—depends on institutional inflows.
Index exclusion disrupts it.
3. Convertible note investors may face severe pressure.
4. Insider selling suggests internal awareness of structural risk.
5. If MSTR is removed from indices, forced selling could create significant downside pressure.
📉 Conclusion
MicroStrategy has long been a “Bitcoin ETF before ETFs existed”.
Institutions bought MSTR because they couldn’t buy BTC directly.
But now:
Bitcoin ETFs exist,
regulations are tightening,
index providers are updating risk frameworks.
MicroStrategy may become a victim of its own success strategy.
Best regards EXCAVO

A new look at previous logarithmic channelWith the trendlines of this channel slightly shifted we can see that it is possible that priceaction has already tested the top trendline of the channel. However in my previous version of this idea which I will try to post below it hasn’t connected with the top trendline yet. Would make more sense for it to be having the rejection it is having if it has already retested this top trendline though so I decided to post this version of the chart too so I can keep an eye on both. Even if somehow this does signal some sort of top it looks like we have very strong support on the next trendline just below the current one which should have the monthly 50ma double reinforcing its support in the very near future. SOo in that case that 50k zone there should hold strong support,but hopefully this is So another correction and not the top in which case the current trendline we have just retested will hold support. *not financial advice*
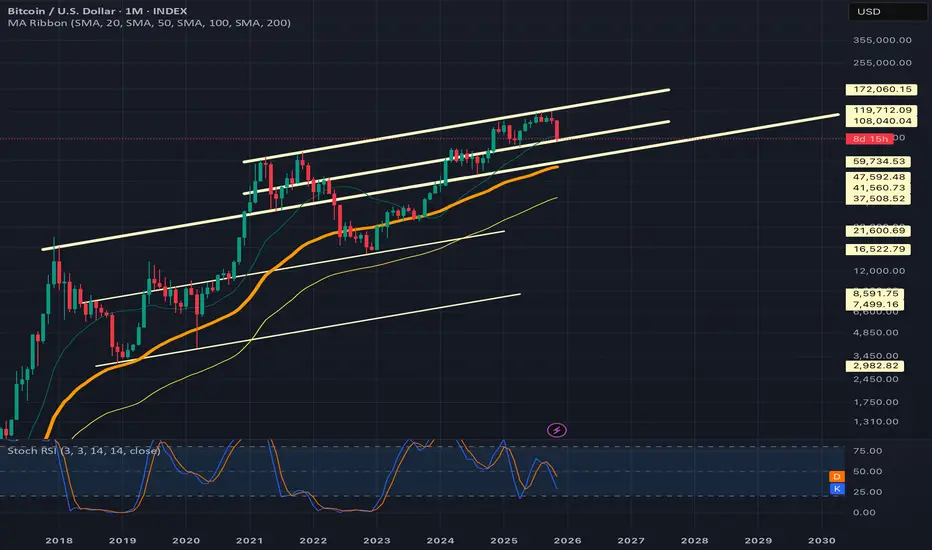
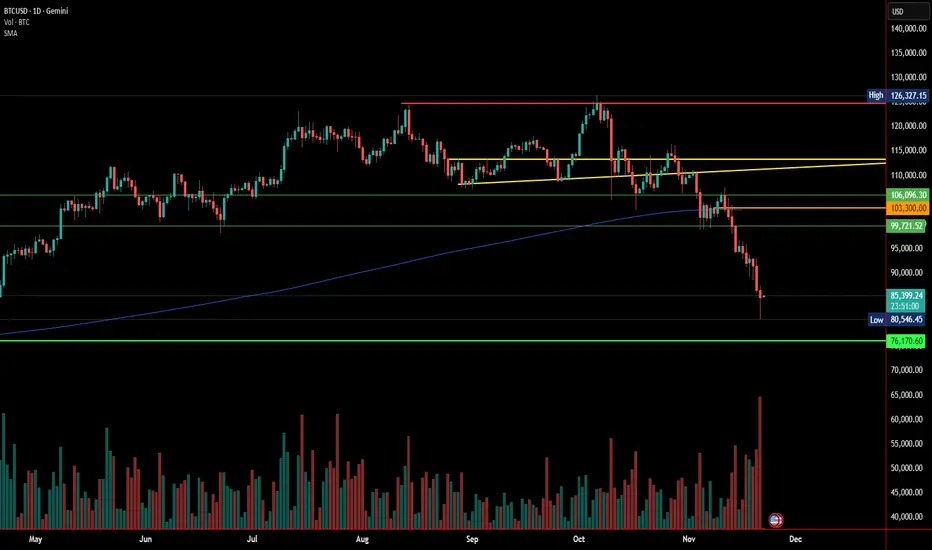
Bitcoin Breakdown: Macro Trend Under PressureBitcoin’s climb to 126,327.15 now reads like the last breath of a fading trend. That high wasn’t just a price point it was the last surge of bullish confidence before the chart quietly and consistently began breaking down.
Lower highs formed, momentum weakened, and what looked like healthy consolidation slowly revealed itself as exhaustion. The rising triangle that once hinted at continuation eventually failed. Buyers couldn’t break the ceiling, sellers kept pressing the floor, and the entire formation finally snapped.
When Bitcoin fell out of that triangle, it didn’t stumble it collapsed. The real damage came when price cut straight through the 50-week SMA , the line that separates long-term strength from long-term weakness. This weekly moving average has defined every Bitcoin cycle since Bitcoin’s inception. Staying above it signals a healthy macro trend; falling below it signals a corrective phase.
The break this time wasn’t subtle. A heavy red candle with the largest sell volume on the chart sliced through the 50-week SMA. That’s what capitulation looks like.
Currently, Bitcoin sits below the 50-week SMA . For BTC to turn bullish again, it must reclaim that line no exceptions, no shortcuts. Anyone talking about $200,000 Bitcoin should note that until BTC gets back above $ 103,300 , the macro bullish thesis is paused.
Michael Saylor has been a prominent figure in the Bitcoin narrative, often associated with large-scale accumulation through corporate channels. As the market adjusts, we may soon see Bitcoin’s price reflect its true, organic strength or weakness, independent of corporate sentiment.
Nothing has changed since my last view. My targets remain:
$89,000 – initial support, now under pressure
$83,000 – major demand zone
$76,000 – deeper correction territory
$58,000 – full cycle flush if panic accelerates
Until Bitcoin reclaims the 50-week SMA and rises above 103,300 , the macro trend remains tilted downward. The market is approaching a moment where Bitcoin stands fully on its own without corporate lifelines or narrative amplification.
Form my last post, my views still stand for price TR.
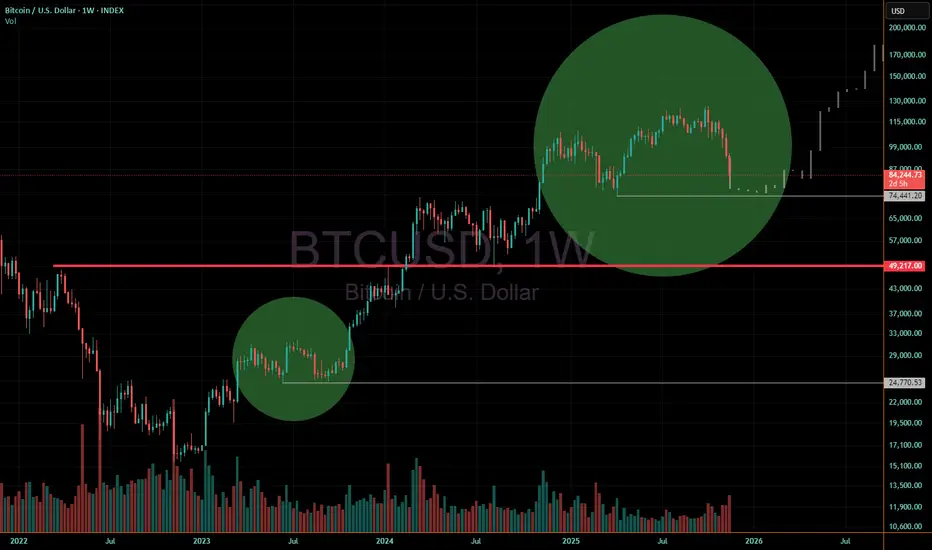
Previous pattern repeating?Possible repeating pattern in Bitcoin here.
If so, a possible stop near the upper white line as it did previously with a very slightly higher 2nd low, then start moving up slowly after finding its lows, and finally spike up and find a new high.
Must not lose the thick red line around 49k if we make a lower low.
Volume needs to come back in and start flipping green vs the present rising red volume being seen on weekly chart now.
This could take upwards of 6 months or longer to play out.