BRAVE NEW COIN TOP (EXPERIMENTAL)BNC:BLX
It's important to note that cryptocurrency markets are highly volatile, and such forecasts are speculative. Investors should conduct thorough research and consider their risk tolerance before making investment decisions.
Btc-bitcoin

BTCUSDT.P - November 6, 2025BTCUSDT is currently consolidating above a rising trendline, with potential breakout zones at $104,496 for a bullish move targeting $106,659, or below $102,684 for a bearish continuation toward $101,164. The setup suggests a breakout-driven trade depending on which level is breached first.

BTCUSDTP. - November 18, 2025Price is pulling back toward a clear support zone around 93,000, with a deeper support level near 92,000, while the nearest resistance sits around 96,200 along a descending trendline. The chart suggests a possible bounce from support toward resistance, but a break below 93,000 could open the way toward 92,000.
If trading this setup, the long scenario is higher-risk, as price is currently trending downward into support and could continue lower before reversing.

BTC Daily View 17.11Hey friends! How’s your trading week starting off?
In my last Bitcoin post, I shifted my invalidation zone from 96,600 to 95,545 and said that if 95,545 breaks, then 96,600 won’t hold either.
Well… it broke — so I revisited the chart.
Now I think the correction after the drop should be bigger than I first expected.
For now, I’m looking at a move up toward 98,400, and then a possible continuation of the downtrend.
I still see two paths — along the orange and purple arrows.
❌ Invalidation zone: 94,850
⚠️ Not financial advice — just sharing my view.
Trade your own plan, always use stops.
⭐ Follow for updates
💬 Drop a reaction in the comments!

$BTC Halfway to Confirming Bear Market - BUT There's HOPE!BAD NEWS ⚠️
₿ITCOIN IS HALFWAY THERE TO CONFIRMING A NEW BEAR MARKET.
🚨 This is the first-time that CRYPTOCAP:BTC has closed below the 50WMA since Dec ’21. We all know what happened after that.
🚨 If we get another consecutive Weekly close below the 50WMA, I am confident this is the beginning of the end for the bull market.
If that happens, I will discuss my new exit strategy and POI in another post.
GOOD NEWS 🙌
⚡️ The long-awaited DEATH CROSS on the Daily Chart has occurred, which historically marks the bottom.
⚡️ PA is sitting at VERY strong support on the .618 Fib
⚡️ RSI is LOWER than the Liberation Day madness Feb - April ’25, and the lowest it’s been since July ’22.
NOTE: This is the smallest correction we’ve had all bull market.
TL;DR 📖
✅ This is the absolute best time to buy CRYPTOCAP:BTC
✅ Just make sure to follow the 50WMA invalidation if you do take a position.
Remember, we have the most insanely bullish macro / regulatory backdrop in crypto’s entire existence.
MY THOUGHTS 🤓
🐂 I truly believe this is the biggest fake-out we’ve ever seen. There’s way too many tailwinds on the horizon to let this go to waste.
🐂 Bulls need a $10k Mega-Candle THIS WEEK to reclaim momentum.
🐂 I’m still a MEGA-BULL until my thesis is invalidated.
⛔️ We could get one last flush ~$92k to grab CME Gap liquidity.
🛑 DO NOT USE LEVERAGE EVER AGAIN!!!

BTCUSDT.P - November 17, 2025BTCUSDT is still in a short-term downtrend, but price is holding above the support zone around $94,300–$94,500 while the next major resistance sits near $96,500–$96,600. The chart suggests a potential rebound toward resistance if support continues to hold, but a break below $94,300 would likely send price back toward the lower support near $93,250.
With a stop level around $93,250 and a target near $96,600, the setup offers a favorable reward-to-risk profile, but remains moderate-risk due to the prevailing downtrend.

Crypto & Bitcoin Do or Die!In this video we show you the mother of all trendlines on BTC and why we think it will likely catch a dead cat bounce.
The total crypto market cap is at an inflection point. If this level doesn't hold we have a failed weekly bullish pattern.
A failed bullish pattern of results in extreme downside pressure.
BTC is retracing to a key 618 Fib level from your tariff low selloff so there is some support here.
Its also hitting a monthly chart trendline going back several years.
I like crypto for a long here on a risk to reward basis. If we lose this area keep in mind our next major support is $85k which is another 10K lower.

BTCUSDT.P - November 16, 2025BTCUSDT.P remains in a clear downtrend, with lower highs forming beneath a descending resistance line. Momentum looks weak, and if the current support area fails to hold, the chart suggests a potential continuation toward the lower support zone.

BTCUSDT.P - November 15, 2025Price has been in a clear downtrend, confirmed by a descending trendline that price continues to respect. Recently, momentum has slowed, and price is forming a short-term rebound from the lower trading range.
The market is now approaching the descending trendline, which is the first obstacle. A clean break and close above this trendline would suggest that bearish pressure is weakening.
There is a horizontal resistance zone around $97,000, where price has reacted before. If price manages to break above the trendline and push into this area, there is room for a short-term continuation upward.
If the trendline holds, price may pull back toward the lower range around $94,000–$93,500, where buyers recently stepped in.

$BTC crash. Where is the bottom?Bitcoin is crashing — and while it looks scary, it’s also one of those rare long-entry opportunities you’ll regret missing once the rebound kicks in.
Why is Bitcoin dumping?
1️⃣ A major hedge fund manager shut down his Bitcoin fund.
Historically, this kind of event often precedes bubble corrections, creating panic in the market.
2️⃣ The FED won’t publish inflation or unemployment numbers due to the government shutdown.
With no data, Powell can’t justify a rate cut.
The market is now pricing a “no-cut scenario,” which puts downward pressure on all risk assets — including crypto.
3️⃣ Structural consolidation.
I already posted about this:
- bullish short-term,
- bearish long-term
This is exactly what’s happening.
The macro downtrend should end around Q2 2026, meaning we’ll likely grind down or range until then.
Is this a bear market?
Not really.
Bitcoin probably won’t see an -80% crash ever again.
But a -30% correction? Absolutely possible.
What does the chart say?
The current correction has a support zone at $94–95k.
If that breaks, the next zone is $88k — less likely but still possible.
Between now and Q2 2026, we’ll get several relief bounces.
If you go long without leverage on strong support zones, you can ride these bounces safely.
Where is the opportunity?
Buy the fear, sell the greed — classic strategy.
Altcoins will bounce even harder than BTC:
CRYPTOCAP:PEPE , NYSE:FUN , DeFi coins, memecoins — these always react with double-digit rebounds.
The key idea
👉 The best entries happen when everyone is panic-selling.
👉 The best exits happen when everyone is euphoric.
Stay smart, stay patient.
DYOR.
#Bitcoin #CryptoCrash #BTC #Altcoins #CryptoTrading #CryptoAnalysis #CryptoMarket #CryptoInvesting #BTCPrice #BuyTheDip #MarketUpdate #TradingStrategy #TechnicalAnalysis #Macro #RiskManagement #HODL #CryptoNews

Bitcoin Roadmap => Short-termOver the past few days, Bitcoin ( BINANCE:BTCUSDT ) has been reacting quite sharply to recent news, showing some unexpectedly strong moves. So, first and foremost, it's a good idea to keep risk management in mind and be prepared for various scenarios .
At the moment, Bitcoin is approaching a Support zone($102,000,980-$96,880) , a Potential Reversal Zone (PRZ) , and a Cumulative Long Liquidation Leverage($99,900-$98,188) .
From an Elliott Wave standpoint, it appears that Bitcoin is completing a Zigzag correction(ABC/5-3-5) .
I expect that from this Potential Reversal Zone (PRZ) and the Cumulative Long Liquidation Leverage($99,900-$98,188) , Bitcoin might start rising again and could potentially reach around $105,171(First Target) .
Second Target: $107,291
Stop Loss(SL): $98,797
Cumulative Short Liquidation Leverage: $108,582-$106,850
Cumulative Short Liquidation Leverage: $112,590-$111,459
Please respect each other's ideas and express them politely if you agree or disagree.
Bitcoin Analysis (BTCUSDT), 1-hour time frame.
Be sure to follow the updated ideas.
Do not forget to put a Stop loss for your positions (For every position you want to open).
Please follow your strategy and updates; this is just my Idea, and I will gladly see your ideas in this post.
Please do not forget the ✅' like '✅ button 🙏😊 & Share it with your friends; thanks, and Trade safe.

Bitcoin topped versus Gold 11 months ago.On the bright side the cyclical bear market of #BTC vs #GC is actually closer to the end, rather than just starting.
Bitcoin has already lost tremendous value vs the Analog SOV
With previous cyclical Bears lasting maximum 14 months.
Which by that time I believe one if not both of these targets will be met.
The troubling aspect is.
If BTC achieves target 2 --- then once could argue a Double top has formed.
And any subsequent bounce/recovery rally should be treated with suspicion.
And furthers declines and retest of this target 2, could open up the trapdoor for a SECULAR Bear market taking us into 2027 before any meaningful recovery can begin.
This is a merely observation of what has happened and what is currently unfolding with early (pre-coinbase launching) BTC investors unloading supply most of 2025 into their perceived six figure objective.
$100K was always the dream!
Will they buy back next bear?
I suspect only if it becomes cheap enough.
What is cheap for an OG?

Bitcoin - is at cross road Bitcoin - is at cross road
price is at Key reistance pVAL which is a powerful area for a short but we need clear bull trap to trade it
that's why my short scenario possible in a cae of bull trap
Bullish plan - long in a case of squeezing up

BTCUSDT.P - November 14, 2025BTCUSDT.P – 15m
Trend:
Price remains in a clear short-term downtrend, confirmed by the descending trendline that continues to act as resistance.
Current Structure:
Price is consolidating just above a nearby support area around 96,800–97,200.
A second, larger support area sits lower at 93,500–94,200, which may be tested if the current support fails.
Key Levels:
Resistance: 99,300–99,800, which aligns with the descending trendline. This is a strong area where sellers have previously reacted.
Support:
Immediate: 96,800–97,200
Major: 93,500–94,200
Scenarios:
Bullish:
A decisive break above the descending trendline combined with a move back above 99,300–99,800 would suggest a potential short-term trend reversal.
Bearish:
Failure to break the trendline and a drop below 96,800–97,200 would increase the likelihood of price moving down toward 93,500–94,200.
Momentum:
Recent candles show indecision and limited follow-through, indicating the market is waiting for a breakout or breakdown at this trendline–support intersection.

BTC Sell/Short Setup (1H)Bitcoin appears to be forming a bearish triangle, which is considered a continuation pattern in this timeframe.
We have identified two potential entry zones for a sell/short position.
We are looking to enter within these two areas.
The invalidation level serves as our stop; if it’s hit, this setup will be invalidated.
Targets are marked on the chart.
For risk management, please don't forget stop loss and capital management
When we reach the first target, save some profit and then change the stop to entry
Comment if you have any questions
Thank You

$BTC VERY Close to Forming a BOTTOMReceiving the end of cycle calls / texts from normie friends - one of my best indicators.
Bullish Divergence on the Daily.
Need some closes above the EMA9 ~$103k to confirm.
Then $107,5 next up.

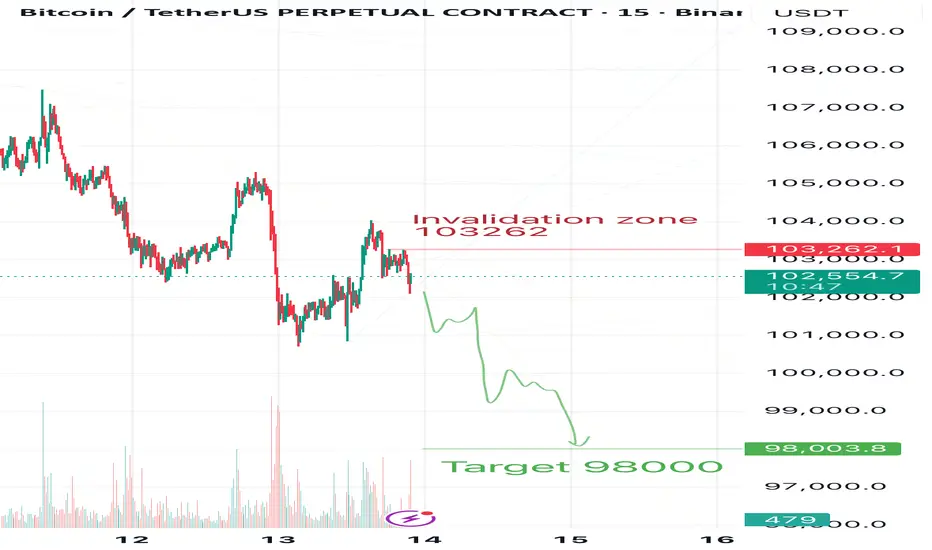
Bitcoin Daily — From 103 to 98k, MaybeI’m no longer waiting for Bitcoin to reach 100K, as I mentioned yesterday.
Now my target is 98K — and in my opinion, all the signs for this move are already in place.
In my previous posts, you can find my global target for Bitcoin at 83K, but that’s not the focus today.
❌The invalidation zone is marked on the chart — 103,262.
🎯Target: 98,000.
⚠️This is not a signal, just my personal view of the market.
Trade based on your own system and always use stop losses.
💬Share your thoughts in the comments, react if you agree, and follow me so you don’t miss my daily Bitcoin updates
$BTC bounce. What is happening?On the Macro Side:
Metaplanet was on the verge of bankruptcy — their stock dropped from $1,900 to $415 in just five months.
Their average Bitcoin buy price sits around $104K, and they had to take on more loans to buy even more BTC, in an attempt to lift the price and save their position.
Michael Saylor and NASDAQ:MSTR are in a similar situation. MicroStrategy’s stock has fallen from $460 to $236, with an average Bitcoin purchase price around $66K.
This puts huge pressure on these institutional treasuries — they cannot afford a bear market.
They’re forced to keep buying Bitcoin to prevent a BTC dominance collapse ( CRYPTOCAP:BTC.D ) and hold market confidence.
In the last two days, altcoins ( CRYPTOCAP:OTHERS ) have been outperforming Bitcoin, signaling a possible rotation from BTC to alts.
That alone was enough for these mega whales to ignite a quick pump before the weekend, trapping retail traders and preventing massive ETF sell pressure from retail-driven redemptions.
On the Chart:
Bitcoin is oversold on both RSI and MACD across multiple timeframes.
This aligns perfectly with the whales’ attempts to spark a rebound — and may support a short-term bounce lasting 5–7 days.
However, don’t be fooled — this looks more like a desperate defense pump than a true trend reversal.
The weekly trend remains bearish until at least Q2 2026, and we’ll likely see more bounces and dips along the way.
A new all-time high seems unlikely in this macro environment, with a maximum target around 108K before another correction.
Stay cautious. Don’t FOMO into this move — it’s engineered to protect treasury positions, not to start a new bull run.
Things will truly turn bullish only when Powell is replaced, QE restarts, or a major macro catalyst (like a government resolution) happens.
DYOR. Stay smart. Don’t chase hype.
#Bitcoin #CryptoMarket #BTC #Altcoins #CryptoNews #CryptoAnalysis #Macro #Whales #MarketUpdate #BTCUSD #AltcoinSeason #Investing #Trading #CryptoTrends #MSTR #Metaplanet #CryptoCrash #CryptoStrategy #DYOR

BTCUSDT.P - November 13, 2025BTCUSDT is currently in a short-term downtrend on the 30-minute chart, trading around $102,450. Price action is consolidating below a descending trendline, with key resistance at $104,825–$105,090 and strong support near $99,896. The structure suggests potential accumulation around the $100K level, with a possible revisit below recent lows before a rebound. A breakout above $103.5K–$104K would likely confirm bullish momentum toward $105K, while a drop below $99,896 could signal further downside. Overall, the short-term outlook is neutral to slightly bullish, contingent on holding support.

In 2026 Bitcoin should trade to the $60k-$80k RegionOn October 23rd, I published an update on Bitcoin titled “Is Bitcoin About to Shed Its 6-Figure Price Tag?” … and that post certainly struck a nerve.
A number of Bitcoin defenders were quick to tell me I was wrong. As it turned out, those same voices had to face the public reality that their conviction was misplaced, and my analysis proved correct in the short term.
To be clear, I remain agnostic when it comes to Bitcoin’s investment merits. My focus is purely on the wave structure, counting 5’s and 3’s nothing more. I cover most tier-1 cryptocurrencies, and while I remain bullish on Bitcoin over the long term, I continue to expect further downside in the intermediate term once a minor B-wave retracement higher completes.
Ultimately, my analysis continues to suggest a bottoming region between $60,000 and $80,000 sometime in 2026, from which Bitcoin can begin a primary-degree rally. Until that region is reached, Bitcoin may be best viewed as a vehicle for shorter-term trades of minor degree, rather than a sustained long-term hold.

BTCUSDT.P - November 13, 2025BTCUSDT.P has formed a consolidation base above $101,600, indicating accumulation and potential for further upside toward the $103,685 partial profit zone and the $105,297 profit level.
A decisive close above $103,700 would confirm bullish momentum continuation, while failure to hold above $100,700 could expose the pair to renewed selling pressure toward $99,200.
Risk Assessment: Moderate — The price structure suggests potential bullish recovery from oversold levels, but the setup remains vulnerable to downside continuation if support near $100,700–$100,000 fails to hold. Traders should consider moving stops to breakeven once the $103,685 level is reached to manage risk effectively.

BITCOIN + BULLISH DIVBitcoin has weekly RSI bullish divergence which with passing 110.5k can push the price to new ATH

Solana Cup w/ HandleFor some reason everyone is bearish on SOL right now.
Breakpoint coming up.
Falling Wedge for the handle.
I'll see you at $400 bears.
