MSTR further downside but looking exhaustedNASDAQ:MSTR Price continues range bound in a complex wave 4 correction, notoriously hard to analyse. The trend is down but looks exhausted.
Wave Y can complete any time in this flat correction pattern but is approaching the previous swing low and the 0.236 Fibonnacci retracement.
Daily RSI has printed bullish divergence but price continues lower. IF pice breaks down further the next target is $185 where price may find a bottom.
Recovering the daily 200EMA is the first goal.
Btc-bitcoin

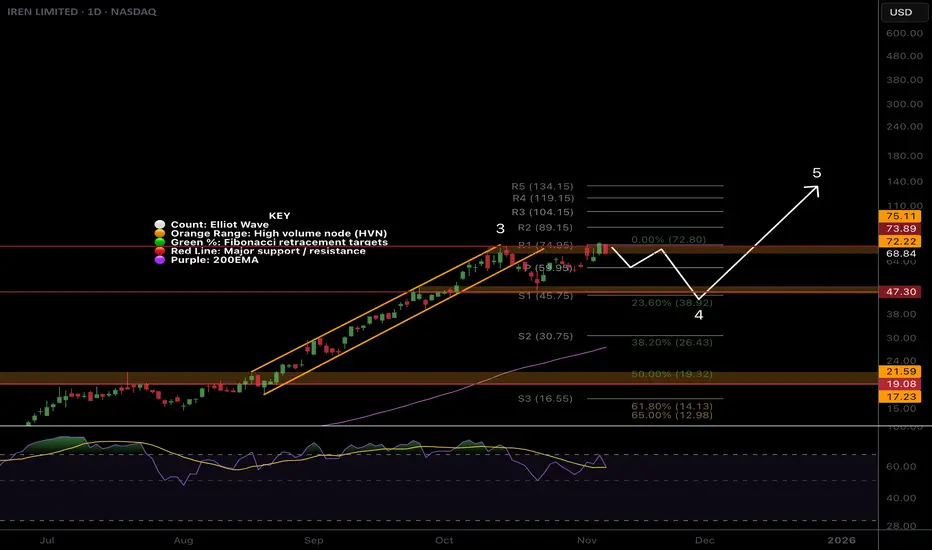
IREN pullback on the cardsNASDAQ:IREN is breaking out again on huge candle spread, though I am skeptical of continued rally from here without a pullback first. For now the trend is up.
Price has broken out of its momentum channel and formed a range so I am expecting the excitement to trap late comers and traders with a swift reversal in wave 4. Initial downside target is $47 at the High Volume Node and .0236 Fibonacci retracemenet. Stronger downside momentum could test the rising daily 200EMA at the 0.382 Fibs.
Daily RSI has printed unconfirmed bullish divergence at the EQ.
Continued upside keeps us looking at the pivot targets.
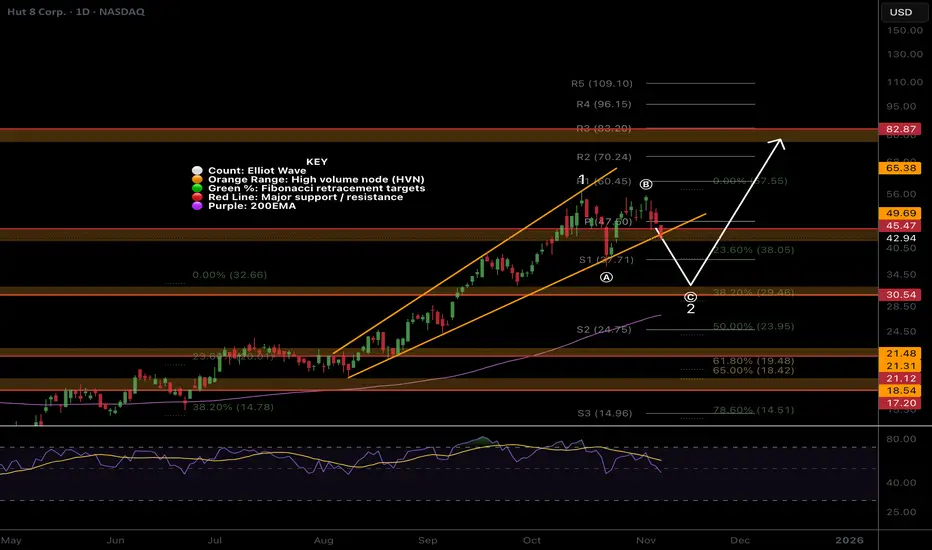
HUT Within channel boundary, all fine locallyNASDAQ:HUT Wave 1 appears complete at the channel upper boundary on bearish divergence.
For now the probability is to the upside and the trend is in tact. However, wave (B) of 2 looks complete. Wave C is expected to be strong and scary, capitulating many. Price is expected to terminate at the 0.382 Fibonacci retracement, High Volume Node support and rising daily 200EMA.
Daily RSI has printed bearish divergence from overbought but also bullish divergence at the EQ. This is ambigous.
Continued upside has a target os the $82 High Volume Node resistance.
Coinbase wave C underway NASDAQ:COIN Price appears to be completing wave C of IV, a corrective pattern to the downside expected to be shallow.
Wave IV are often shallow ending no further than the 0.5 Fibonacci retracement. This is just below the S2 pivot and High Volume Node support. 0.382 is the higher probability target for the end of the downwards move aligning with a swing below the daily 200EMA and S1 pivot.
Daily RSI has room to fall.
Breaking wave B would suggest a new bull move is underway.

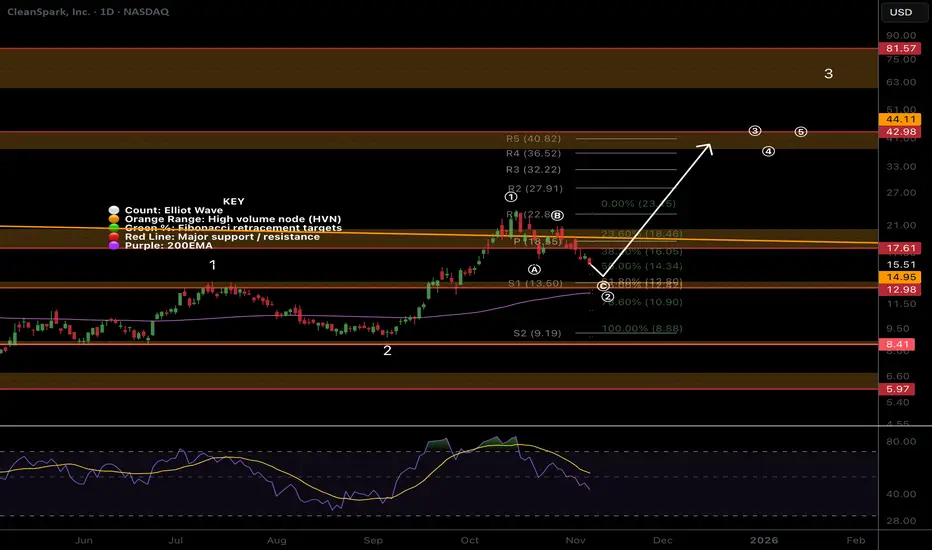
CLSK Local analysis, pullback does not violate larger trendNASDAQ:CLSK Price is pulling after a failed breakout falling back into the macro triangle. Behaviour appears to be a textbook corrective ABC which should end with one more thrust down to the S1 pivot before continuation to the upside.
Wave © can be strong and powerful, often where investors capitulate. The target is the High Volume Node support, rising daily 200EMA, Fibonacci golden pocket and S1 pivot.
Daily RSI has room to fall.
Breaking above wave (B) would suggest the correction is over.
CIFR Pullback time?NASDAQ:CIFR Locally, price continues into price discovery with big jumps suggesting wave 3 is still going Wave (5) of 3 appears to be underway which could end at any moment. I am still expecting a retracement to test the previous all time high and punish late investors who are chasing prices up, trapping them into capitulation later.
Wave 4 has a downside target of the 0.236 Fibonacci retracement, High Volume Node support + the trend-line retest, $14. This may also meet the ascending daily 200EMA.
Daily RSI has a series of bearish divergence from overbought which a strong signal for a reversal.
Continued upside could run the daily pivots to $38.

BTDR Consolidation below support often leads to a breakoutNASDAQ:BTDR Locally, price is struggling at the expected High Volume Node resistance but without a major rejection. Consolidation below resistance often leads to a breakout
Wave (3) characteristics are being followed with shallow pullbacks so far. The target for a stronger downwards move is the golden pocket and S1 pivot at $17 which would meet the rising daily 200EMA, adding confluence to a local bottom. This would be normal and should be expected.
Daily RSI has printed unconfirmed bullish divergence at the EQ.
Continued upside would flip $25 resistance into support.

BITCOIN's PUMPs are Getting LARGER this Bull Market...However, it may take a bit longer to realize those expansionary moves.
If Bitcoin adheres to the established cycle pattern, we can anticipate a minimum surge of 103% that should carry us into the fourth quarter of this year.
Consolidation ----> Fake breakdown ----> then expansion.
Are you ready?

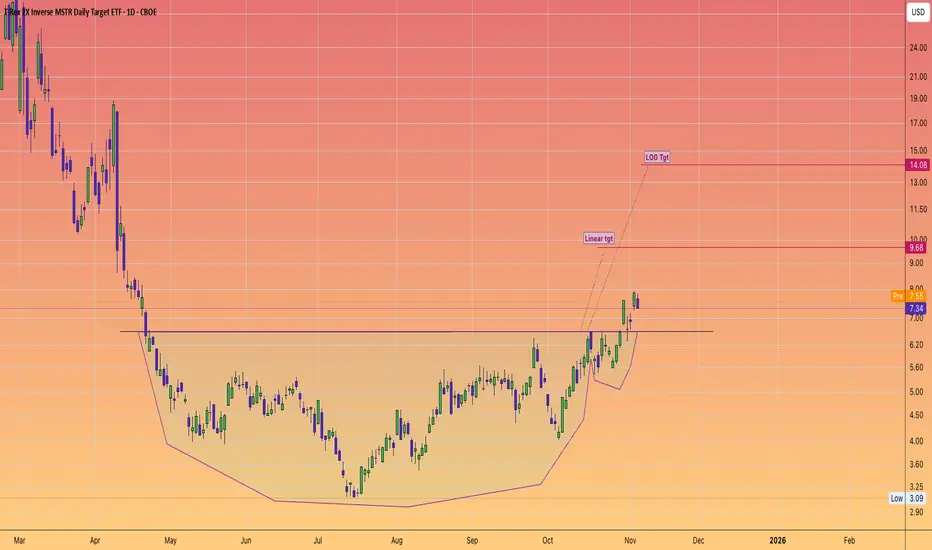
Trade idea: $MSTZ 2X inverse #MSTRThese measured moves are determined from the #cupandhandle pattern.
There is also a inverse head and shoulders pattern within the CUP section, giving further credence that we shall this pattern perform to target.
And thus see further weakness with #Saylor's #Bitcoin investment vehicle.
What goes up must come down.
The current BTC nav sits at $65,827
The premium is leaking out with the mNav at 1.34 likely to test parity
Wider Range or Early Trend Reversal in Multi-Timeframe?👋🏻 Hey everyone! Hope you’re doing great! Welcome to SatoshiFrame channel.
✨ Today we’re diving into the 15-Mimutes Bitcoin analysis. Stay tuned and follow along!
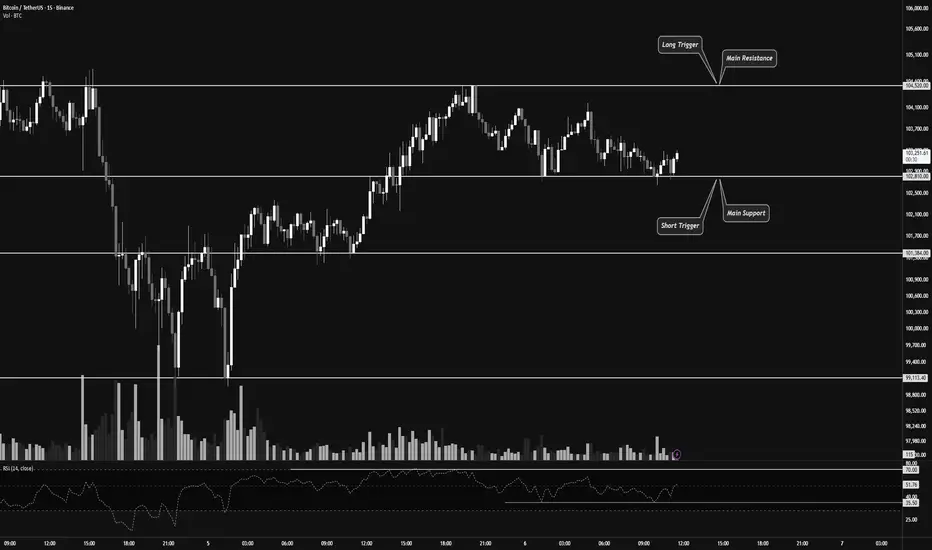
👀 On the 15-minute timeframe of Bitcoin, we can see that after recent declines, BTC has entered a 15-minute trading range. The top and bottom of this range act as our long and short triggers. Keep in mind that Bitcoin’s next move could potentially develop into a long-term directional move.
🧮 Looking at the RSI oscillator, the 70 level serves as confirmation for a long trigger, while the 35.5 level confirms a short trigger. Note that RSI confirmation based on its momentum swings can provide higher-quality trade setups.
🕯 Selling volume has increased slightly as Bitcoin approaches its resistance zone at $104,520, and we’ve seen a similar reaction when price hits resistance from below. This indicates buyer hesitation and stronger seller activity.
Meanwhile, buying volume has risen as price nears the support zone around $102,810. If this buying pressure continues, it could confirm an extended range formation in this area.
✍️ As in previous setups, Bitcoin’s potential scenarios remain straightforward. With proper RSI confirmation, we can look for entry opportunities.
🟢 Long Scenario : A breakout above the $104,520 resistance zone, accompanied by increasing buying volume and RSI exceeding the 70 level on the 15-minute multi-timeframe, could signal a long trade.
🟥 Short Scenario : A breakdown below the $102,810 support zone, with rising selling volume and RSI dropping below the 35.5 level, could trigger a short trade.
❤️ Disclaimer : This analysis is purely based on my personal opinion and I only trade if the stated triggers are activated .
BITCOIN → The hunt for liquidity before the decline BINANCE:BTCUSDT is testing the 100K area and updating its local minimum to 98,900 as part of another liquidation. The market is weak, and bulls are trying to wait out the panic...
Bitcoin looks weak. After a sharp decline, a pullback is forming, during which the price may test the break-even and interest zones — previously broken support areas. Buyers are not yet showing themselves in the market...
There is an intermediate bottom at 98,900, as well as the upper limit of the local range at 105,200. The range of 105,200 - 107,200 - 108,200 is important because it hides a pool of liquidity for a downward movement. MM may reach these zones and bring the price back into the trading range.
Resistance levels: 105,182, 107,271
Support levels: 101130, 98900
A retest of resistance at 105182 and the lack of potential for continued growth may confirm the fact of a false breakout, which in turn may provoke a fall to local targets. I do not rule out the possibility that the price may go even higher, for example, to 107270 - 108200. I do not see any point in waiting for a trend reversal yet...
Best regards, R. Linda!

BTCUDST.P - November 5, 2025BTCUSDT is currently consolidating within a tight range; a scalp setup is identified with a long entry above 101,859 targeting 104,420, and a short entry below 98,888 targeting 97,056, depending on which breakout confirms first.

BTC 1W😎Probabilities of a correction to the 55-period moving average, a technical rebound for bullish continuation, without breaking the weekly uptrend.
♥ Keep in mind that a correction to the 55-period moving average on the weekly chart constitutes a bearish trend on the daily chart.

BTCUSDT.P - November 6, 2025BTCUSDT.P is currently in a tight range; an intramonth setup is identified with a long entry above 105,352 targeting 121,579, and a short entry below 94226 targeting 85100, depending on which breakout confirms first.

BITCOIN SIGNAL: NEXT WAVE IS INCOMING!!! (soon)Yello Paradisers, enjoy the video!
And Paradisers! Keep in mind to trade only with a proper professional trading strategy. Wait for confirmations. Play with tactics. This is the only way you can be long-term profitable.
Remember, don’t trade without confirmations. Wait for them before creating a trade. Be disciplined, patient, and emotionally controlled. Only trade the highest probability setups with the greatest risk to reward ratio. This will ensure that you become a long-term profitable professional trader.
Don't be a gambler. Don't try to get rich quick. Make sure that your trading is professionally based on proper strategies and trade tactics.

Bitcoin – Technical Outlook
🔹 Key Zone: 101,500 – 104,500
At the moment, price is trading within this key zone where strong buying and selling activity is taking place — a critical area that will likely determine the next major move.
🟢 Bullish Scenario (Uptrend)
If price breaks above and holds above 104,500, this would confirm a continuation of bullish momentum.
In that case, price is expected to move higher toward 120,040, with further potential extension toward 125,567.
📈 This zone is an important confirmation area that could signal the beginning of a new bullish leg.
🔴 Bearish Scenario (Downtrend)
However, if price drops below and stabilizes under 101,500, this would indicate a potential bearish reversal.
In that case, the price may move downward toward the support zone at 97,700 – 93,400.
Breaking below this area would confirm further bearish extension toward 88,080.
📊 Summary:
Currently, Bitcoin is trading inside the key zone (101,500–104,500).
A breakout above or below this range will likely define the next strong market direction — whether a bullish continuation or a deeper bearish correction.

BTC 1D Bitcoin is showing signs of a reversal on the 1-day timeframe, as confirmed by the subtrend support and subsequent momentum.

$BTC still above Tenkansen.Since March 2023, Bitcoin has remained above the monthly Tenkansen, showing strong trend momentum.
Currently, Tenkansen continues to act as dynamic support, just like in previous continuation phases.

Bitcoin!!! BIg OI rise! big move is soon!Bitcoin!!! BIg OI rise! big move is soon!
in a video i mentioned previus analysis
which plaeyd out well
what about now?
Big open interest rise with price squeezing down
i think local we are berish
only clear structure break would make me bullish again

Liquidity and Efficiency — It is HOW the market movesI made a video not long ago about lower prices on the crypto market, specifically Bitcoin, which usually determines how the entire crypto market moves for the most part. Lo and behold, we are moving lower. A fortune teller? Nope, I just see things in terms of how the market moves.
How does the market move you ask?
I've said it many times before...
Liquidity and Efficiency. That is all there is to it.
I give a general example in the video, but feel free to check out my other educational videos where I've gone more in depth and offer more examples of how this occurs.
Happy trading!
- R2F Trading

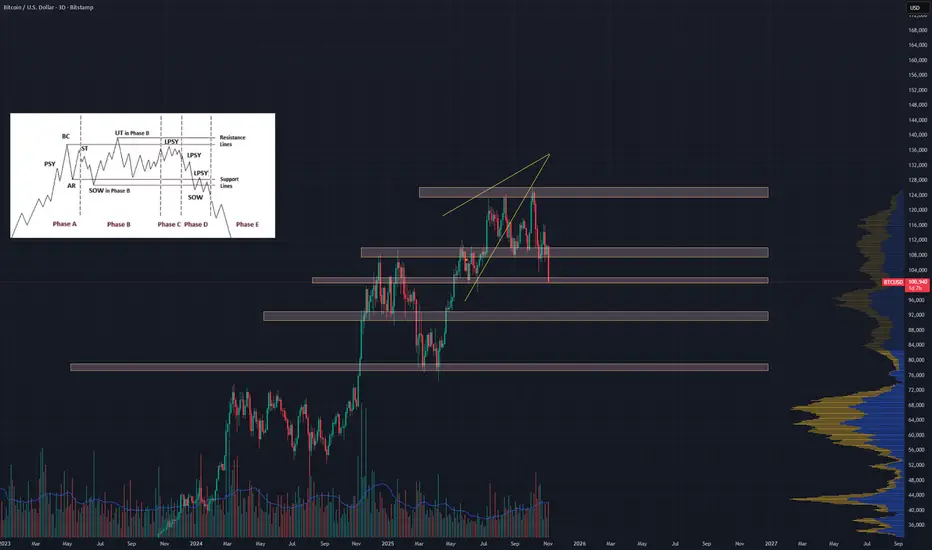
Another BTC Chart but created with PnF chartingThese drawings were made with a One Hour PnF chart for Bitcoin. Wyckoff distribution picture included for posterity.
Chart speaks for itself along with my last chart. Those Supply/Demand Zones will tell you a lot.
$BTC Probably nothing.CRYPTOCAP:BTC Probably nothing.
Bitcoin RSI is still above 50, which is a definite area for a reversal.
Furthermore, the MA25, VWMA and SMA 26 are still strongly supporting the price, just as they have in previous reversals.

BTCUSD: A bullish channel might be formedHello Traders!
Considering the next few days, we might see a buy opportunity for the king of the Cryptos!
General long-term is bullish,
Mid-term is bearish,
we are around a zone,
a week bearish trend seen breakable.
We would trade the possible channel after reaching the activation line.
If SL hit before the activation line, we'll cancel the trade .
