BTC USD (T)🟢 Main scenario (healthy correction and continuation of growth)
The price is pulling back to the EMA50 / EMA100 (around 113.4k–112.8k).
In this zone — especially near 112.8k — you can look for long confirmations such as a pattern, volume spike, or false breakout downward.
After a rebound, the next targets are: 115.5k → 116.3k (Weekly High),
If this level breaks — a possible move toward 117k–118k.
🔴 Less likely, but possible scenario (deep correction)
If the price consolidates below EMA100 (≈112.8k),
the move may deepen toward the Equilibrium zone (111.0–110.5k).
There will again be a chance for a strong long entry, but only after confirmation.
BTC-D

Is Bitcoin still bearish? (1D)In response to the question of whether Bitcoin is still bearish | the answer is yes.
After the drop, Bitcoin has reached a strong support zone, where it’s currently reacting and consuming lower supports. A rejection from the red zone is expected.
However, keep in mind that due to the high volume of short positions, the red zone might even experience a fakeout before the drop continues.
A daily candle closing above the invalidation level would invalidate this analysis.
For risk management, please don't forget stop loss and capital management
Comment if you have any questions
Thank You

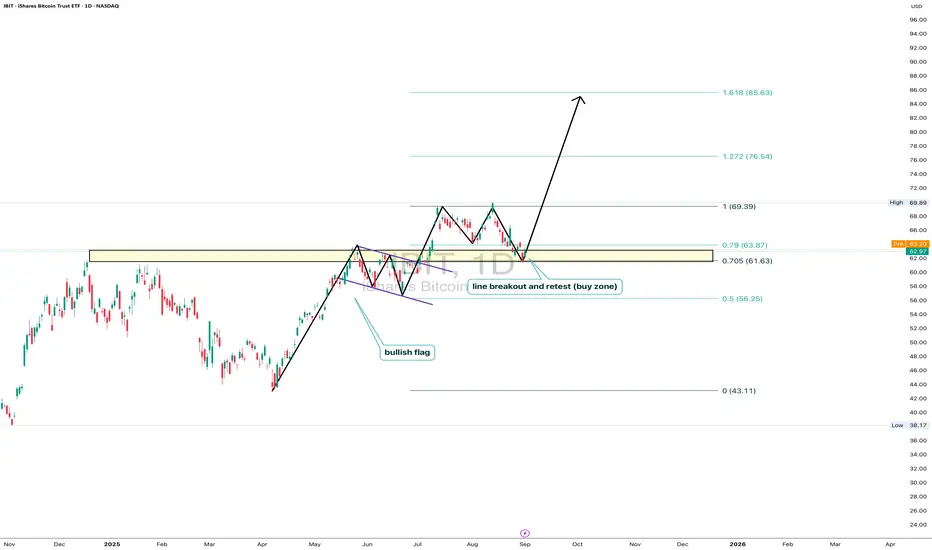
IBIT: ready for liftoffOn the daily chart, iShares Bitcoin Trust (IBIT) trades at $62.97, testing the key 0.705–0.79 Fibo zone ($61.63–63.87). This area marks a breakout and retest line, forming a clear buy zone. The technical structure remains bullish: after breaking out and pulling back, price holds potential to move toward $69.39, with Fibo extensions targeting $76.54 and $85.63. Volumes confirm buyer activity on dips, and the bullish flag pattern supports the continuation of the upward trend.
Fundamentally , the main driver is bitcoin itself, with institutional demand for BTC ETFs staying strong. Large funds continue accumulating positions, while expectations of a softer Fed tone add pressure on the dollar, fueling capital inflows into crypto. This strengthens the bullish case for IBIT.
Tactical plan: watch $61.6–63.8 as the key entry zone. Holding above opens the path toward $69.3, followed by $76.5 and $85.6. The scenario breaks only if price falls below $61.
And let’s be honest: IBIT isn’t just a ticker - it’s the “accelerate bitcoin” button for your portfolio.
Bearish reversal off major resistance?The Bitcoin (BTC/USD) has rejected off the pivot and could drop to the 1st support, which is a pullback support.
Pivot: 109,139.03
1st Support: 109,172.55
1st Resistance: 119,893.62
Disclaimer:
The above opinions given constitute general market commentary, and do not constitute the opinion or advice of IC Markets or any form of personal or investment advice.
Any opinions, news, research, analyses, prices, other information, or links to third-party sites contained on this website are provided on an "as-is" basis, are intended only to be informative, is not an advice nor a recommendation, nor research, or a record of our trading prices, or an offer of, or solicitation for a transaction in any financial instrument and thus should not be treated as such. The information provided does not involve any specific investment objectives, financial situation and needs of any specific person who may receive it. Please be aware, that past performance is not a reliable indicator of future performance and/or results. Past Performance or Forward-looking scenarios based upon the reasonable beliefs of the third-party provider are not a guarantee of future performance. Actual results may differ materially from those anticipated in forward-looking or past performance statements. IC Markets makes no representation or warranty and assumes no liability as to the accuracy or completeness of the information provided, nor any loss arising from any investment based on a recommendation, forecast or any information supplied by any third-party.

Red Alert !... ETH got rejected at the topHi guys,
If you zoom out of ETH you'll notice that its moving sideways on the Weekly/Monthly chart
Which can be bullish or bearish at the same time BUT recently we've seen the price gets rejected at the top of the sideways channel on three different monthly candles which is a red alert in my book.
Now I'm not saying that its going down a 100% but not breaking out of the channel is a very bad sign and could mean the signal for a major drop to the lows of the channel.
Not to mention the 4 years cycle of bitcoin is due and all realistic traders are expecting Bitcoin to drop to the previous all time high at 69000$ and if that happens all alt coins will go down too.
Crypto twitter is insanely bullish (very bad sign) and almost all big markets including US stock market and Gold are at all time high and extreamly over valued so don't listen to the greedy social media or the news and listen to reason and common sense here.
Risk management is advised so stay safe out there and let me know what do you guys think my this.

$BTC — CME Gap Fill First?CRYPTOCAP:BTC | 4h
We pushed all the way into this internal range liquidity 116k.
Price is hovering in short-term consolidation after tagging local resistance, showing early signs of exhaustion as momentum starts to fade.
Watching this lower timeframe demand, either bounce or fill that cme gap at 112.6–112k before another 117–118k upthrust.

Examples of Chart Interpretation Methods
Hello, fellow traders!
Follow us to get the latest information quickly.
Have a great day!
-------------------------------------
#BTCUSDT
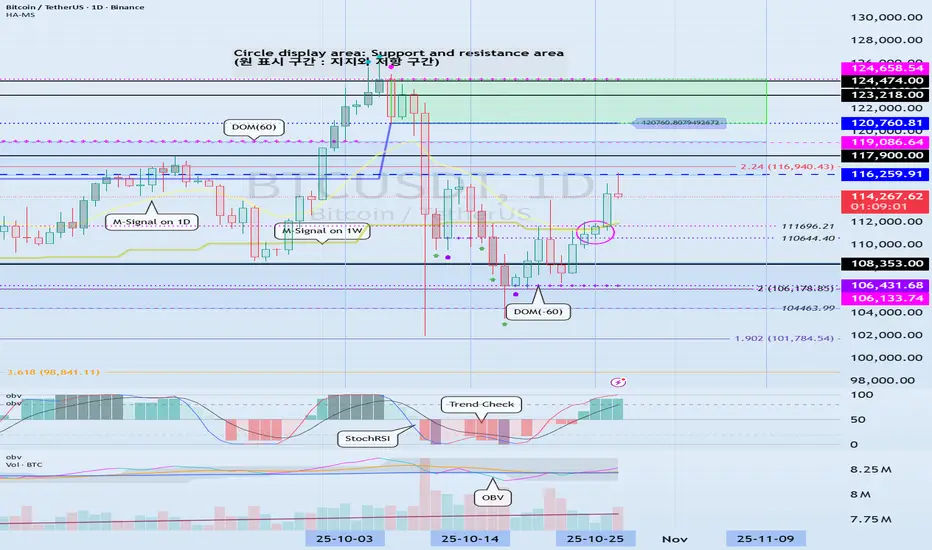
To break above a key point or range and continue the uptrend,
1. The StochRSI indicator must be trending upward. Ideally, it should not enter the overbought zone. 2. The On-By-Signal (OBV) indicator must show an upward trend. If possible, it should remain above the High Line.
3. The TC (Trend Check) indicator must show an upward trend. If possible, it should remain above the 0 level.
Currently, only the TC indicator satisfies the above conditions.
Therefore, if the price remains above the 110644.40-111696.21 range and the above conditions are met, we should see if the price rises above 116259.91 and remains there.
If the On-By-Signal (OBV) indicator remains above EMA 1 and EMA 2 and rises above the High Line, further upside is likely.
However, if the K indicator of the StochRSI indicator enters the overbought zone and the slope changes, the upside may be limited.
When the TC (Trend Check) indicator touches its highest point, there's a high probability of forming a new high, so you should consider a response plan.
Summary of the above:
Support Zone: 110644.40-111696.21
Resistance Zone: 116259.91-119086.64 (up to 124658.54)
------------------------------------
#ETHUSDT
As mentioned in the BTC chart description, ETH is also showing similar movements.
However, the OBV indicator is just about to break above EMA 1 and EMA 2, so if it finds support near 4109.80, there's a possibility of further upside.
-------------------------------------
#ZECUSDT
Based on the BTC chart description, ZEC is likely to continue its upward trend.
The chart is broken due to the sudden surge, making it difficult to determine the duration of volatility.
--------------------------------------------
#XRPUSDT
The key is whether the price can find support at key support and resistance levels and rise above 2.9092.
------------------------------------------
Ultimately, trading will be based on the support and resistance levels drawn on the 1M, 1W, and 1D charts.
However, it is recommended to use auxiliary indicators to confirm whether to initiate a trade.
The basic trading strategy is to buy in the DOM(-60) ~ HA-Low range and sell in the HA-High ~ DOM(60) range.
However, if the price rises in the HA-High ~ DOM(60) range, a step-up trend is likely, while if the price falls in the DOM(-60) ~ HA-Low range, a step-down trend is likely.
Therefore, a fractional trading strategy is recommended.
In this context, the coin (token) currently closest to buying is XRP.
-
Thank you for reading to the end.
I wish you successful trading.
--------------------------------------------------
BTC/USD 1h short-term🧭 General context
• Bitcoin price is ~$114,470.
• The short-term trend remains upwards, which is confirmed by the black trendline.
• The last upward impulse brought the price from ~ USD 111,000 to ~ USD 117,000.
• Currently, the price is testing the support zone after a short correction.
⸻
📊 Key technical levels
• Resistances (green):
• USD 117,815 – local peak, strong resistance (potential TP for longs).
• USD 116,545 – medium resistance, possible retest in the short term.
• $115,518 – lower resistance, bulls decision point.
• Support (red):
• USD 114,667 – currently tested level (important intraday support).
• USD 113,545 – another strong support (close to trendline).
• USD 111,915 – the limit after which the upward trend may reverse.
⸻
⚙️ Trendline
• The trend line runs from approximately USD 110,000 and connects subsequent lows.
• The price is currently close to the trendline, so:
• Rebound → continuation of the upward trend,
• Breakout → possible decline to 113,500 or lower (up to USD 111,900).
⸻
📈 Oscillator (Stochastic RSI)
• It is located close to the oversold zone (approx. 8 p.m.).
• This means that the market is close to a potential rebound - a bullish signal (if the %K and %D lines cross upwards).

BITCOIN CLEAR REJECTION|SHORT|
✅BTCUSD made a liquidity grab above the previous high, price sharply rejected from the 4H supply area, confirming a fakeout and shift in order flow. The market structure suggests redistribution, with inefficiency below acting as the draw on liquidity. Expect short-term delivery toward $114,000. Time Frame 4H.
SHORT🔥
✅Like and subscribe to never miss a new idea!✅

LTC: long position!The month of trading proved to be good (LTC).
The general trend shows an increase in prices, with the last buy signal being given in the range of 92-94 USDT, after which the price continued to move up to the current level of about 102.39 USDT

BITCOIN SIGNAL: SHOCKER TARGET REVEALED!!! (warning) Yello Paradisers! Enjoy the video!
And Paradisers! Keep in mind to trade only with a proper professional trading strategy. Wait for confirmations. Play with tactics. This is the only way you can be long-term profitable.
Remember, don’t trade without confirmations. Wait for them before creating a trade. Be disciplined, patient, and emotionally controlled. Only trade the highest probability setups with the greatest risk to reward ratio. This will ensure that you become a long-term profitable professional trader.
Don't be a gambler. Don't try to get rich quick. Make sure that your trading is professionally based on proper strategies and trade tactics.

BTC $115,200 TARGET BREAKOUT: The Ultimate Long SignalThe Logic Behind $115,200: This analysis pinpoints the critical multi-year resistance/supply zone at $115,200. A confirmed close above this level is the ultimate trigger for the next parabolic leg up in the Bitcoin cycle. Our proprietary provides a filtered, no-noise signal specifically for this major breakout level. Key Features: * Precision Entry: Alerts only on the confirmed breach of the 115,200 supply * Risk Management: Includes projected Take Profit 1 & 2 targets * Filtered Noise: Uses to validate the move Action: Set your alerts and prepare for liftoff! The market structure dictates that this level is make-or-break for a new All-Time High pursuit.

Bitcoin Analysis 4 HoursBitcoin Time Frame 4 Hours
Currently between two 4-hour balances
Supports 114 and 112 and resistances 118 and 120
Liquidity ranges are characteristic
As long as we are above the green balance, we tend to rise, especially since the bearish balance (red) has not yet pulled back and for further correction and low liquidity hunt, we bet on a 4-hour candle below 111, so for now, there is more upside and pullback with buyer support in the market for resistances

BTCUSD SELL IDEACurrent price: around $114,976
Recent structure: The price made a CHoCH after forming a lower high around $115,600, signaling a potential shift from bullish to bearish momentum.
BOS confirmation: A break of structure downward confirms sellers taking control.
Supply zone: A red zone above ~$115,400–$116,000 shows a bearish supply area, where price could retrace to before continuing lower.
Expected move: A short-term pullback (retracement) toward ~$115,200–$115,400 before a continuation down toward the demand zone near $113,200–$112,800.
📉 Sell idea summary:
Bias: Bearish
Entry zone: ~$115,200–$115,400 (after retracement)
Target: ~$113,200
Stop loss: Above ~$115,600

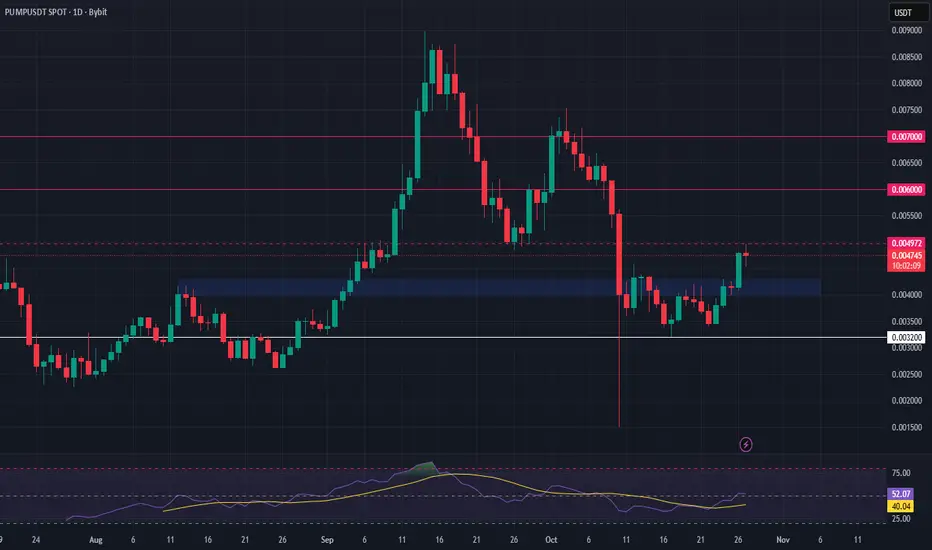
PUMPUSDT – Long Setup at Key Support ZonePUMP is retesting resistance while pulling back into a critical support zone, offering a potential spot long opportunity for those monitoring the range. The price action is forming a confluence area that could act as a base for the next upward move.
📍 Entry Zone: $0.0040 – $0.0043
🎯 Take Profit Targets:
• TP1: $0.0060
• TP2: $0.0070
🛑 Stop Loss: $0.0032
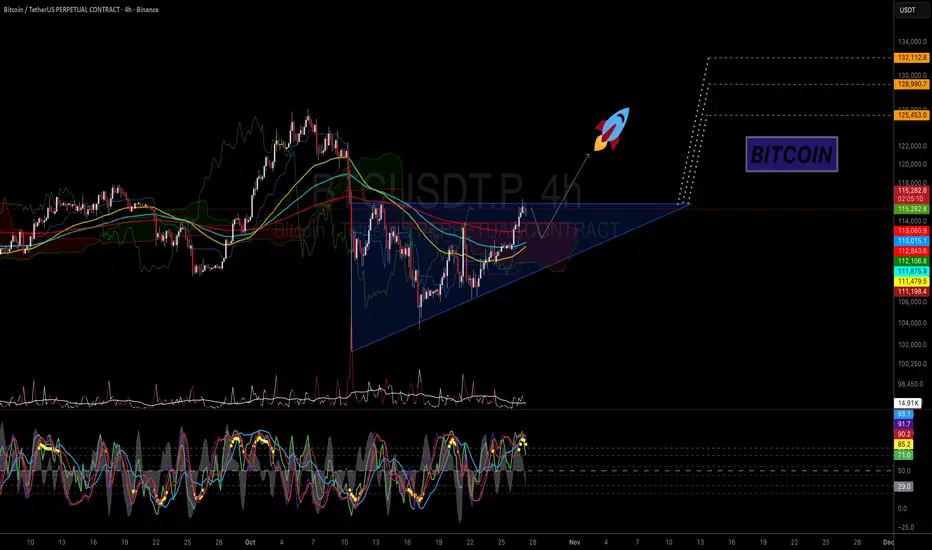
BTC - Ascending Triangle in PlayMorning fellas,
Halloween coming up and trust me, we gonna get that pump and one more leg up to ATH.
Obv you do you, its your money so its up to you the risk you take, but I am riding this like a biker riding a harley over a sunset.
Trade thirsty, my friends!
Will Bitcoin on 4H Push Higher or Take a Breath? | BTC 11👋🏻 Hey everyone! Hope you’re doing great! Welcome to SatoshiFrame channel.
✨ Today we’re diving into the 4-Hour Bitcoin analysis. Stay tuned and follow along!
👀 Looking at Bitcoin on the 4-hour timeframe, we can see that after breaking its multi-timeframe resistances, it is currently located near the price resistance of $115,793. If Bitcoin breaks this area, it can move toward its next resistance at $121,000.
🧮 Observing the RSI oscillator, we can see that it is currently in its OverBuy zone, and the important point here is to wait for it to exit the overbought area and form a new oscillation structure.
🎇 Pay attention to Bitcoin’s volume, which has been increasing up to this point. Even as it reaches the current resistance, buying volume is still rising and buyers are trying to push prices higher. But since there’s potential for selling pressure, we wait for volume to decrease a bit and allow the market to rest.
✍️ The scenario ahead for Bitcoin is independent of any trade or position, but we can use it to better understand Bitcoin’s corrective or resting behavior.
🛡 Bitcoin has just experienced a beautiful bullish leg across multi-timeframes, and the effects of this upward wave have also extended into higher timeframes such as the 4-hour and daily charts. Price, in a multi-timeframe structure, now requires a short-term correction and a pullback to fill lower buy orders. Keep in mind that traders typically take profit in such zones.
❤️ Disclaimer : This analysis is purely based on my personal opinion and I only trade if the stated triggers are activated .

27/10/25 Weekly OutlookLast weeks high: $115,481.36
Last weeks low: $106,688.94
Midpoint: $111,085.15
It's FOMC week again and with it comes speculation and volatility. With the Fed forecast to cut rates another 0.25% where does this leave Bitcoin?
After weeks of consolidation between $106,000 - $111,000 BTC broke above $112,000 resistance level suggesting that sellers have largely been absorbed and momentum is returning to the upside. Trading volume surged as BTC crossed the $112,000 threshold, indicating strong conviction from both institutional and retail participants.
Short-term volatility is expected around the FOMC announcement, I would not rule out a $112,000 retest, it would be a good indicator of just how strong this breakout move is. Macro conditions continue to favor Bitcoin’s long-term bullish case particularly if the Fed signals an eventual shift toward easing in 2026 which is already being discussed.
The next major test lies around $120,000 if weekly high resistance is flipped, but a decisive close above this threshold would likely trigger another wave of momentum buying toward $125K and beyond.
For the bear case a loss of $112,000 would mean a revisit of the same $106,000 - $111,000 range and an increasing loss of momentum for the bull run.
Good luck this week everybody!

BITCOIN This is what separates 128k from 104k.Bitcoin (BTCUSD) just broke above its 1D MA50 (blue trend-line) for the first time in 2 weeks and only days after it got rejected there. A 1D candle closing above it will be a strong bullish signal.
As BTC has been trading within a Megaphone pattern similar to the December 2024 - April 2025 one, a closing above the 1D MA50 might put the structure in a similar situation as April 17. As you can see that Megaphone also had a 1D MA50 rejection preceding the break-out and before that also, two Lower Lows near the 1W MA0 (red trend-line).
What it hasn't had (so far?) is a clear touch of the 1W MA50 (as on April 07) and a 1D MACD Higher Lows Bullish Divergence.
As a result, both scenarios are open for now. Until it closes above the 1D MA50, a 1W MA50 test remains possible around $104000. A closing above the 1D MA50 though strengthens the probability of a 1.1 Fibonacci extension rally at $128000.
What do you think is more likely to happen? Feel free to let us know in the comments section below!
-------------------------------------------------------------------------------
** Please LIKE 👍, FOLLOW ✅, SHARE 🙌 and COMMENT ✍ if you enjoy this idea! Also share your ideas and charts in the comments section below! This is best way to keep it relevant, support us, keep the content here free and allow the idea to reach as many people as possible. **
-------------------------------------------------------------------------------
💸💸💸💸💸💸
👇 👇 👇 👇 👇 👇

Bitcoin (update)As mentioned, Bitcoin has reached $115,000.
However, the key point is this: as long as BTC fails to break and hold above the $117500 level, the risk of a bearish reversal remains.
Until Bitcoin stabilizes within the highlighted yellow zone, we cannot expect a move toward the $121000 target.
previous analysis

BTCUSDT: Bounce from Support Could Ignite Rally Toward $114KHello everyone, here is my breakdown of the current Bitcoin setup.
Market Analysis
Bitcoin (BTCUSDT) has recently transitioned from a bearish phase to a bullish structure after breaking out of a prolonged downward channel. The market had been forming a sequence of lower highs and lower lows until it found strong demand in the support zone around 110,000. From there, price began consolidating, indicating that sellers were losing control.A decisive breakout from the channel marked the end of bearish pressure, and since then, BTC has been moving inside a new upward channel, forming higher highs and higher lows — a clear sign of bullish momentum returning.
Currently, the price is approaching the resistance zone near 113,600–114,000, which previously acted as a key supply area. The ongoing structure suggests that buyers are attempting to push through this level and confirm a breakout continuation.
My Scenario & Strategy
In my view, BTC may attempt to retest the local support area near 111,000 before resuming its move higher. A successful bounce from this level would confirm that the new upward channel remains intact and provide a favorable long opportunity targeting the 114,000–115,000 zone.
If price breaks and holds above this resistance zone, it will likely open the door for a stronger bullish continuation toward 118,000 and beyond.
However, if BTC fails to maintain the channel support, a temporary correction back to the 110,000 area could occur before the next upward impulse.
That's the setup I'm tracking. Thank you for your attention, and always manage your risk.

JELLY/USDT — Building Momentum Inside Volume BoxJELLY is stabilizing within the $0.075 – $0.12 volume box, signaling a potential accumulation zone before expansion.
A clean breakout and hold above $0.12 could confirm strength and open targets toward $0.16+ in the short term.
📊 Volume Zone: $0.075 – $0.12
📈 Breakout Target: $0.16

BTC correction complete?BTC is heading to the top of the channel once more after testing support High Volume Node, swinging below the macro trend-line and daily 200EMA before recovering.
FEAR was in hold of social media. Cycle top nonsense is a poison narrative to success
Price is above the daily pivot and 200EMA in a bull structure. RSI crossed bullishly.
Safe trading
