Bitcoin at the Top of Wedge – Bearish Reversal Coming Again?As I expected in yesterday’s idea , Bitcoin dropped to the $107,800 level, hitting its target .
In the last few hours, BTC started to pump again and is now trading near a cluster of resistances : the 100_SMA(Daily) , the 50_SMA(Daily) , and Cumulative Short Liquidation($117,517-$116,020) . This creates a strong resistance , and I don’t think Bitcoin will easily break through it. ( As of the time of writing, there’s no fresh news influencing the market .)
From an Elliott Wave perspective, it looks like Bitcoin is forming a Triple Three Correction(WXYXZ ).
On the Classical Technical side, Bitcoin is at the top of an ascending broadening wedge pattern , which is a reversal pattern . There’s also a Regular Bearish Divergence (RD-) between the two peaks in this pattern.
I expect that in the coming hours, Bitcoin will start to drop again. After breaking the important $111,000 level , it could fall at least to the lower line of the ascending broadening wedge .
Note: In these past few days, the Bitcoin and crypto market have been quite volatile and driven by news, especially related to US-China tensions. So always manage your risk carefully and avoid impulsive decisions based on sudden headlines.
New CME Gap: $107,690-$107,220
Cumulative Long Liquidation: $107,105-$104,297
Cumulative Short Liquidation: $115,241-$113,454
Stop Loss(SL): $116,200
Please respect each other's ideas and express them politely if you agree or disagree.
Bitcoin Analysis (BTCUSDT), 1-hour time frame.
Be sure to follow the updated ideas.
Do not forget to put a Stop loss for your positions (For every position you want to open).
Please follow your strategy and updates; this is just my Idea, and I will gladly see your ideas in this post.
Please do not forget the ✅' like '✅ button 🙏😊 & Share it with your friends; thanks, and Trade safe.
BTC-D

BITCOIN SIGNAL: NEXT MASSIVE MOVE IN THIS DIRECTION IS FORMING!!Yello Paradisers, I hope you are doing fine. This is a video for you. Enjoy. I hope you are enjoying it. Smash the rocket button if you want. I will see you again next time. You can also share this video. I will be retweeting everybody who gonna mention me and TradingView.
And Paradisers! Keep in mind to trade only with a proper professional trading strategy. Wait for confirmations. Play with tactics. This is the only way you can be long-term profitable.
Remember, don’t trade without confirmations. Wait for them before creating a trade. Be disciplined, patient, and emotionally controlled. Only trade the highest probability setups with the greatest risk to reward ratio. This will ensure that you become a long-term profitable professional trader.
Don't be a gambler. Don't try to get rich quick. Make sure that your trading is professionally based on proper strategies and trade tactics.

TradeCityPro | Bitcoin Daily Analysis #203👋 Welcome to TradeCity Pro!
Let’s get into today’s Bitcoin analysis. The market is really uncertain right now and is showing a lot of random, irrational volatility. It’s very important to stay closely updated in these kinds of situations — so let’s dive into the chart.
⏳ 1-Hour Timeframe
Yesterday, Bitcoin made an upward move and managed to reach the 113,429 zone.
⭐ However, after this move, the price faced a strong rejection from that level, completely retraced the entire upward move, and is now back around the 107,486 support zone.
✔️ We can say that this move was a Dead Cat Bounce (DCB) because heavy bearish momentum has now entered the market, and Bitcoin is currently fluctuating around 107,486.
✨ A break of this level will give us the main confirmation of a bearish continuation, and the next bearish leg of Bitcoin could begin.
🧩 For now, it’s better not to rely on momentum oscillators like RSI, since the market lacks clear momentum. However, the volume shows that buyers have been trying to defend the 107,486 support — but as long as the price stays below 113,429, those efforts won’t have much impact.
💥 I’ll open a short position if 107,486 breaks. The next zones that the price might react to are 106,319 and 104,488.
🔔 For long positions, there’s currently no valid trigger — we’ll need to wait until a proper structure forms.
❌ Disclaimer ❌
Trading futures is highly risky and dangerous. If you're not an expert, these triggers may not be suitable for you. You should first learn risk and capital management. You can also use the educational content from this channel.
Finally, these triggers reflect my personal opinions on price action, and the market may move completely against this analysis. So, do your own research before opening any position.

If this looks bullish.. you got another thing coming History doesn't repeat itself, but it often rhymes. So far 1:1.
I reckon the next 356 days will test out Saylors holders
$XRP / $BTC bullish enough Ripple broke above the falling channel structure, which has existed since 2017, and also broke above the 50 EMA in November 2024. Following this breakout, the price entered a prolonged period of re-accumulation.
The recent market crash served as a technical retest of this structure.
While short-term volatility may appear misleading, over the long term, CRYPTOCAP:XRP still maintains a clearly bullish structure.

ZECUSD - Oh no are we in bear market since 2 weeks ? want to finish on a good working idea before stoping publishing hehe
this double bottom formation has been seen too much time lately
I entered now
SL : 340 for now, will update lower at 310 when white trendline broke down
Also depends on BTC reaction but i think daddy is going to see 100k or sub 100k first before going a bit up (last rejection made me switch bear for some days)
first TP : 155
second TP : 60/70
Cheers not advice

BTC 1H Analysis | Day 7🥳 Hey everyone! Hope you’re doing great! Welcome to SatoshiFrame channel.
✨ Today we’re diving into the 1-Hour Bitcoin analysis. Stay tuned and follow along!
👀 On the one-hour timeframe of Bitcoin, we can see that after last night’s pump, Bitcoin failed to break through the resistance zone at $113,400 and was rejected downward from this area. It’s currently sitting at its support floor around $107,537, and losing this level could lead to a further decline.
🧮 The RSI oscillator has now formed two important zones — 50 and 38 — and when the fluctuation limit crosses these zones, Bitcoin may start its next move with increased volatility.
🕯 Last night, Bitcoin had good buying volume while approaching its resistance, but the key point was that it was then pushed down sharply by heavy selling pressure, losing even its multi–timeframe support floors. Keep in mind that Bitcoin needs an increase in buying or selling volume to break through these identified levels.
🧠 I’ve explained the upcoming Bitcoin scenarios in the following paragraph.
🟢 Long Position Scenario: A breakout of the nearest resistance zone at $109,383, along with the RSI crossing above the 50 level and buying pressure strong enough to absorb all the sell orders in this area.
🔴 Short Position Scenario: The current level Bitcoin is sitting at is a very critical support. Losing this support at $107,537, combined with the RSI dropping below 38 and increased selling pressure, could trigger a continued downward move, pushing Bitcoin toward its lower support zones.
❤️ Disclaimer : This analysis is purely based on my personal opinion and I only trade if the stated triggers are activated .

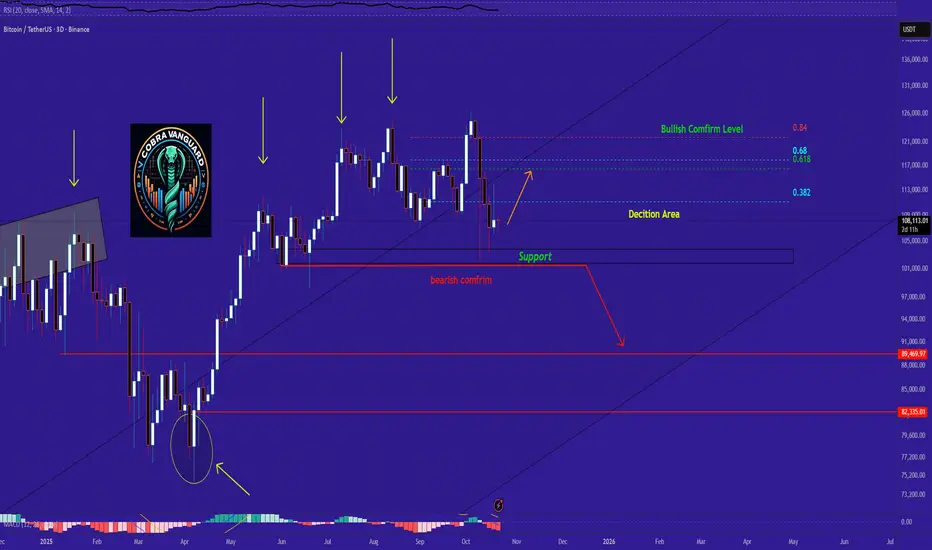
Bitcoin Technical Outlook (Based on Recent Observations)So far, Bitcoin has not yet completed the 3-day red candle close we've been watching. The key decision zones I previously marked—especially the 0.382 Fibonacci level at $112,890—remain unbroken. This level is critical for confirming bullish continuation.
For Bitcoin to maintain its upward momentum, we need a candle close above both the decision zone and the channel's midline, as illustrated by the orange arrow I previously shared.
In my view, if the $103K–$100K support zone breaks downward, we could shift into a bearish stance. This type of behavior from Bitcoin has been typical over the past 640 days.
IS BSV READY FOR NEW CYCLE MOVE TO $100 - 2025Bitcoin SV is showing on the short-term view a trend that can have an upcoming increase in volume. Further checking if SV is going to confirm the $25-28, which can lead to a breakout back to up $40 level.

Bearish reversal for Bitcoin?The price is rising towards the pivot and could reverse to the pullback support.
Pivot: 108,846.88
1st Suport: 104,701.40
1st Resistance: 113,431.55
Disclaimer:
The above opinions given constitute general market commentary, and do not constitute the opinion or advice of IC Markets or any form of personal or investment advice.
Any opinions, news, research, analyses, prices, other information, or links to third-party sites contained on this website are provided on an "as-is" basis, are intended only to be informative, is not an advice nor a recommendation, nor research, or a record of our trading prices, or an offer of, or solicitation for a transaction in any financial instrument and thus should not be treated as such. The information provided does not involve any specific investment objectives, financial situation and needs of any specific person who may receive it. Please be aware, that past performance is not a reliable indicator of future performance and/or results. Past Performance or Forward-looking scenarios based upon the reasonable beliefs of the third-party provider are not a guarantee of future performance. Actual results may differ materially from those anticipated in forward-looking or past performance statements. IC Markets makes no representation or warranty and assumes no liability as to the accuracy or completeness of the information provided, nor any loss arising from any investment based on a recommendation, forecast or any information supplied by any third-party.

eurgbp looking bullish over all trend is up and now breaking bullish pennant consolidation towards upside, successful breakout can lead 120 pips bullish wave, keep in mind that we need breakout, without breakout there is no entry

BTC update — still red, eyes on 109.3K📊 Market Update
BTC lost the +volume in the last 24H. With this time frame, BTC will only be back in the volume zone if it returns to 109.3K.
Until that, BTC stays in breakdown mode.
The new BTC cycle can start from 116K.
For now, we follow daily BTC to see if it turns green — starting from the low time frame, which is still red.
🔹 Market Structure
In the last 12H the market showed a breakdown trend.
In the last 4H, the market is building an accumulation trend — still processing.
Soon, new update with last follow.

THE RETURN OF AVNTDepending on the low time frame, this coin shows an increasing view, which data shows that there is a high chance this coin will return, we will follow the confirmations in the coming time frames

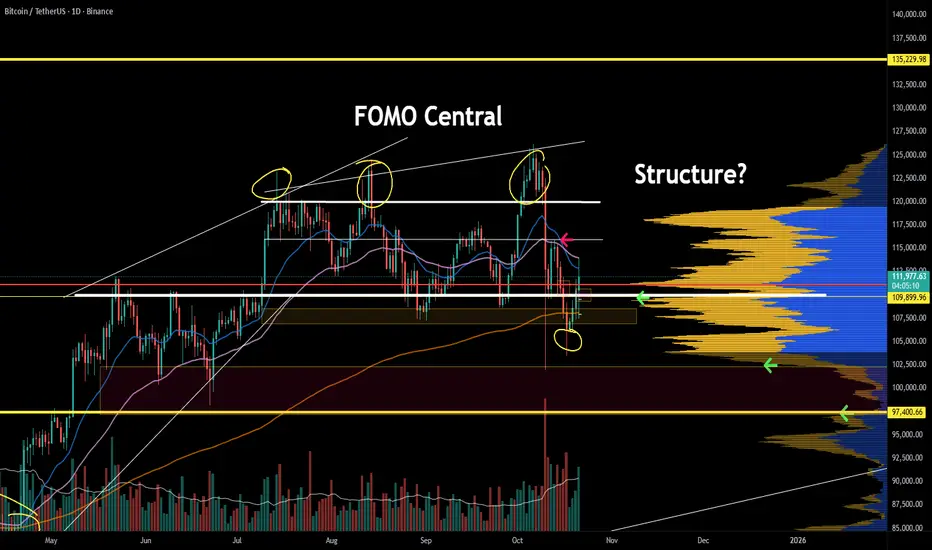
$BTC – Make-or-Break ZoneA couple of things I want to highlight:
On the weekly chart, price is still at a critical level, retesting the S/R level for the second time.
Technically, if this move was truly impulsive, we shouldn’t be seeing price come back to the breakout area twice. We made a new ATH, but that strong rejection and marginal new high don’t look great.
That said, we could still get a three-tap on the trendline around 105.3k. A quick wick down there would be fine, but if price stalls at that level, that’d start to look a bit concerning.

BTCUSDT 2-Hour Chart Analysis !!BTCUSDT 2-Hour Chart Analysis
This 2-hour chart of Bitcoin/USDT shows the shift in price structure, as well as key technical levels and potential scenarios:
Bitcoin has broken out of a long-standing descending trendline and initially retested this breakout.
The market recently reached the resistance area around $111,000-$112,500, marked by the gray band.
Support:
The previous green box ($102,500-$106,000) remains a key demand area below, where buyers previously emerged.
Resistance:
The gray resistance area of $111,000-$112,500 has caused several rejections, but now the price is consolidating just below it after a breakout attempt.
Higher resistance at $123,000-$124,000 remains a distant target.
Retest and Breakout:
After reclaiming the trendline, the price has returned to test support at the breakout level and the lower trendline. This retest is significant: if bulls defend this area, we could see a new uptrend toward the $112,500 resistance area and possibly even higher, as indicated by the green arrow.
Upside Scenario:
If the price remains above the intersection of the trendline and horizontal support, a rally toward $115,000-$117,000 becomes possible.
Downside Risk:
Failure to hold the breakout level could cause the price to retrace to the green support area below $106,000.
DYOR | NFA

Will escalating trade tensions continue to pressure bitcoin?
Investor confidence in Bitcoin is weakening as fears grow over a potential breakdown in US-China talks and accelerating institutional outflows. President Trump hinted that the meeting may not take place, reigniting trade concerns and fueling broader risk aversion that further pressured crypto sentiment. Meanwhile, heightened market volatility and deteriorating risk appetite triggered USD 530 million in outflows from Bitcoin ETFs in a single day.
BTCUSD briefly tested 114000 before consolidating within the range of 106000–114000. The death-crossed EMAs indicate a potential shift toward bearish momentum. If BTCUSD breaks below the 106000 support, the price could retreat toward 100000. Conversely, if BTCUSD breaches above both EMAs and the 114000 resistance, the price may advance toward 126000.

Bitcoin Analysis.I still believe that the markets are still down trending. We will see how prices react to the discount imbalances to see if we get a reaction from the weekly third trend line touch.

GOLD – top is in?There are many possible Elliott Wave interpretations regarding the recent years in gold, but one thing seems quite clear. The rise that began in August 2025 was preceded by a triangle, which according to wave theory always signals the final wave of an impulse of the same degree. After it concludes, one should expect a correction of the entire impulsive five-wave sequence, typically retracing to the level of the preceding fourth wave.
In recent days, the media have been filled with images of people buying physical gold — and as we know, the crowd is never right. Could this widespread euphoria be signaling the end of the bull run, at least for a while? Many signs point to that. It is not unlikely that we will soon see capital rotation into crypto.

Bitcoin - Make it or break itBTC is at a level that will define whether we enter a bear market or a bull market. A Dip to the downside may cause a cascade effect that can take the market lower than expected. However, the majority of the signs in the market structure, momentum, and tradfi suggest that up is to be expected. To get shaken out with the evidence. Watch out for this bullish response if it does not produce something favorable, embrace for impact.
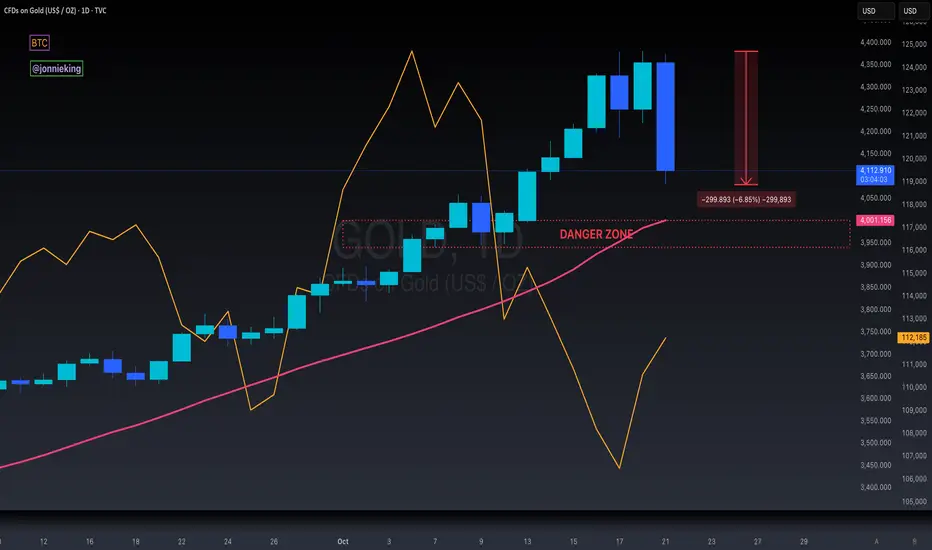
$GOLD Bearish Engulfing on Daily - Rotation to $BTC Incoming!MASSIVE BEARISH ENGULFING FORMING ON THE TVC:GOLD DAILY CHART.
Down ~7% just on the day alone.
~$2 TRILLION has been wiped out on its market cap,
the equivalent of Bitcoin’s entire MC.
We can see the rotation into CRYPTOCAP:BTC in real-time here.
If GOLD Closes below the DANGER ZONE,
it’s game-over for everyone’s favorite pet rock 🪙
$BTC / $GOLDThe Golden age will fade in the shadow of Bitcoin
The Bitcoin/Gold pair maintains its major uptrend, with the price trapped between the 2021 ATH resistance and the uptrend.
As it does before every strong run, it's holding above the demand zone.
Once the 2021 ATH resistance (supply zone) is broken, Bitcoin will continue to change not only the pair's price against gold but also its perceptions.
Be prepared… a face melting move is coming soon.

Inverse Head & Shoulders on Bitcoin – Breakout or Bull Trap?Right now, Bitcoin ( BINANCE:BTCUSDT ) is moving within its Heavy Support zone($111,980-$105,820) .
Over the past couple of days, it tried twice to break this area but couldn’t. One big reason is that recently, there was news that Japan is considering allowing banks to invest in crypto . Also, yesterday, Trump confirmed he’ll meet with China’s president on October 31st , which the market took as a positive sign that US-China tensions might ease. Previously, the market dropped on news of potential tariffs, and now it’s reacting to the possible easing of those tensions.
In the last 24-48 hours , Bitcoin has formed an inverse head and shoulders pattern , which could signal a short-term bullish reversal. However, there are still important resistance levels and cumulative short liquidation areas overhead. We need to see if Bitcoin can break through those.
From an Elliott Wave perspective, Bitcoin still seems to be in a corrective structure, and until it gets above around $116,000 , there’s still a risk of further downside. So we shouldn’t get too excited about the recent 48-hour bounce.
In short, I expect Bitcoin might push up to those Resistance lines , the Resistance zone($114,300-$113,000) , and Cumulative Short Liquidation($115,241-$113,454) , thanks to the inverse head and shoulders, but it could face resistance there and possibly drop again.
Note: It seems that we may see an increase in Bitcoin with the opening of the US market, but because the SPX500 index( SP:SPX ) is in a correction situation, we can expect Bitcoin to fall again.
Note: Crypto market conditions depend on many parameters these days, and be sure to observe capital management.
New CME Gap: $107,690-$107,220
Cumulative Long Liquidation: $107,000-$105,782
Cumulative Short Liquidation: $112,241-$111,398
Please respect each other's ideas and express them politely if you agree or disagree.
Bitcoin Analysis (BTCUSDT), 1-hour time frame.
Be sure to follow the updated ideas.
Do not forget to put a Stop loss for your positions (For every position you want to open).
Please follow your strategy and updates; this is just my Idea, and I will gladly see your ideas in this post.
Please do not forget the ✅' like '✅ button 🙏😊 & Share it with your friends; thanks, and Trade safe.

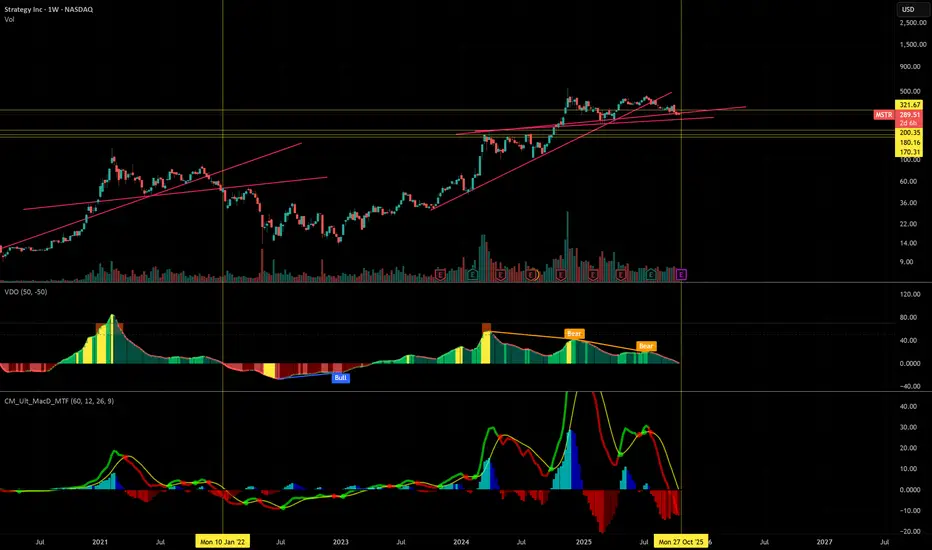
BTC - History Doesn’t Repeat, But It Rhymes!Bitcoin has always been a market of patterns, and when you zoom out, the weekly chart tells a familiar story.
🏹 Each major bull cycle follows a similar rhythm : a strong rally, a sharp correction, a fakeout below support, and then another impulsive leg higher.
We’ve seen this movie before. In 2023, BTC broke its structure briefly before continuing its climb. Again in 2024, the market dipped below the trendline, shaking out late buyers, only to bounce and push to new highs. Now, in 2025, we’re testing that same rising trendline once again, showing another possible “fakeout before takeoff” scenario.
🔄If history continues to rhyme, this pullback could mark the final correction before BTC resumes its journey toward the upper boundary of the rising channel - possibly into the 150K–160K zone over the next phase.
But if this time is different and BTC fails to reclaim the trendline, we could witness a longer consolidation phase before the next major impulse.
The key remains the same: watch the weekly close around the trendline. Each time BTC dipped below and reclaimed it, the next move was explosive.
History might not repeat perfectly - but it tends to rhyme beautifully.
📊All Strategies Are Good; If Managed Properly!
~Richard Nasr
