ETH — Price Slice. Capital Sector. 2944.78 BPC 10.1© Bolzen | The Architect | BPC Framework
Bolzen Market Institute
🏷 ETH — Price Slice. Capital Sector.
TradingView Publication Date: 08.01.2026
🏷 2944.78 — price not yet reached at time of publication.
🏷 BPC — The Bolzen Price Covenant — Strength Index: 10.1
Quantum structure of obligations and capital flow in price formation via energy blocks.
🏷 Vertical chart — Energy Grid Dashboard.
🏷 Static Stream 1: price published in energy-block production sequence.
🏷 The price energy block is already ordered—not by time, but by execution priority. Crucially: block priority dynamically reconfigures in response to hidden energetic impulses, whereas price execution order records their market manifestation. Every price in the dynamic stream is tied to proprietary energy-production metrics inaccessible to the general public. Those who perceive structure before its manifestation do not follow price—they anticipate it.
EΞ2Φ8Ψ45Θ·ζ⁻¹·106Λ732·Ω²
📎 Screenshot:
🏷 When trading from levels, use liquidity zones from BPC 10 and above.
🏷 Bolzen Liquidity Map — ETH (numerical equivalent):
🏷 I. Interactive Reference Guide: BPC — The Bolzen Price Covenant
🏷 P.S. English is not my native language — I offer no apologies for stylistic imperfections. What you see here is not a post. It is a demonstration of another level of preparation: the symbiosis of human intuition and algorithmic precision. Mathematics and aggressive market analysis — against the machine of liquidations.
— The Architect
BPC — The Bolzen Price Covenant
Btc-e

ETH — Price Slice. Capital Sector. 2957.65 BPC 2.5© Bolzen | The Architect | BPC Framework
Bolzen Market Institute
🏷 ETH — Price Slice. Capital Sector.
TradingView Publication Date: 08.01.2026
🏷 2957.65 — price not yet reached at time of publication.
🏷 BPC — The Bolzen Price Covenant — Strength Index: 2.5
Quantum structure of obligations and capital flow in price formation via energy blocks.
🏷 Vertical chart — Energy Grid Dashboard.
🏷 Static Stream 1: price published in energy-block production sequence.
🏷 The price energy block is already ordered—not by time, but by execution priority. Crucially: block priority dynamically reconfigures in response to hidden energetic impulses, whereas price execution order records their market manifestation. Every price in the dynamic stream is tied to proprietary energy-production metrics inaccessible to the general public. Those who perceive structure before its manifestation do not follow price—they anticipate it.
EΞ2Φ8Ψ45Θ·ζ⁻¹·106Λ732·Ω²
📎 Screenshot:
🏷 When trading from levels, use liquidity zones from BPC 10 and above.
🏷 Bolzen Liquidity Map — ETH (numerical equivalent):
🏷 I. Interactive Reference Guide: BPC — The Bolzen Price Covenant
🏷 P.S. English is not my native language — I offer no apologies for stylistic imperfections. What you see here is not a post. It is a demonstration of another level of preparation: the symbiosis of human intuition and algorithmic precision. Mathematics and aggressive market analysis — against the machine of liquidations.
— The Architect
BPC — The Bolzen Price Covenant

ETH — Price Slice. Capital Sector. 2963.72 BPC 9.6© Bolzen | The Architect | BPC Framework
Bolzen Market Institute
🏷 ETH — Price Slice. Capital Sector.
TradingView Publication Date: 08.01.2026
🏷 2963.72 — price not yet reached at time of publication.
🏷 BPC — The Bolzen Price Covenant — Strength Index: 9.6
Quantum structure of obligations and capital flow in price formation via energy blocks.
🏷 Vertical chart — Energy Grid Dashboard.
🏷 Static Stream 1: price published in energy-block production sequence.
🏷 The price energy block is already ordered—not by time, but by execution priority. Crucially: block priority dynamically reconfigures in response to hidden energetic impulses, whereas price execution order records their market manifestation. Every price in the dynamic stream is tied to proprietary energy-production metrics inaccessible to the general public. Those who perceive structure before its manifestation do not follow price—they anticipate it.
EΞ2Φ8Ψ45Θ·ζ⁻¹·106Λ732·Ω²
📎 Screenshot:
🏷 When trading from levels, use liquidity zones from BPC 10 and above.
🏷 Bolzen Liquidity Map — ETH (numerical equivalent):
🏷 I. Interactive Reference Guide: BPC — The Bolzen Price Covenant
🏷 P.S. English is not my native language — I offer no apologies for stylistic imperfections. What you see here is not a post. It is a demonstration of another level of preparation: the symbiosis of human intuition and algorithmic precision. Mathematics and aggressive market analysis — against the machine of liquidations.
— The Architect
BPC — The Bolzen Price Covenant

BTC — Price Slice. Capital Sector. 88686.49 BPC 10© Bolzen | The Architect | BPC Framework
Bolzen Market Institute
🏷 BTC — Price Slice. Capital Sector.
TradingView Publication Date: 08.01.2026
🏷 88686.49 — price not yet reached at time of publication.
🏷 BPC — The Bolzen Price Covenant — Strength Index: 10
Quantum structure of obligations and capital flow in price formation via energy blocks.
🏷 Vertical chart — Energy Grid Dashboard.
🏷 Static Stream 1: price published in energy-block production sequence.
🏷 The price energy block is already ordered—not by time, but by execution priority. Crucially: block priority dynamically reconfigures in response to hidden energetic impulses, whereas price execution order records their market manifestation. Every price in the dynamic stream is tied to proprietary energy-production metrics inaccessible to the general public. Those who perceive structure before its manifestation do not follow price—they anticipate it.
EΞ2Φ8Ψ45Θ·ζ⁻¹·106Λ732·Ω²
📎 Screenshot:
🏷 When trading from levels, use liquidity zones from BPC 10 and above.
🏷 Bolzen Liquidity Map — BTC (numerical equivalent):
🏷 In development — coming soon
🏷 I. Interactive Reference Guide: BPC — The Bolzen Price Covenant
🏷 P.S. English is not my native language — I offer no apologies for stylistic imperfections. What you see here is not a post. It is a demonstration of another level of preparation: the symbiosis of human intuition and algorithmic precision. Mathematics and aggressive market analysis — against the machine of liquidations.
📎 Architect’s Note:
I thank TradingView moderation for their constructive collaboration and for enabling the display of analytical artifacts in their evolutionary state. Publishing maps in prefactum mode is not merely a technique—it is a method of future verification through structure. This is BPC quantum analytics—The Bolzen Price Covenant.
The persistent ETH and BTC Energy Grid Dashboard remains publicly accessible and is intended for international institutional review.
— The Architect
BPC — The Bolzen Price Covenant

Bitcoin Hits PRZ — Short-Term Reversal in PlayBitcoin( BINANCE:BTCUSDT ), as I expected in the previous idea , continued its bearish trend and reached its target (full target).
Currently, Bitcoin is approaching a support zone ($90,590-$89,310) and is within the Potential Reversal Zone (PRZ) , near the Cumulative Long Liquidation Leverage($89,920-$88,760) and the support line.
From an Elliott Wave perspective, it seems that Bitcoin is completing wave 5, and this wave 5 may conclude within the Potential Reversal Zone (PRZ) .
Additionally, we can observe a positive Regular Divergence between(RD+) two consecutive valleys, indicating potential bullish momentum.
I expect that Bitcoin will experience a short-term bullish move and potentially rise at least to the $91,597. This upward movement could act as a pullback to the broken support lines.
First Target: $91,597
Second Target: Cumulative Short Liquidation Leverage($92,630-$91,988)
Stop Loss(SL): $89,117(Worst)
New CME gap: $93,060-$92,940
CME gap: $88,720-$88,120
Cumulative Short Liquidation Leverage: $94,389-$93,325
What’s your view on Bitcoin?
💡 Please respect each other's opinions and express agreement or disagreement politely.
📌Bitcoin Analysis (BTCUSDT), 1-hour time frame.
🛑 Always set a Stop Loss(SL) for every position you open.
✅ This is just my idea; I’d love to see your thoughts too!
🔥 If you find it helpful, please BOOST this post and share it with your friends.

$MSTR counter trend bounce?NASDAQ:MSTR has finally broken out of it's bottoming structure and looks set for a counter trend rally.
If we can break above $200, then there's little resistance above.
I think the highest probability is that we see $263-272 before the bounce is over so that we fill the gaps left from the move down.
There's one gap at $205 and another at $258.
I think if btc can rally into $103k-112k, that MSTR will sharply follow to the upper resistance levels.
I do not think we'll break the upper blue trend line. Then I think we'll see continuation to the downside to one of the two lower $100 range targets.
Let's see how it plays out.

BTC/USDT 1D Chart Review📉 MARKET STRUCTURE
The price is moving within an ascending channel, but:
The last candle is a strong rejection of the upper levels.
We have a clear downward impulse from the ~97.6k area.
The price is currently testing the lower line of the ascending channel.
➡️ Short-term trend: correction / weakness.
➡️ Medium-term trend: still up, BUT at risk.
🔑 KEY LEVELS
🟢 RESISTANCES
97,642 – local high / strong rejection.
94,465 – 94,400 – zone from which the downward impulse occurred.
👉 After a downward breakout, it now acts as resistance.
🟡 DECISION ZONE
92,370 – 93,400
The price is currently below.
A return above this zone = a chance for continuation. Channel
🔴 SUPPORT
89,500 – 88,960 – a very important zone
local demand
currently being tested
84,411 – key structural support
80,710 – the last line of defense of the uptrend
📊 STOCH RSI
strongly downward
no bullish divergence
there is still room for further decline
➡️ momentum = bearish
🧠 SCENARIOS
🟥 SCENARIO 1 (more likely)
Continuation of correction
Loss of 89,000
Descent to:
84,400
and with panic even 80,700
➡️ Healthy correction in the uptrend
🟩 SCENARIO 2 (less likely) (likely)
Defense of the lower channel line
Demand reaction to 88.9k – 89.5k
Return above 92.3k
Retest 94.4k
➡️ Requires strong volume (not visible yet)
🎯 WHAT IS KEY NOW
Close of the daily candle
Price reaction to:
88.9k
Ascending channel line

Bitcoin (BTCUSDT) – Trading Plan for Today | Jan 20 Bitcoin (BTCUSDT) – Trading Plan for Today | Jan 20
The market opened and accepted below the key daily level at 92,662.3,
which is also located below the previous period’s Point of Control.
This defines a bearish daily context.
At the moment, price is trading near the daily reverse zone at 90,760 – 89,788,
where a potential buyer reaction may develop.
Local scenario: LONG from the reverse zone
Primary scenario:
– waiting for price reaction from 90,760 – 89,788
– corrective upside rotation
Target on reaction:
– return toward the daily zone (Day) at 91,590 – 92,090
Alternative scenario (bearish continuation)
If price accepts and holds below the daily reverse zone at 89,788,
the bearish context remains valid with continuation to the downside.
All trading decisions are based strictly on price reaction and confirmation.
No guessing — the market defines direction.
If you found this idea useful, support it with a 🚀 and follow.
Not financial advice. Always manage risk.

Bitcoin's Santa Claus Rally-January ForecastAfter studying historical cycles I have found some striking similarities. I Hope this helps some traders through these uncertain times.
I believe there will be a couple more attempts to break that upper trend line this week before and after Christmas giving up a couple of short-term trading opportunities from current levels.
History has proven that 80% of the time, Bitcoin will post its monthly high within the first 12 days of the month. With that being said, I think we finally breakout of that upper trend line and start an extended rally towards the .382 Fib levels (or higher) by the middle of January before ultimately falling lower and finishing the second half of this bear cycle. (This would also complete the right shoulder of the head and shoulders formation on larger time frame charts)
I am a buyer at 86k levels and a seller above 92k levels until the end of January. Then I am short.
Tell me what you think and I hope this helps some folks that are currently having a hard time finding clarity in this market.
If my ideas are received well and produce positive results, I will continue sharing them in the future. Thank you for your feedback and I hope everyone has a happy holiday season! Merry Christmas and Happy New Year!!!

XMR +150% Since Last Analysis | Key Levels to WatchMonero (XMR) has delivered a strong performance, rallying over +150% since our last published idea. This momentum reflects growing demand for privacy-focused assets and resilience in the altcoin sector, even as broader market sentiment remains mixed.
That said, we’re closely watching Bitcoin’s structure — continued BTC weakness could trigger a pullback in XMR. Any sustained drop in BTC may weigh on alts and send XMR back toward lower support zones before the next bullish leg.
📌 Trade Setup
Entry Zone: $480 – $501
Targets: $555 / $605 / $690
Stop Loss: $438
Maintain a disciplined approach and adjust risk management according to broader market conditions. Monitoring BTC price action will be crucial here.

ETH — Price Slice. Capital Sector. 3048.15 BPC 22🏷 ETH — Price Slice. Capital Sector.
TradingView Publication Date: 17.01.2026
🏷 3048.15 — price not yet reached at time of publication.
🏷 BPC — The Bolzen Price Covenant — Strength Index: 22
Quantum structure of obligations and capital flow in price formation via energy blocks.
🏷 Vertical chart — Energy Grid Dashboard.
🏷 Static Stream 1: price published in energy-block production sequence.
🏷 The price energy block is already ordered—not by time, but by execution priority. Crucially: block priority dynamically reconfigures in response to hidden energetic impulses, whereas price execution order records their market manifestation. Every price in the dynamic stream is tied to proprietary energy-production metrics inaccessible to the general public. Those who perceive structure before its manifestation do not follow price—they anticipate it.
EΞ2Φ8Ψ45Θ·ζ⁻¹·106Λ732·Ω²
📎 Screenshot:
🏷 When trading from levels, use liquidity zones from BPC 10 and above.
🏷 Bolzen Liquidity Map — ETH (numerical equivalent):
🏷 I. Interactive Reference Guide: BPC — The Bolzen Price Covenant
🏷 P.S. English is not my native language — I offer no apologies for stylistic imperfections. What you see here is not a post. It is a demonstration of another level of preparation: the symbiosis of human intuition and algorithmic precision. Mathematics and aggressive market analysis — against the machine of liquidations.
The persistent ETH and BTC Energy Grid Dashboard remains publicly accessible and is intended for international institutional review.
Dear international community,
I extend my gratitude to the TradingView moderation team for their impartiality and support of analytical work at the global level, as well as to all who follow my research. This platform serves as a space to demonstrate contributions to the advancement of market analytics.
Attention and time are your most valuable resources. ATH is emotion; timeframes are your truest allies. Thank you.
— The Architect
BPC — The Bolzen Price Covenant

Bitcoin Liquidity Roadmap (8H)Bitcoin Liquidity Roadmap – Market Maker Liquidity Sweep & Bearish Bias
Market makers have created a well-defined zone to accumulate liquidity from both buyers and sellers. On the chart, we have clearly marked the liquidity areas, which essentially act as liquidity pools that market makers target.
Liquidity Pools & Sweep Zones
Two liquidity pools above price have already been swept, indicating that the market has absorbed buy-side liquidity. Following this sweep, the price has reached a strong supply zone and the trendline support has been broken. This combination is a powerful bearish signal, especially when confirmed by a structural breakdown.
Daily Timeframe: Bearish Trend Confirmation
It is also important to analyze the trend on the daily timeframe and lower. We need to determine whether the market is in a bullish or bearish phase. From the ATH (All-Time High) until now, Bitcoin has been dropping continuously without a meaningful recovery, which suggests that the daily and lower timeframes are currently bearish.
Current Market Scenario: Sweeping Lower Liquidity Pools
Right now, Bitcoin is attempting to sweep two lower liquidity pools after having already swept the two higher ones. This implies a continuation of the market maker liquidity hunt, and the current structure is clearly favoring sellers.
CME Gap: 88K Level
Additionally, we know there is a CME gap around the 88K level, which often acts as a magnet for price action in the medium term. This gap increases the likelihood of downward continuation if sellers remain in control.
All Signs Point to Sellers
At this moment, all technical signals are aligning in favor of the bearish side. The market structure, liquidity sweep, trendline break, and daily bearish bias all suggest further downside potential.
Entry Strategy: DCA (Dollar-Cost Averaging)
We have identified two entry zones for short positions. The best approach is to enter using DCA to minimize risk and maximize position efficiency. This allows traders to build a position gradually rather than risking a single entry at a potentially unfavorable level.
Invalidating the Analysis
This bearish outlook will be invalidated if Bitcoin closes a daily candle above the liquidation invalidation level. A daily close above this level would break the bearish structure and signal a possible trend reversal or a shift in market sentiment.
invalidation level: 97300$
If you would like us to analyze a coin or altcoin for you, first like this post, then comment the name of your altcoin below.

ETH — Price Slice. Capital Sector. 3060.99 BPC 11 © Bolzen | The Architect | BPC Framework
Bolzen Market Institute
🏷 ETH — Price Slice. Capital Sector.
TradingView Publication Date: 20.01.2026
🏷 3060.99 — price not yet reached at time of publication.
🏷 BPC — The Bolzen Price Covenant — Strength Index: 11
Quantum structure of obligations and capital flow in price formation via energy blocks.
🏷 Vertical chart — Energy Grid Dashboard.
🏷 Static Stream 1: price published in energy-block production sequence.
🏷 The price energy block is already ordered—not by time, but by execution priority. Crucially: block priority dynamically reconfigures in response to hidden energetic impulses, whereas price execution order records their market manifestation. Every price in the dynamic stream is tied to proprietary energy-production metrics inaccessible to the general public. Those who perceive structure before its manifestation do not follow price—they anticipate it.
EΞ2Φ8Ψ45Θ·ζ⁻¹·106Λ732·Ω²
📎 Screenshot:
🏷 When trading from levels, use liquidity zones from BPC 10 and above.
🏷 Bolzen Liquidity Map — ETH (numerical equivalent):
🏷 I. Interactive Reference Guide: BPC — The Bolzen Price Covenant
🏷 P.S. English is not my native language — I offer no apologies for stylistic imperfections. What you see here is not a post. It is a demonstration of another level of preparation: the symbiosis of human intuition and algorithmic precision. Mathematics and aggressive market analysis — against the machine of liquidations.
The persistent ETH and BTC Energy Grid Dashboard remains publicly accessible and is intended for international institutional review.
Dear international community,
I extend my gratitude to the TradingView moderation team for their impartiality and support of analytical work at the global level, as well as to all who follow my research. This platform serves as a space to demonstrate contributions to the advancement of market analytics.
Attention and time are your most valuable resources. ATH is emotion; timeframes are your truest allies. Thank you.
— The Architect
BPC — The Bolzen Price Covenant

ETH — Price Slice. Capital Sector. 3067.57 BPC 7.7© Bolzen | The Architect | BPC Framework
Bolzen Market Institute
🏷 ETH — Price Slice. Capital Sector.
TradingView Publication Date: 17.01.2026
🏷 3067.57 — price not yet reached at time of publication.
🏷 BPC — The Bolzen Price Covenant — Strength Index: 7.7
Quantum structure of obligations and capital flow in price formation via energy blocks.
🏷 Vertical chart — Energy Grid Dashboard.
🏷 Static Stream 1: price published in energy-block production sequence.
🏷 The price energy block is already ordered—not by time, but by execution priority. Crucially: block priority dynamically reconfigures in response to hidden energetic impulses, whereas price execution order records their market manifestation. Every price in the dynamic stream is tied to proprietary energy-production metrics inaccessible to the general public. Those who perceive structure before its manifestation do not follow price—they anticipate it.
EΞ2Φ8Ψ45Θ·ζ⁻¹·106Λ732·Ω²
📎 Screenshot:
🏷 When trading from levels, use liquidity zones from BPC 10 and above.
🏷 Bolzen Liquidity Map — ETH (numerical equivalent):
🏷 I. Interactive Reference Guide: BPC — The Bolzen Price Covenant
🏷 P.S. English is not my native language — I offer no apologies for stylistic imperfections. What you see here is not a post. It is a demonstration of another level of preparation: the symbiosis of human intuition and algorithmic precision. Mathematics and aggressive market analysis — against the machine of liquidations.
The persistent ETH and BTC Energy Grid Dashboard remains publicly accessible and is intended for international institutional review.
Dear international community,
I extend my gratitude to the TradingView moderation team for their impartiality and support of analytical work at the global level, as well as to all who follow my research. This platform serves as a space to demonstrate contributions to the advancement of market analytics.
Attention and time are your most valuable resources. ATH is emotion; timeframes are your truest allies. Thank you.
— The Architect
BPC — The Bolzen Price Covenant

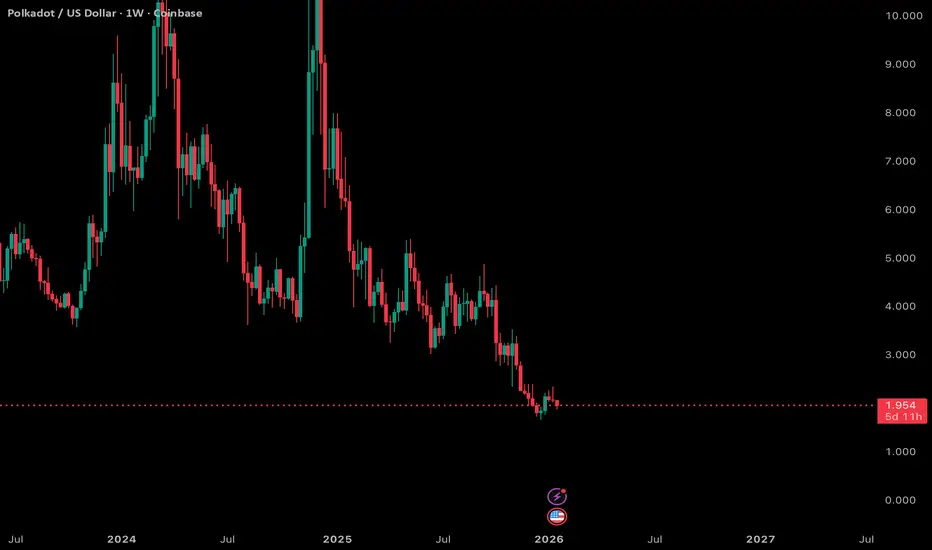
1W Polkadot (DOT): Full updates & thoughts on the chain Technical situation (chart)
On the weekly, DOT is still struggling to show sustainable strength. Price continues to sit near the low end of the range around ~2.0, failing to make meaningful higher highs or clear range expansion. This looks like more consolidation and distribution pressure rather than a clean breakout, and recent candles confirm a bearish tone with lower peaks and no strong follow-through. Price action is choppy and defensive, reflecting weak conviction from buyers.
Regarding upgrades and fundamentals
Polkadot has a long roadmap of structural upgrades that are intended to boost the network’s utility and developer appeal. The ecosystem is transitioning to Polkadot 2.0 with features like Agile Coretime, Async Backing, and Elastic Scaling fully rolling out, which are designed to improve performance and flexibility for parachains. A hard cap on DOT supply and stepped-down issuance is also being introduced starting in 2026, reducing inflation over time. Smart contract support and increased Ethereum compatibility are targeted, potentially lowering friction for dApp developers and deployment.
CoinMarketCap
+1
Additionally, the Join-Accumulate Machine (JAM) architecture and new identity (“Individuality”) tooling are part of the broader 2026 roadmap, making Polkadot more scalable and feature-rich.
CoinMarketCap
There are also ecosystem developments like bridges (e.g., Hyperbridge enabling multi-chain connectivity) and improvements to developer tooling, which bolster long-term fundamentals.
Wikipedia
So what does that mean right now?
I looked at the chart through the lens of these upcoming upgrades to see whether news flow is already reflected in price. The short answer: not really — at least not yet. Despite strong on-chain activity and a clear roadmap, DOT price has been weak and range-bound. In fact, it’s down significantly over the past year even as the protocol continues to build out features.
Nasdaq
This divergence between fundamentals and price action is typical in environments where upgrades are slow to translate into actual adoption and utility — especially when broader market sentiment is range-bound or bearish for altcoins.
Overall take
From a technical perspective, DOT looks a bit bearish and indecisive right now, trapped at lows with no clear breakout structure. The long-term fundamental backdrop (protocol upgrades, supply cap, smart contract support) is constructive, but price isn’t yet reflecting that optimism. It’s a classic case of tech building ahead of price action, and until the market starts valuing those upgrades — likely via adoption, volume growth, or real activity metrics — the chart remains choppy and tilted bearish near current levels.
BTCUSD Time for LONG1h - bullish divergence
4h - hidden bullish divergence
15m - new low with US open and than it could star the bullrun on 15m
Target for this movement will be 93k
Stay profitable !

BTC — NPOC 90680.38Price held at the NPOC, and activity remained low.
Market data behavior observation.
No prediction. No instruction.
Danel Fadejev
CORE5 Tradecraft

GBPUSD BULLISH MOVEGBPUSD is developing a bullish reversal setup after compressing inside a falling wedge structure, with price now breaking above the upper trendline and signaling a shift in short-term momentum. This type of breakout typically reflects seller exhaustion and increasing buying pressure, especially when it aligns with improving market sentiment. Fundamentally, the British pound is finding support from stabilizing UK economic data and expectations that the Bank of England will remain cautious on aggressive rate cuts, while the US dollar is facing pressure from softer yield expectations and a more balanced Federal Reserve outlook. As long as price holds above the broken wedge resistance and maintains higher lows, continuation toward upside liquidity zones becomes the higher probability scenario, offering a favorable trend-following opportunity with strong risk-to-reward aligned with structure, momentum, and current macro flows.

USDCAD NEXT MOVEUSDCAD is showing a clear bearish continuation setup after losing a key demand zone that previously acted as strong support, now confirmed as a valid breakout area. Price rejection from this zone signals a shift in market structure, with sellers firmly in control and momentum aligning to the downside on the 4H timeframe. From a fundamental perspective, Canadian dollar strength is being supported by stable crude oil prices and relatively resilient domestic data, while the US dollar is facing pressure from expectations of softer monetary policy and cooling inflation outlook, creating a favorable environment for further downside in USDCAD. As long as price remains below the broken support zone, downside continuation toward lower liquidity levels remains the higher probability scenario, offering a clean risk-to-reward opportunity in line with trend, structure, and macro-driven flows.

$USDT Dominance Breakout + RetestThis CRYPTOCAP:USDT dominance weekly chart honestly looks bullish, and that’s kinda bad news for the crypto market.
If this move is a true breakout + retest, then the follow-through expansion isn’t a great sign for Bitcoin. It’s the kind of structure you see when risk-off starts creeping in and liquidity shifts away from crypto.
The 6% zone is the key level I’m watching here. It already flipped into support, and as long as it holds as a base, it keeps the higher timeframe trend intact.
If we continue building above it, I think the next big move is CRYPTOCAP:BTC running liquidity and sweeping the 80k low.

Be careful! BITCOIN is showing bearish signals (4H)Looking at the sharp and aggressive reaction to the sellers’ order zones, we can anticipate further downside pressure as more sellers are likely to enter the market. What we’re seeing here is a classic move by market makers: they are creating FOMO in the market by forming bullish momentum candles, which psychologically convinces many traders that this is just a minor correction or a temporary pullback. However, despite these bullish signals on the lower timeframes, there is a strong possibility that the price could experience deeper drops.
On higher timeframes, Bitcoin still exhibits a bearish structure. The most recent upward leg was quickly rejected, indicating that the bullish momentum is weak and unsustainable for a long-term uptrend. This is a crucial observation because it suggests that continuing the bullish narrative here could be misleading. Our goal is not to work for the market makers or to fill their orders; instead, we want to maintain our analysis in alignment with the true market direction, avoiding traps and false signals.
We have identified two specific entry points for initiating a short position. To manage risk effectively, it’s recommended to enter these positions using a DCA (Dollar-Cost Averaging) approach, rather than committing a full position at a single level. This allows us to scale in and reduce exposure in case of temporary pullbacks.
Our target area is highlighted as the green box on the chart. It represents a logical support zone where profit-taking could occur. Importantly, this bearish scenario will be invalidated if a daily candle closes above the invalidation level, as this would negate the short-term bearish structure and suggest renewed bullish momentum.
In summary, while short-term bullish-looking candles may create the illusion of a correction, the overall structure on higher timeframes still favors the downside. Patience and proper position sizing are key traders should avoid chasing the market and instead stick to the plan of scaling into short positions at the identified entry points while keeping an eye on the invalidation level for risk management.
If you have a coin or altcoin you want analyzed, first hit the like button and then comment its name so I can review it for you.
This is not a trade setup, as it has no precise stop-loss, stop, or target. I do not publish my trade setups here.

Coinranger| BTCUSDT. Pullback to 93720 and continued decline🔥News
🔹The International Economic Forum in Davos begins today and will continue all week. America is closed for M. Luther King Day. No other significant news.
🔥BTC
🔹Finally fell to the target levels last night. New:
1️⃣ I've only calculated potential pullback levels so far above: 94590 and 93720. These are all pullbacks on the H1 timeframe. They are the most likely in the near future.
2️⃣ Below we have H1 target levels: 91970, 89500, and 87600. Between them, there are intermediate levels on the M15: 90970 and 89500.
For now, the pullback is the priority; the most likely level is 93720.
-------------------
Share your opinion in the comments.

BTC Breaks Structure — Dead Cat Bounce or Demand Reaction?Bitcoin has just broken down decisively from the descending trendline and EMA cluster, confirming a short-term bearish shift after prolonged compression. The impulsive sell-off signals distribution resolution, not random volatility, as price sliced through prior balance with strong momentum. BTC is now reacting inside a key support zone around 91,800–92,200, where short-term buyers are attempting to absorb sell pressure. A technical bounce from this area is possible, but as long as price remains below 94,200–94,500 (former support turned resistance), any upside should be treated as corrective. A clean rejection from the trendline retest would likely trigger another leg lower, targeting 90,900–91,000, aligning with the next liquidity pocket.
Only a reclaim and hold above 94,500 would invalidate the bearish continuation scenario and reopen upside rotation.
➡️ Bias: Short-term bearish, watching for reaction vs rejection at demand.
