TradersCity Pro | LINK Eyes Fresh Rally From Critical Support👋 Welcome to TradeCity Pro!
In this analysis, I’m going to review LINK, one of the RWA coins with a market cap of $16.41 billion, currently ranked 12th.
📅 Daily Timeframe
On the daily chart, after getting support around 11.55, LINK started an upward move and in its first wave rallied up to 26.73.
✔️ After reaching this zone, volume began to decline and a short correction formed down to the 0.236 Fibonacci level.
⭐ This area is also an important support zone that overlaps with a PRZ (Potential Reversal Zone) at the Fibonacci level, meaning the price could start its next bullish wave if it holds this floor.
🔍 If a deeper correction occurs, price could extend down to the 0.382 or 0.5 Fibonacci levels. Naturally, the deeper the correction, the weaker buyers’ strength becomes.
🎲 For long positions, if the price holds these key zones or breaks above 26.73, we can look for entries. The main confirmation of a bullish continuation will be a clean breakout of 26.73.
📝 Final Thoughts
Stay calm, trade wisely, and let's capture the market's best opportunities!
This analysis reflects our opinions and is not financial advice.
Share your thoughts in the comments, and don’t forget to share this analysis with your friends! ❤️
BTC-M

$HEMI long idea coin I'm seeing another good move forming inside $HEMI coin. It could deliver another 30 to 50 percent gain, but the entry zone here is quite wide. you can enter with low leverage if you manage your risk properly. am in the trade with 8x lev

BE AWARE OF 118K BTC REVERSALMorning folks,
here is just a light update on situation. BTC now stands at 118K resistance area and here it could either to keep going higher, or, start forming the right arm of our bigger H&S pattern.
Just watch for signs of reversal, say H&S pattern here is possible. Depending on what you want to do - either wait (if you bullish) or you could use it (bearish).

BTC: Fed Fuel Ignites the Next Leg UpBTC's coiling like a spring between $116.5k support and $118.5k resistance, with smart money reloading post-rate cut while retail chases shadows. The Fed's 25bps trim is the cheat code here—liquidity's flowing, on-chain whales are backing the truck, and technicals scream bounce to $119k as DXY dips.
Entry zone: $117k-$117.5k for that low-risk long. TP1 at $118.5k (quick scalp), TP2 $119.5k if momentum sticks. SL tight at $116.5k to avoid the flush.
This setup's classic: Crowd's neutral-greedy, but we're thinking like institutions—patience shakes out the weak hands before the real move. Don't FOMO the chop; scoop the dip.

BTCUSD H1 | Bearish reversal at key resistanceBitcoin (BTC/USD) has rejected off the sell entry at 117,876.74, which is an overlap resistance and could drop from this level to the downside.
Stop loss is at 119,057.60, which is an overlap reistance that aligns withthe 161.8% Fibonacci extension.
Take profit is at 115,962.51, which is a pullback support that aligns with the 61.8% Fibonacci retracement.
High Risk Investment Warning
Trading Forex/CFDs on margin carries a high level of risk and may not be suitable for all investors. Leverage can work against you.
Stratos Markets Limited (tradu.com ):
CFDs are complex instruments and come with a high risk of losing money rapidly due to leverage. 65% of retail investor accounts lose money when trading CFDs with this provider. You should consider whether you understand how CFDs work and whether you can afford to take the high risk of losing your money.
Stratos Europe Ltd (tradu.com ):
CFDs are complex instruments and come with a high risk of losing money rapidly due to leverage. 66% of retail investor accounts lose money when trading CFDs with this provider. You should consider whether you understand how CFDs work and whether you can afford to take the high risk of losing your money.
Stratos Global LLC (tradu.com ):
Losses can exceed deposits.
Please be advised that the information presented on TradingView is provided to Tradu (‘Company’, ‘we’) by a third-party provider (‘TFA Global Pte Ltd’). Please be reminded that you are solely responsible for the trading decisions on your account. There is a very high degree of risk involved in trading. Any information and/or content is intended entirely for research, educational and informational purposes only and does not constitute investment or consultation advice or investment strategy. The information is not tailored to the investment needs of any specific person and therefore does not involve a consideration of any of the investment objectives, financial situation or needs of any viewer that may receive it. Kindly also note that past performance is not a reliable indicator of future results. Actual results may differ materially from those anticipated in forward-looking or past performance statements. We assume no liability as to the accuracy or completeness of any of the information and/or content provided herein and the Company cannot be held responsible for any omission, mistake nor for any loss or damage including without limitation to any loss of profit which may arise from reliance on any information supplied by TFA Global Pte Ltd.
The speaker(s) is neither an employee, agent nor representative of Tradu and is therefore acting independently. The opinions given are their own, constitute general market commentary, and do not constitute the opinion or advice of Tradu or any form of personal or investment advice. Tradu neither endorses nor guarantees offerings of third-party speakers, nor is Tradu responsible for the content, veracity or opinions of third-party speakers, presenters or participants.

$BTC - Post-OPEX Dip OPEX in one day! Expecting a sweep of 118-120k!
Bitcoin often drops after large options expiries (OPEX) because of market positioning and hedging flows.
It’s common when open interest is large and skewed in a way that pressures the market once contracts roll off.
Curious if we’ll see a post-OPEX dip for a higher low?

Volatility Period: Around September 19th (September 18th-20th)
Hello, traders!
Follow us to get the latest information quickly.
Have a great day!
-------------------------------------
(BTCUSDT 1D Chart)
This volatility period is around September 19th (September 18th-20th).
As this period of volatility progresses, we need to examine the direction in which the price deviates from the 115,854.56-119,177.56 range.
As previously mentioned, the key ranges are 87,814.27-93,570.28 and 104,463.99-108,353.0.
Therefore, if the price falls below 115,854.56, we need to check for support near these key levels.
-
It's perhaps natural for trading volume to decrease after a new ATH (Any New High).
If a new ATH (Any New High) is met with high trading volume, it could indicate a significant amount of profit-taking, increasing the likelihood of a downward trend.
Therefore, I don't think it's wise to interpret the current decline in trading volume as a sign of a decline.
We're using the On-By-Volume (OBV) indicator, which helps us understand the movement of trading volume, so we can roughly gauge the current trading volume trend.
-
The HA-High ~ DOM(60) range on the 1D chart is 115854.56-119177.56, and the HA-High ~ DOM(60) range on the 1W chart is 116259.91-119086.64.
Since these two resistance levels overlap, a breakout above this level suggests a potential surge.
-
Thank you for reading to the end.
We wish you successful trading.
--------------------------------------------------
- This is an explanation of the big picture.
(3-year bull market, 1-year bear market pattern)
I will explain in more detail when the bear market begins.
------------------------------------------------------

JTO has formed a bullish double bottom📊 CRYPTOCAP:JTO Market Update
CRYPTOCAP:JTO has formed a bullish double bottom 📈
👉 If it breaks out the red resistance zone 🔴, the first target will be the green line level 🎯

REQ Market Update📊 $REQ Market Update
$REQ has formed an ascending triangle 🔺 and already broke out ✅
👉 Next steps:
First target: blue line level 🎯
Second target: higher blue line level 🎯
👉 If buyers keep pushing, price could continue its bullish move 🚀
⚡ Manage your trade — trail stop-loss as price moves.

WLD Market Update📊 MIL:WLD Market Update
After an uptrend, MIL:WLD is now retracing 📉
👉 If the price keeps dropping to the green support zone 🟢, it could bounce up from there.
This level is where buyers previously accumulated and may push price up again with confirmation ✅
⚡ Be patient — wait for confirmation before entering.

Bitcoin BTC price analysis FOMC Fed rate🚀 CRYPTOCAP:BTC price is rising, while altcoins remain silent.
What happens tomorrow when the Fed announces its new rate? 🤔
📊 Expectations:
98% believe in a -0.25% cut
2% expect -0.5%
and no one believes it will stay unchanged at 4.5%
That’s why the market has already priced this in. But tomorrow, once the official decision comes — everything could flip ⚡️
📉 The chart looks like chaos to most, but a "trained eye" sees harmony: candles moving level to level.
🔑 Key zones for OKX:BTCUSDT :
Upper channel boundary: $117,800 – $118,000 (only breakable on massive volumes).
September is statistically weak. It opened at $108K, that’s the “zero point”. Logical scenario — dip to $102K.
😬 Worse scenarios:
$96,500
GAP close at $91,600 (but you’ll roast us for this one 😂).
❓Your take: By the end of September, will #Bitcoin be above $108K or below?
______________
◆ Follow us ❤️ for daily crypto insights & updates!
🚀 Don’t miss out on important market moves
🧠 DYOR | This is not financial advice, just thinking out loud.

HBAR ANALYSIS📊 #HBAR Analysis
✅There is a formation of Falling Wedge Pattern on 4HR chart with a breakout and currently trading above its major support area🧐
Pattern signals potential bullish movement incoming in few days
👀Current Price: $0.2385
🚀 Target Price: $0.2780
⚡️What to do ?
👀Keep an eye on #HBAR price action and volume. We can trade according to the chart and make some profits⚡️⚡️
#HBAR #Cryptocurrency #TechnicalAnalysis #DYOR

You will ask yourself "how did he know Btc would do that"?On Aug 8th I suggested that based on my research of historical data, Btc would bottom as low as 107K. Btc bottomed at 107...and I then suggested a "bounce incoming".
On Sept 2nd I suggested that Btc had hit a bottom and was about to bounce into 1 of my three targets within 2 weeks. We are at the end of that 2 week period and T1 and T2 have been hit.
Question remains where do we go from here?
The 3 week down rule suggests that we form a lower low (below 107K). Will today's Fed meeting be the excuse for that pattern to play out?
What are your thoughts? I'd like to hear from you to gauge sentiment.

BITCOIN NEXT MOVE REVEALED!!!!! (this will make you scream) Yello Paradisers! In this video, we went through multiple timeframes as professional traders. We assumed things to analyze in Elliott Wave and other important indicators and advanced technical analysis tools. What's the next movement going to be with the highest probability!
Paradisers! Keep in mind to trade only with a proper professional trading strategy. Wait for confirmations. Play with tactics. This is the only way you can be long-term profitable.
Remember, don’t trade without confirmations. Wait for them before creating a trade. Be disciplined, patient, and emotionally controlled. Only trade the highest probability setups with the greatest risk to reward ratio. This will ensure that you become a long-term profitable professional trader.
Don't be a gambler. Don't try to get rich quick. Make sure that your trading is professionally based on proper strategies and trade tactics.

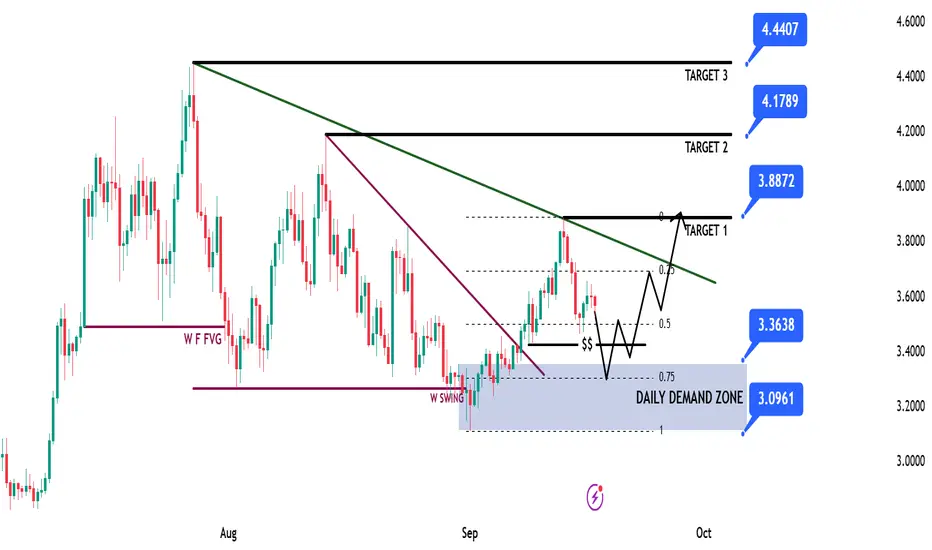
SUI Game Plan - Suinetwork📊 Market Sentiment
Market sentiment remains strongly bullish as the FED is expected to deliver a 0.25% rate cut, with speculation building for a possible 0.5% cut in September. Monetary policy shifts are being driven by both inflation trends and weakening labor market data. The latest August and September job reports were soft, signaling that the economy is cooling rapidly. This environment continues to fuel expectations for a major bullish run in the weeks ahead.
📈 Technical Analysis
Price is on HTF bullish trend so we will be looking only long setups.
Price ran HTF liquidity and closed above then broke the market on daily-weekly timeframe, creating the Daily Demand Zone.
Moreover, price broke the bearish trendline and closed above, giving strong upward momentum. Now price is retracing back into the Daily Demand Zone.
📌 Game Plan
1-Price to hit back to Daily Demand Zone
2-Price to hit possibly 0.75 max discount range zone. If not, I’ll still enter with LTF confirmation.
🎯 Setup Trigger
4H break of structure after hitting 3.36$ level. I won’t enter unless I see the 4H BOS.
📋 Trade Management
Stoploss: Below 4H swing low responsible for BOS
Targets:
TP1: 3.88$
TP2: 4.17$
TP3: 4.44$
💬 Like, follow, and comment if you find this setup valuable!
⚠️ Disclaimer: This content is for informational and educational purposes only and does not constitute financial, investment, or trading advice. Always DYOR before making any financial decisions.
For couple years we've said Crypto = StocksWant more proof Crypto = Stocks now?
CRYPTOCAP:TOTAL 3 = NO CRYPTOCAP:BTC or CRYPTOCAP:ETH
This index looks identical to TVC:RUT = Russell 2k
Sorry we don't post much. It's a lot to keep 1 social account, let alone 2 - 3!
Please see our profile for more info.

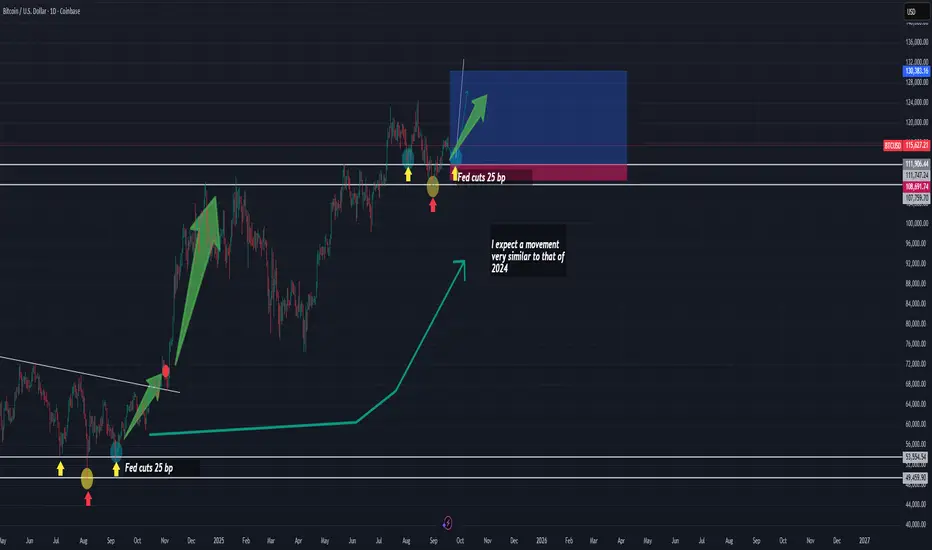
Bitcoin Trade of the Week: Liquidity Rules the MarketOne of the most decisive factors for markets right now is the expansion of liquidity. The growth of global M2 remains evident, particularly in China, where the economy faces a deflationary backdrop that forces authorities to maintain – and even expand – both monetary and fiscal stimulus. Ultimately, these flows permeate global financial markets and, as I’ve explained on several occasions, liquidity is the fuel that drives asset prices.
A Parallel with 2024
What we are observing today shows remarkable similarities with what happened in 2024. Back then, the start of Federal Reserve rate cuts marked a turning point. Even a moderate 25-basis-point cut triggered a rebound that coincided with a technical consolidation phase in Bitcoin, shaped as a descending channel.
Later, in November 2024, when the Fed accelerated the move with a 50-basis-point cut, the result was a much more aggressive bullish impulse.
Today, we find ourselves in an environment with rising probabilities of further cuts in upcoming Fed meetings, which could once again act as a catalyst.
Correlation Context with the Nasdaq 100
Meanwhile, the Nasdaq 100 is printing all-time highs, reflecting the strong risk appetite in tech assets. Bitcoin, in contrast, remains slightly behind its own highs. This divergence can be interpreted as a window of opportunity: if additional liquidity is confirmed through another rate cut, the momentum could spill over into Bitcoin and provide the strength needed to form a technical reversal structure—very similar to the inverted Head and Shoulders (H&S) pattern observed in 2024.
Trading Strategy
Entry Zone: 111,906.44
Stop Loss (SL): 108,607.83
Take Profit (TP): 130,383.16
This is what is going to happen with BTC today, FOMC daMy FOMC-Day Playbook (Trader’s Read)
Probabilities (today)
• Sell-the-news (spike then fade): ~60%
• Mini altseason (ETH leads, large caps follow): ~25%
• BTC bullish continuation after the announcement: ~15% ← my BTC-only continuation probability
Why my odds look like this
• Funding is low → no derivatives euphoria; any rally needs spot demand to sustain.
• Open interest is rising slowly → tape is more spot-led than leverage-led (healthier, but needs follow-through).
• DVOL slightly elevated + 25Δ skew tilted to puts → market is defensive into the headline; easy to fade if spot inflows don’t show.
• ETF volumes are moderate (IBIT/FBTC/ETHA) → by themselves they don’t signal a mega inflow day.
What would push odds toward continuation (BTC or mini-alts)
• 3:50–4:00 ET auctions print big in IBIT/FBTC/ETHA.
• EOD net flows ≥ $300–500M (bonus if ETH also prints strong).
• Post-headline vol crush (DVOL ↓), skew normalizes, funding ≤ 0.01%, OI up gradually (spot-led), and acceptance above resistance.
What would keep/raise sell-the-news risk
• Weak/negative EOD flows.
• Break attempts with funding ≥ 0.03% and OI ramping (crowded longs).
• DVOL ↑ and skew leans further to puts during the spike.
• Repeated rejections near BTC resistance (e.g., ~116–117k) with upper wicks.
1-Minute Checklist (before & after the announcement)
1 Spot vs perps: if spot leads and funding stays low, I prefer buying pullbacks over chasing.
2 DVOL / Skew: DVOL down + skew normalizing ⇒ continuation; DVOL up + skew to puts ⇒ fade more likely.
3 ETFs: watch closing-hour volume today; then confirm EOD net flows tonight:
◦ ≥ $300–500M ⇒ I carry a long/buy-the-dip bias into D+1.
◦ ≤ 0 ⇒ I favor fading resistance into D+1.
Operational stance (how I’ll trade it)
• Base into the headline: cautious. I won’t chase the first candle.
• Fade setup: if the breakout comes with funding/OI spiking and wicks near resistance, I treat it as spike-and-fadeback into the prior range (tight risk).
• Continuation setup: if I see vol crush + strong flows and acceptance above resistance, I flip to continuation mode and buy dips, with invalidation below the most recent reclaimed level.
This is my real-time framework, not financial advice. I’ll update the bias if the auction and EOD flows materially change the picture.

BTC 1H Analysis - Key Triggers Ahead | Day 39👋🏻 Hey everyone! How’s it going? Hope you’re all doing well.
❄️ Welcome to Crypto Winter.
⏰ Today, we’ll be analyzing BTCUSDT and exploring its potential opportunities.
👀 On the 1-hour timeframe for Bitcoin, we observe that after breaking the $116,000 zone, the price moved upward and buyers drove it to the $117,000 level. Then, sellers pushed the price back down to roughly the same level as yesterday. Currently, Bitcoin has two important triggers: one at $116,860 and another at $114,660. With a breakout of these levels, we can take positions more confidently. I don’t have a specific short scenario in mind because long positions, if taken, could continue with the news of interest rate cuts, and we could even add several funding levels to our positions.
🧮 On the RSI, the two critical zones are 70 and 38. If momentum breaks either, Bitcoin could move with much more strength.
🕯 The size and volume of green candles have increased significantly after micro-buyers entered. However, due to the interest rate cut news and upcoming scenarios, this kind of movement and these candles may not continue. One notable point on the chart is that the buying pressure has caused the size, volume, and number of green candles to be smaller, yet they produce larger moves. Our momentum for further upward movement is stronger and more powerful.
🔴 Today’s news could affect Bitcoin’s future price, so try to take a position aligned with the news. Although it seems risky, Bitcoin’s volatility relative to other coins is lower on news days, meaning less risk for traders.
🧠 There are two scenarios for entering a Bitcoin position:
1️⃣ Place a stop-buy at $116,850 to enter when the stop triggers. The stop size would be 2–3%, which is relatively large, delaying risk-to-reward, and there is a chance the scenario fails and the stop is hit.
2️⃣ Wait for a 15-minute candle setup (Indecision + SMA + Low Volume) to enter, allowing a smaller stop at roughly the same level. This still carries the risk of being stopped out quickly.
Risk management is essential — if we follow it today, nothing adverse should happen.
❤️ Disclaimer : This analysis is purely based on my personal opinion and I only trade if the stated triggers are activated .

BTC Eyes 120K but 115K Support is the Last LineCRYPTOCAP:BTC is currently trading around 116K after a strong run-up. The chart shows a rising wedge pattern forming, with immediate support sitting near 115K. If this level holds, BTC could make another push toward the upper resistance zone around 120K.
On the flip side, a breakdown below 115K may trigger a short-term correction, sending price lower before bulls step back in.
Overall, BTC is in a critical zone, holding support keeps the bullish momentum alive, but a rejection at resistance could slow things down.
DYOR, NFA
Stay tuned for more update

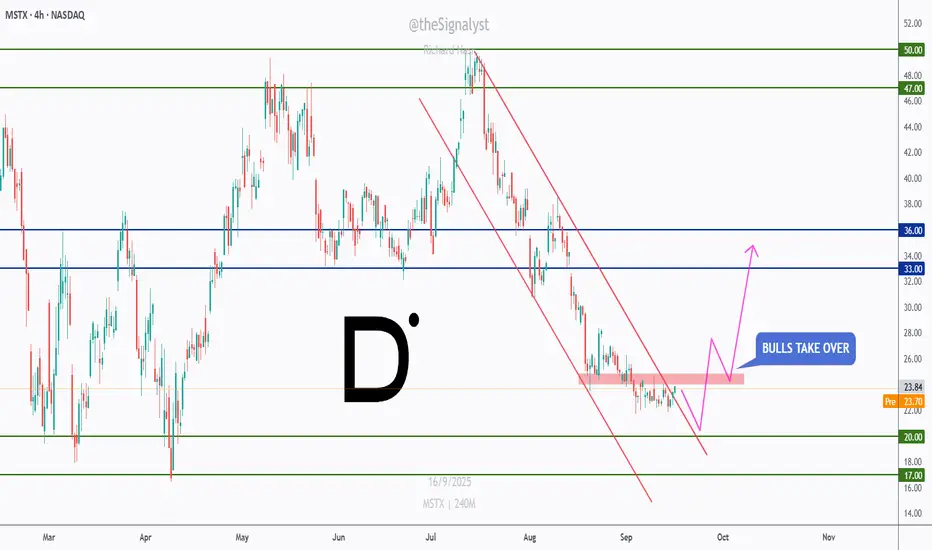
MSTX – Bulls Preparing a Reversal Move!MSTX has been overall bearish 📉, trading inside a well-defined descending channel.
Recently, price approached the $23 – $24 support area, where buyers started showing signs of activity. This zone could act as a potential turning point if momentum continues.
🟢 Support at $23 – $24: A critical level where bulls may step in.
📈 Upside targets: If buyers take over, the first resistance sits around $33, followed by $36 and higher toward $47 – $50.
As long as $23 support holds, bulls 🐂 could drive a short-term reversal that turns into a bigger recovery move.
Patience ⏳ is key — waiting for confirmation before entering can provide a higher-probability setup.
⚠️ Disclaimer: This is not financial advice. Always do your own research and manage risk properly.
📚 Stick to your trading plan regarding entries, risk, and management.
Good luck!
All Strategies Are Good; If Managed Properly!
~Richard Nasr
BTC – Between Structure and Supply!BTC has been trading inside a clean ascending channel 📈, respecting both support and resistance.
After breaking above the $113,000 structure zone, price pushed higher but is now approaching a potential retest area.
🟠 Structure zone ($113K – $114K): Could act as support on a pullback.
🟢 Channel support: Aligns perfectly with structure for confluence.
🔵 Supply zone ($122K – $124K): Next major resistance where sellers may step in.
As long as BTC holds above structure, bulls 🐂 remain in control, with the next upside target sitting around the supply zone.
Patience ⏳ is key — waiting for a clean retest could set up the next continuation trade.
⚠️ Disclaimer: This is not financial advice. Always do your own research and manage risk properly.
📚 Stick to your trading plan regarding entry, risk, and management.
Good luck!
All Strategies Are Good; If Managed Properly!
~Richard Nasr

XRPUSD → Will the rate meeting be a bullish driver for altcoins?BINANCE:XRPUSDT.P is consolidating above the previously broken boundary of the descending triangle formed within the bullish trend. Important news is ahead—the Fed's meeting on interest rates, which is highly likely to become a bullish driver for the cryptocurrency market.
The daily structure of the XRP market looks promising. The price is not updating global lows, is staying within the boundaries of the uptrend, and at the same time is breaking through the resistance of the downward correction, trying to consolidate above the fairly strong support level of 2.9535. But the market is waiting for a driver, namely fundamental background. If this background strengthens after Powell's speech, Bitcoin and altcoins may strengthen, including XRP. However, the fundamental background largely depends on the overall mood of the Fed and its comments. The market has already priced in an interest rate cut, as this is predictable given the economic data. But traders will be watching Powell's tone and how dovish or hawkish his view of the situation is.
Support levels: 2.9535, 2.8853
Resistance levels: 3.0577, 3.155, 3.359
Technically, at the moment, I am considering a scenario of a retest of support and the formation of a long squeeze at 2.9535 - 2.8853 against the backdrop of increased news volatility (manipulative nature). However, if this does not happen, the focus will be on 3.0577, and a close above this level could trigger further growth.
Best regards, R. Linda!
