THE 4-YEAR CYCLE WILL NEVER ENDTHE 4-YEAR CYCLE WILL NEVER END.
As I’ve said many times before, I now think this cycle will push into late January / February 2026, similar to 2017.
As I’ve written extensively about, the macro setup is nearly identical to 2017.
Read that here.
The funny thing is, when we do push into early Q1 ‘26, all your favorite “influencers” will proclaim “this time is different”, because most weren’t here during the 2017 cycle or before.
There is ZERO EVIDENCE that the 4-year cycle is dead.
Since the GFC in 2008, the Fed was redesigned for these boom and bust cycles to counter inflation and unemployment.
At this point, unless the US completely dismantles the Fed, the 4-year cycle will live on in perpetuity. We see the effect of this on TradFi as well.
See the comparison here.
The Fed is set to cut interest rates for the first time in a year at tomorrow’s FOMC. This is a liquidity positive catalyst for markets.
The next ISM PMI print on October 1st should be ~50, which will be the start of the business cycle.
That would give us ~5 months of a surging business cycle, which will pump risk assets to VALHALLA.
BTC-M

Bitcoin next leg up coming.The major Bitcoin rally will resume from where it left off after a healthy pullback.

BTCUSD 4H chart short-term1. Trendline breakthrough
• In the chart you have a drawn orange relegation line (downward trend).
• The current candle struck above this line, which is the first signal of a change of sentiment from short -term inheritance to more bullshit.
2. Horizers of support and resistance
• Support:
• USD 115,426
• 114,487 USD (below, strong support, where price reactions can be seen)
• Resistance:
• 116,826 USD (the price came there)
• 117,717 USD (next resistance - an important destination point, if the moment is maintained).
3. Volume
• The last candles have a growing volume when struck. This is healthy, confirms that breaking from Trendline is not "empty".
4. STOCHASTIC RSI (below)
• You can see a dynamic break from the level of sale (<20) in the direction of 60+.
• This is a signal of growth, but note: the indicator begins to enter the purchase zone. A correction may appear in the short term.
5.
• Long (aggressive): entry around the retestation around 116k as support, target ~ 117.7k, SL below 115.4k.
• Short (versus): If the price rejects 116.8-117K and returns below 116k, you can consider Shorta with Target 115.4k → 114.5k.

BITCOIN 1W Stoch RSI completed a Bullish Cross. Expect new ATH.Bitcoin (BTCUSD) just completed a Bullish Cross on its 1W STOCH RSI and that's the first time it does so since April 07 2025. That was as we know, the previous market bottom of the Trade War correction.
In fact, every 1W STOCH RSI Bullish Cross has been a buy signal within this Bull Cycle's Channel Up (since November 2022), most of which huge. The April 2025 Bullish Leg rose by +65.92% and that has been the 'weakest' one of this Channel Up.
As a result, if we get the bear minimum of +65.92% this time around too, expect a new High around $175000, which should be the Cycle Top and in our opinion the absolute maximum that this Cycle can give.
Do you think we will go that high? Feel free to let us know in the comments section below!
-------------------------------------------------------------------------------
** Please LIKE 👍, FOLLOW ✅, SHARE 🙌 and COMMENT ✍ if you enjoy this idea! Also share your ideas and charts in the comments section below! This is best way to keep it relevant, support us, keep the content here free and allow the idea to reach as many people as possible. **
-------------------------------------------------------------------------------
💸💸💸💸💸💸
👇 👇 👇 👇 👇 👇

WIF Market Update📊 SEED_WANDERIN_JIMZIP900:WIF Market Update
SEED_WANDERIN_JIMZIP900:WIF is now testing an important resistance zone 🔴
👉 There’s a chance of rejection here, but if it breaks out, that’s a strong signal for a bullish trend ✅
⚡ Watch closely — confirmation will show the next move.

ENA has formed a bullish Inverted Head & Shoulders pattern📊 MIL:ENA Market Update
MIL:ENA has formed a bullish Inverted Head & Shoulders pattern 🟢
👉 If price breaks out the red resistance zone 🔴, the first target will be the green line level 🎯
⚡ Breakout confirmation is key before entering.

BTC idea for the weekWithin this range, we have what I have posted is a temporary bear trap that runs us to the range high which is also called supply. I don't believe we'll make it past this point and we will continue the downward trend from 120+ K this should run us to around 90,000 maybe less before a significant accumulation and short markup phase

BTC Price Action: Bulls vs BearsBitcoin has shown a gradual recovery after a prolonged corrective phase, with market structure leaning toward a constructive buildup. Fundamentally, sentiment is influenced by global macro conditions—investors are watching U.S. monetary policy signals, while stable demand from institutions and long-term holders continues to provide a supportive backdrop. On-chain activity remains steady, with balanced exchange inflows and outflows suggesting no extreme directional pressure in the near term.
From a technical perspective, the market has shifted momentum from bearish flows into a developing bullish sequence. The recent break of structure on the 4H timeframe highlights strengthening upside intent, though price is still moving within a broader accumulation phase. Current flows suggest the possibility of a short-term dip for liquidity before continuation to higher levels, aligning with the overall constructive weekly outlook.

ONDOUSD – Waiting for Bullish Re-entry After 13% SurgeONDO recently posted a 13%+ rally, showing strong bullish momentum. However, the price faced resistance and is now pulling back, likely heading toward a key support zone between $0.85 and $0.78. This level has historically acted as a solid base, and we’re watching for signs of a bullish reversal there.
📉 Retracement Expected
The current rejection suggests a healthy correction. A controlled move back into the support range could offer a high-probability long setup—if buyers step in and price action confirms.
📈 Trade Setup (Spot Long):
• Entry Zone: $0.85 – $0.78
• Targets:
🥇 TP1: $1.13 – $1.32
🥈 TP2: $1.64 – $2.00
• Stop Loss: Daily close below $0.75

C98 ANALYSIS🔮#C98 Analysis 💰💰
#C98 is trading in a symmetrical triangle in a weekly time frame and if it breakouts with high volume then we can see a bullish momentum in #C98. Before that we will see little bit bearish movement towards its support zone and that a bullish movement.
🔖 Current Price: $0.0498
⏳ Target Price: $0.0634
⁉️ What to do?
- We can trade according to the chart and make some profits in #C98. Keep your eyes on the chart, observe trading volume and stay accustom to market moves.💲💲
#C98 #Cryptocurrency #Pump #DYOR

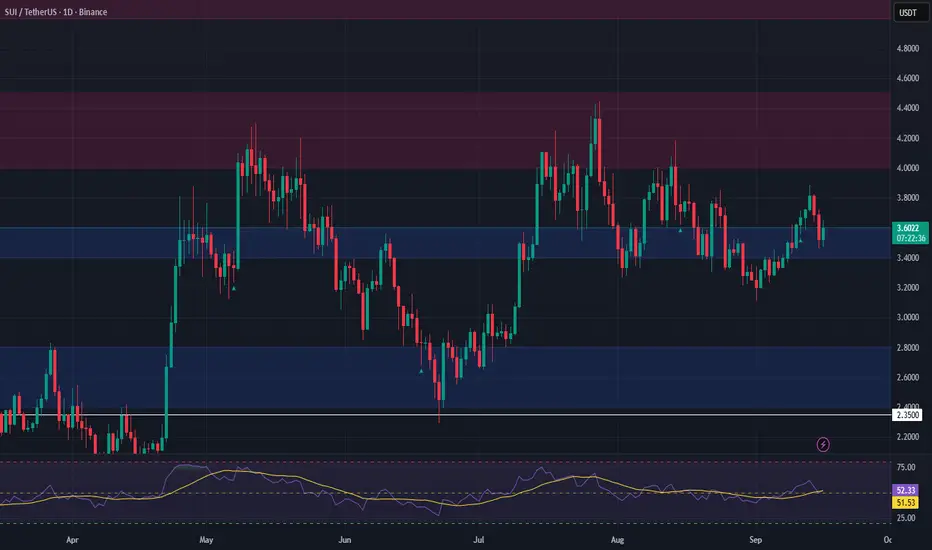
SUI Trade Setup – Bullish Structure Intact Amid VolatilitySUI continues to hold a bullish market structure despite increased volatility driven by macro headlines. Price action remains above the bull market support band, indicating strength and resilience. A notable confluence zone has formed between $2.40 and $2.80, where buyers previously stepped in aggressively.
This area is shaping up as a high-probability accumulation zone, especially if a liquidation wick drives price into it. A bounce from this range could initiate the next expansion leg upward.
🔹 Trade Setup
• Entry Zone: $2.40 – $2.80
• Take Profit Targets:
🥇 $3.40 – $3.60
🥈 $4.00 – $4.50
• Stop Loss: Daily close below $2.35
BITCOIN → Consolidation in anticipation of a bullish driver...BINANCE:BTCUSDT is testing the 117K area as part of an upward movement triggered by the end of the bearish correction. The price is moving into consolidation. Focus on the range boundaries...
The market is awaiting the Fed's interest rate meeting. A rate cut could support the growth of the flagship, but before that, the market may form a manipulation in the form of a long squeeze.
The market is forming consolidation after breaking the local correction against the backdrop of a global bullish trend. Focus on the boundaries of the range.
Technically, I would highlight the support of local consolidation and the previously broken trend boundary as two key details that can be used in further trading: 114600, 113300. Behind this zone lies a pool of liquidity, and before a possible rise, the price may try to absorb it... Technically, we are seeing confirmation of a bullish market structure; all that remains is to wait for the appearance of a bullish driver and the market's readiness for growth.
Support levels: 114600, 113300, 110700
Resistance levels: 11700, 117860
A false breakdown of support followed by a close above one of the specified zones could attract buyer interest, which in turn could trigger a price increase within the global bullish trend.
Best regards, R. Linda!

Long Term Btc PlanI can see BTC going to take 85k.
People think "Below 90k bull run is over"
Would cause extreme fear/panic in the markets if broken below 90k. basically reaching 85-86k would be cause just by paper hands at the end being scared out of their positions.
Currently Looking for bigger shorts and small longs only. Exception if BTC breaks above 118.5k and shows bullish signals.
Will look for reenter spot below 90/100k depends on situation.
Want to see Diamond Top playout on 4h, then break above it or reject from 786/886 fibb and enter big short to 105/90s.
The Long/Short Positions on chart is worth looking at, I have alerts near all entries/SL/Tp and even S/R.
I had a thought that next big crash might be caused by an exchange going tits up at near top, and I have intuition it might be MEXC.
NOT YOUR KEYS NOT YOUR ASSETS.

Bullish bounce off key supportThe Bitcoin (BTC/USD) is falling towards the pivot, which acts as a pullback support that aligns with the 38.2% Fibonacci retracement and could bounce to the 1st resistance.
Pivot: 112,941.31
1st Support: 110,100.67
1st Resistance: 117,319.09
Disclaimer:
The above opinions given constitute general market commentary, and do not constitute the opinion or advice of IC Markets or any form of personal or investment advice.
Any opinions, news, research, analyses, prices, other information, or links to third-party sites contained on this website are provided on an "as-is" basis, are intended only to be informative, is not an advice nor a recommendation, nor research, or a record of our trading prices, or an offer of, or solicitation for a transaction in any financial instrument and thus should not be treated as such. The information provided does not involve any specific investment objectives, financial situation and needs of any specific person who may receive it. Please be aware, that past performance is not a reliable indicator of future performance and/or results. Past Performance or Forward-looking scenarios based upon the reasonable beliefs of the third-party provider are not a guarantee of future performance. Actual results may differ materially from those anticipated in forward-looking or past performance statements. IC Markets makes no representation or warranty and assumes no liability as to the accuracy or completeness of the information provided, nor any loss arising from any investment based on a recommendation, forecast or any information supplied by any third-party.

$BTC ATH Sept 23 - 30th - Global Liquidity UpdateThis total global liquidity indicator alongside DXY (inverted) has pretty much nailed BTC tops and bottoms to the day this cycle.
Pretty wild how accurate this is.
Notice the inverted head & shoulders pattern and neckline break for confirmation.

Bitcoin Cycles Update (4H Chart)BTC is tracking within a 175-bar cycle, and price is now in the later stage of the current cycle. After a bounce toward the 115k–116k zone, momentum looks to be stalling. The Stoch RSI is in overbought territory, hinting at cycle exhaustion.
If history repeats, we could see a corrective leg lower, with potential support in the 102k–106k range before the next cycle upswing develops.
In short: Cycle suggests we’re closer to a top than a bottom.


IQ Market Update📊 NASDAQ:IQ Market Update
NASDAQ:IQ is retracing now 📉
👉 If the price keeps dropping, there’s a potential rebound at the green support zone around $0.003295 🟢
Possible long entry if buyers step in — but always wait for confirmation ✅
⚡ Trade smarter, manage risk.

Ethereum (ETHUSD) Technical OutlookEthereum remains in a critical yet bullish consolidation phase, trading sideways near all-time highs. This kind of price action often precedes major breakouts, especially with macro tailwinds building — the Fed is expected to cut rates this week, adding liquidity to the market.
🔍 Technical Setup
ETH is currently attempting a breakout from a symmetrical triangle — a bullish continuation pattern in trending markets.
✅ Uptrend confirmed by:
Higher highs
Higher lows
Strong support structure
🎯 Key Levels to Watch
Immediate target zone: $5,700 – $5,800
Macro rally potential: $7,000 – $8,000
Crucial support: $4,000 – $4,200
As long as ETH holds above $4,000, there’s no technical reason to be bearish.

TradeCityPro | Bitcoin Daily Analysis #177👋 Welcome to TradeCity Pro!
Let's dive into Bitcoin analysis, today’s analysis will be on the 1-hour timeframe since Bitcoin is in a corrective phase, and we’ll look at what triggers we can have for trading today.
⏳ 1-Hour Timeframe
After reaching the 116,619 level, the market entered a ranging phase and spent Saturday and Sunday consolidating below this level.
📊 Earlier today, before the London session, Bitcoin was rejected from 116,619, starting a bearish move with strong momentum and high volume, pushing price down to the 0.382 Fibonacci level for a correction.
⭐ If price finds support here, we can say the uptrend is still strong since it bounced from the first available support zone and started moving upward. In this case, a breakout above 116,619 would be a good long position entry.
🔍 But if the correction continues, the next support levels to watch are 0.5, 0.618, and 0.786 Fibonacci retracement levels.
✔️ The area between the 0.5 and 0.618 Fibonacci retracements forms a critical PRZ, and if price moves lower, this is one of the areas with a high probability of seeing a reaction.
❌ Disclaimer ❌
Trading futures is highly risky and dangerous. If you're not an expert, these triggers may not be suitable for you. You should first learn risk and capital management. You can also use the educational content from this channel.
Finally, these triggers reflect my personal opinions on price action, and the market may move completely against this analysis. So, do your own research before opening any position.

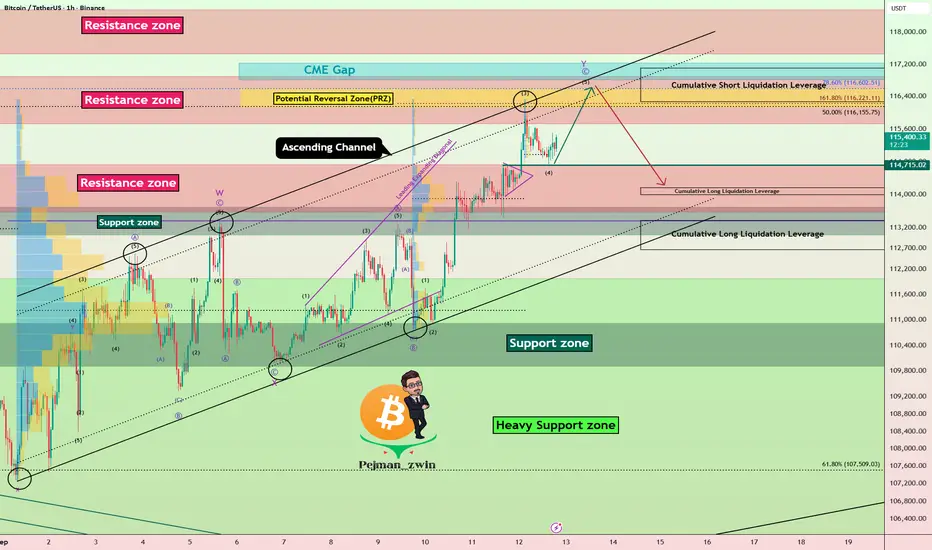
Bitcoin Roadmap | Short termBitcoin ( BINANCE:BTCUSDT ) has been experiencing a lot of volatility over the past 10 days, and the reasons for these movements could be the announcement of US indices + geopolitical issues Those who were in favor of Bitcoin caused Bitcoin to pump .
Bitcoin's movements over the past 10 days have managed to form an Ascending Channel .
In terms of Elliott Wave theory , Bitcoin appears to be completing microwave 5 of microwave C of the main wave Y .
I expect Bitcoin to try to complete main wave Y , and if we find signs of a reversal in the Resistance zone($116,900-$115,730) and Potential Reversal Zone(PRZ) , we can expect a further decline . Also, it is expected that the CME Gap($117,235-$116,820) will eventually be completed in the main wave Y .
Cumulative Long Liquidation Leverage: $114,165-$113,989
Cumulative Long Liquidation Leverage: $113,370-$112,664
Cumulative Short Liquidation Leverage: $117,102-$116,266
Please respect each other's ideas and express them politely if you agree or disagree.
Bitcoin Analysis (BTCUSDT), 1-hour time frame.
Be sure to follow the updated ideas.
Do not forget to put a Stop loss for your positions (For every position you want to open).
Please follow your strategy and updates; this is just my Idea, and I will gladly see your ideas in this post.
Please do not forget the ✅' like '✅ button 🙏😊 & Share it with your friends; thanks, and Trade safe.
S&P500 | H1 Rising Wedge | GTradingMethodHello again Traders
🧐 Market Overview:
The S&P is forming a rising wedge on the 1H chart. I don’t usually trade this pattern, but with the price approaching the wedge top, I see a potential short opportunity worth a small risk.
On the 4H chart, there’s an even larger rising wedge at play. My instinct is still that this could turn into a fake-out, so I’m monitoring lower timeframes for short setups that align with the bigger picture.
📊 Trade Plan:
Risk/Reward: 9.45
Entry: 6 621.4
Stop Loss: 6 631.0
Take Profit 1 (50%): 6 546.2
Take Profit 2 (50%): 6 487.4
🙏 Thanks for checking out my post!
Make sure to follow me to catch the next idea and please share your thoughts – I’d like to hear them.
📌 Please note:
This is not financial advice. This content is to track my trading journey and for educational purposes only.

CHR / USDT - Almost Ready! Morning fellas,
Taking a risk here. Obv its ur money, do with it as you wish, as this aint financial advice, but its hella looking good!
Trade thirsty, my friends!
