BITCOIN → Consolidation in anticipation of a bullish driver...BINANCE:BTCUSDT is testing the 117K area as part of an upward movement triggered by the end of the bearish correction. The price is moving into consolidation. Focus on the range boundaries...
The market is awaiting the Fed's interest rate meeting. A rate cut could support the growth of the flagship, but before that, the market may form a manipulation in the form of a long squeeze.
The market is forming consolidation after breaking the local correction against the backdrop of a global bullish trend. Focus on the boundaries of the range.
Technically, I would highlight the support of local consolidation and the previously broken trend boundary as two key details that can be used in further trading: 114600, 113300. Behind this zone lies a pool of liquidity, and before a possible rise, the price may try to absorb it... Technically, we are seeing confirmation of a bullish market structure; all that remains is to wait for the appearance of a bullish driver and the market's readiness for growth.
Support levels: 114600, 113300, 110700
Resistance levels: 11700, 117860
A false breakdown of support followed by a close above one of the specified zones could attract buyer interest, which in turn could trigger a price increase within the global bullish trend.
Best regards, R. Linda!
BTC-M

Long Term Btc PlanI can see BTC going to take 85k.
People think "Below 90k bull run is over"
Would cause extreme fear/panic in the markets if broken below 90k. basically reaching 85-86k would be cause just by paper hands at the end being scared out of their positions.
Currently Looking for bigger shorts and small longs only. Exception if BTC breaks above 118.5k and shows bullish signals.
Will look for reenter spot below 90/100k depends on situation.
Want to see Diamond Top playout on 4h, then break above it or reject from 786/886 fibb and enter big short to 105/90s.
The Long/Short Positions on chart is worth looking at, I have alerts near all entries/SL/Tp and even S/R.
I had a thought that next big crash might be caused by an exchange going tits up at near top, and I have intuition it might be MEXC.
NOT YOUR KEYS NOT YOUR ASSETS.

Bullish bounce off key supportThe Bitcoin (BTC/USD) is falling towards the pivot, which acts as a pullback support that aligns with the 38.2% Fibonacci retracement and could bounce to the 1st resistance.
Pivot: 112,941.31
1st Support: 110,100.67
1st Resistance: 117,319.09
Disclaimer:
The above opinions given constitute general market commentary, and do not constitute the opinion or advice of IC Markets or any form of personal or investment advice.
Any opinions, news, research, analyses, prices, other information, or links to third-party sites contained on this website are provided on an "as-is" basis, are intended only to be informative, is not an advice nor a recommendation, nor research, or a record of our trading prices, or an offer of, or solicitation for a transaction in any financial instrument and thus should not be treated as such. The information provided does not involve any specific investment objectives, financial situation and needs of any specific person who may receive it. Please be aware, that past performance is not a reliable indicator of future performance and/or results. Past Performance or Forward-looking scenarios based upon the reasonable beliefs of the third-party provider are not a guarantee of future performance. Actual results may differ materially from those anticipated in forward-looking or past performance statements. IC Markets makes no representation or warranty and assumes no liability as to the accuracy or completeness of the information provided, nor any loss arising from any investment based on a recommendation, forecast or any information supplied by any third-party.

$BTC ATH Sept 23 - 30th - Global Liquidity UpdateThis total global liquidity indicator alongside DXY (inverted) has pretty much nailed BTC tops and bottoms to the day this cycle.
Pretty wild how accurate this is.
Notice the inverted head & shoulders pattern and neckline break for confirmation.

Bitcoin Cycles Update (4H Chart)BTC is tracking within a 175-bar cycle, and price is now in the later stage of the current cycle. After a bounce toward the 115k–116k zone, momentum looks to be stalling. The Stoch RSI is in overbought territory, hinting at cycle exhaustion.
If history repeats, we could see a corrective leg lower, with potential support in the 102k–106k range before the next cycle upswing develops.
In short: Cycle suggests we’re closer to a top than a bottom.


IQ Market Update📊 NASDAQ:IQ Market Update
NASDAQ:IQ is retracing now 📉
👉 If the price keeps dropping, there’s a potential rebound at the green support zone around $0.003295 🟢
Possible long entry if buyers step in — but always wait for confirmation ✅
⚡ Trade smarter, manage risk.

Ethereum (ETHUSD) Technical OutlookEthereum remains in a critical yet bullish consolidation phase, trading sideways near all-time highs. This kind of price action often precedes major breakouts, especially with macro tailwinds building — the Fed is expected to cut rates this week, adding liquidity to the market.
🔍 Technical Setup
ETH is currently attempting a breakout from a symmetrical triangle — a bullish continuation pattern in trending markets.
✅ Uptrend confirmed by:
Higher highs
Higher lows
Strong support structure
🎯 Key Levels to Watch
Immediate target zone: $5,700 – $5,800
Macro rally potential: $7,000 – $8,000
Crucial support: $4,000 – $4,200
As long as ETH holds above $4,000, there’s no technical reason to be bearish.

TradeCityPro | Bitcoin Daily Analysis #177👋 Welcome to TradeCity Pro!
Let's dive into Bitcoin analysis, today’s analysis will be on the 1-hour timeframe since Bitcoin is in a corrective phase, and we’ll look at what triggers we can have for trading today.
⏳ 1-Hour Timeframe
After reaching the 116,619 level, the market entered a ranging phase and spent Saturday and Sunday consolidating below this level.
📊 Earlier today, before the London session, Bitcoin was rejected from 116,619, starting a bearish move with strong momentum and high volume, pushing price down to the 0.382 Fibonacci level for a correction.
⭐ If price finds support here, we can say the uptrend is still strong since it bounced from the first available support zone and started moving upward. In this case, a breakout above 116,619 would be a good long position entry.
🔍 But if the correction continues, the next support levels to watch are 0.5, 0.618, and 0.786 Fibonacci retracement levels.
✔️ The area between the 0.5 and 0.618 Fibonacci retracements forms a critical PRZ, and if price moves lower, this is one of the areas with a high probability of seeing a reaction.
❌ Disclaimer ❌
Trading futures is highly risky and dangerous. If you're not an expert, these triggers may not be suitable for you. You should first learn risk and capital management. You can also use the educational content from this channel.
Finally, these triggers reflect my personal opinions on price action, and the market may move completely against this analysis. So, do your own research before opening any position.

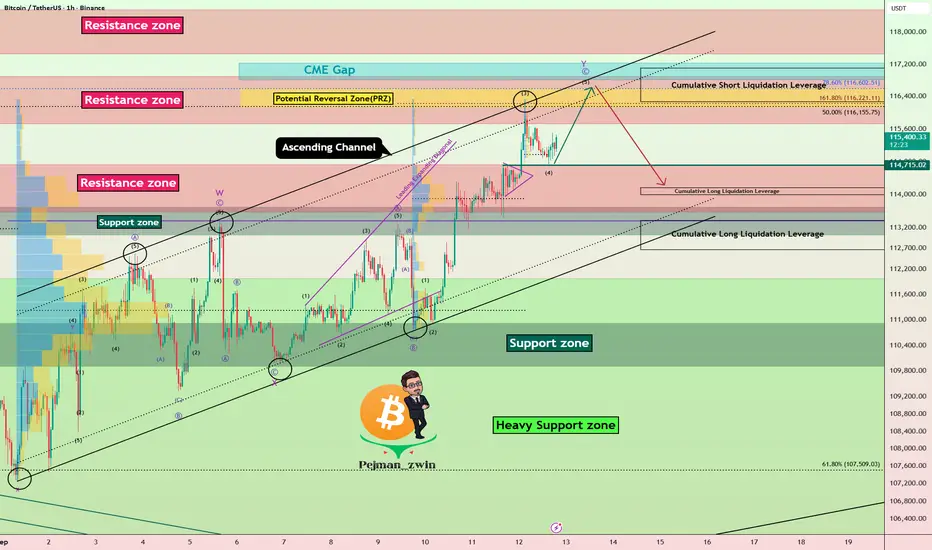
Bitcoin Roadmap | Short termBitcoin ( BINANCE:BTCUSDT ) has been experiencing a lot of volatility over the past 10 days, and the reasons for these movements could be the announcement of US indices + geopolitical issues Those who were in favor of Bitcoin caused Bitcoin to pump .
Bitcoin's movements over the past 10 days have managed to form an Ascending Channel .
In terms of Elliott Wave theory , Bitcoin appears to be completing microwave 5 of microwave C of the main wave Y .
I expect Bitcoin to try to complete main wave Y , and if we find signs of a reversal in the Resistance zone($116,900-$115,730) and Potential Reversal Zone(PRZ) , we can expect a further decline . Also, it is expected that the CME Gap($117,235-$116,820) will eventually be completed in the main wave Y .
Cumulative Long Liquidation Leverage: $114,165-$113,989
Cumulative Long Liquidation Leverage: $113,370-$112,664
Cumulative Short Liquidation Leverage: $117,102-$116,266
Please respect each other's ideas and express them politely if you agree or disagree.
Bitcoin Analysis (BTCUSDT), 1-hour time frame.
Be sure to follow the updated ideas.
Do not forget to put a Stop loss for your positions (For every position you want to open).
Please follow your strategy and updates; this is just my Idea, and I will gladly see your ideas in this post.
Please do not forget the ✅' like '✅ button 🙏😊 & Share it with your friends; thanks, and Trade safe.
S&P500 | H1 Rising Wedge | GTradingMethodHello again Traders
🧐 Market Overview:
The S&P is forming a rising wedge on the 1H chart. I don’t usually trade this pattern, but with the price approaching the wedge top, I see a potential short opportunity worth a small risk.
On the 4H chart, there’s an even larger rising wedge at play. My instinct is still that this could turn into a fake-out, so I’m monitoring lower timeframes for short setups that align with the bigger picture.
📊 Trade Plan:
Risk/Reward: 9.45
Entry: 6 621.4
Stop Loss: 6 631.0
Take Profit 1 (50%): 6 546.2
Take Profit 2 (50%): 6 487.4
🙏 Thanks for checking out my post!
Make sure to follow me to catch the next idea and please share your thoughts – I’d like to hear them.
📌 Please note:
This is not financial advice. This content is to track my trading journey and for educational purposes only.

CHR / USDT - Almost Ready! Morning fellas,
Taking a risk here. Obv its ur money, do with it as you wish, as this aint financial advice, but its hella looking good!
Trade thirsty, my friends!

S&P500 | H1 Double Top | GTradingMethod👋 Hello traders,
Tried shorting a potential head and shoulders on the 1H chart earlier — it failed. Thankfully, one of my exit rules triggered before my stop loss, so the loss was small, but still not pleasant. That’s trading.
🧐 Market Overview:
The bigger picture remains the same. On the detailed side, I am looking for a potential double top on the hourly chart. RSI is making lower highs while price is making higher highs, which shows weakening buying momentum. For me, this is a non-negotiable variable when trading double tops and head & shoulders setups.
I’ll be waiting for a candle closure in my entry range, alongside a few more confirmations, before taking the next shot. Patience is key here.
📊 Trade Plan:
Risk/Reward: 3.4
Entry: 6 598.4
Stop Loss: 6 608.3
Take Profit 1 (50%): 6 567.9
Take Profit 2 (50%): 6 557.9
💡 GTradingMethod Tip:
Losses are part of the process. The key is to keep them small, stick to your rules, and wait for probability to play out over time.
🙏 Thanks for checking out my post!
Follow me to catch my next setup, and let me know — do you think this head and shoulders will confirm, or will buyers push the S&P to fresh highs?
📌 Disclaimer:
This is not financial advice. This content is to track my trading journey and for educational purposes only.

15/09/25 Weekly OutlookLast weeks high: $116,672.39
Last weeks low: $110,615.91
Midpoint: $113,644.15
It's FOMC week and finally the time has come for the FED to cut interest rates, but by how much?
Currently the probability of a cut is 100%. The chance of a 25bps cut is ~90%, a 50bps cut ~12%.
Therefore I believe a 25bps cut is priced in and expected by the majority, a 50bps cut would be bullish and no change would be devastating to the markets in the short term.
Last week BTC continues its move up and flipped the important S/R level of $114,000 in preparation for FOMC. Ultimately the bulls should now target a flip of $117,500 to continue the larger bullrun move. Should the bulls fail to do so the rangebound environment looks to continue with the low being $106,000 (1D 200 EMA).
As I have mentioned in previous post September often gives poor returns, so far this year BTC is up 6% from month open, perhaps in anticipation for the rate cut to come? I don't see many setups presenting themselves until after Thursday so just being patient until then.
Good luck this week everybody!

BITCOIN Will it pull back??Bitcoin (BTCUSD) just formed a 4H Golden Cross, technically a bullish pattern, which usually emerges at the start of uptrends.
Such a formation emerged on both main Channel Up patterns since the April 07 Trade War bottom. The interesting feature however is that, following every 4H Golden Cross, the price always pulled back to its 4H MA200 (orange trend-line).
With BTC having started the week on the back foot, the 4H MA200 currently stands at $113600. Ahead of the Fed Rate Decision this week, a 'volatility' pull-back would align the news with this technical need.
Do you think we'll get that pull-back? Feel free to let us know in the comments section below!
-------------------------------------------------------------------------------
** Please LIKE 👍, FOLLOW ✅, SHARE 🙌 and COMMENT ✍ if you enjoy this idea! Also share your ideas and charts in the comments section below! This is best way to keep it relevant, support us, keep the content here free and allow the idea to reach as many people as possible. **
-------------------------------------------------------------------------------
💸💸💸💸💸💸
👇 👇 👇 👇 👇 👇

S&P500 | H1 Head and shoulders | GTradingMethodHello Traders.
🧐 Market Overview:
I am still holding a short on the rising wedge visible on the 4-hour chart. While the S&P 500 has broken out to the upside of the wedge, there’s still a real chance this could be a fake out.
The RSI is showing overbought conditions across the 1H, 2H, and 4H timeframes, which makes it difficult for price to push higher without cooling off first. From a probability standpoint, I see the short as more favorable here than chasing longs.
With hindsight I should have waited for a reversal pattern to open shorts when trying to trade the risking wedge on the 4 hour chart.
If the head and shoulders pattern on the 1H chart fails, then a possible double top on the 2H chart may form. I’ll post an update if that scenario plays out and I have time.
NB! I do not have confirmation to enter the head and shoulders short yet. It is only on my radar for now.
📊 Trade Plan:
Risk/Reward: 3.8
Entry: 6 589.7
Stop Loss: 6 599
Take Profit 1 (50%): 6 560.2
Take Profit 2 (50%): 6 544.2
💡 GTradingMethod Tip:
A favorable setup doesn’t guarantee success, but managing risk and aligning with probability is how I stay consistent over the long term.
🙏 Thanks for checking out my post!
Make sure to follow me to catch the next idea and please share your thoughts — I’d like to hear them.
📌 Please note: This is not financial advice. This content is to track my trading journey and for educational purposes only.

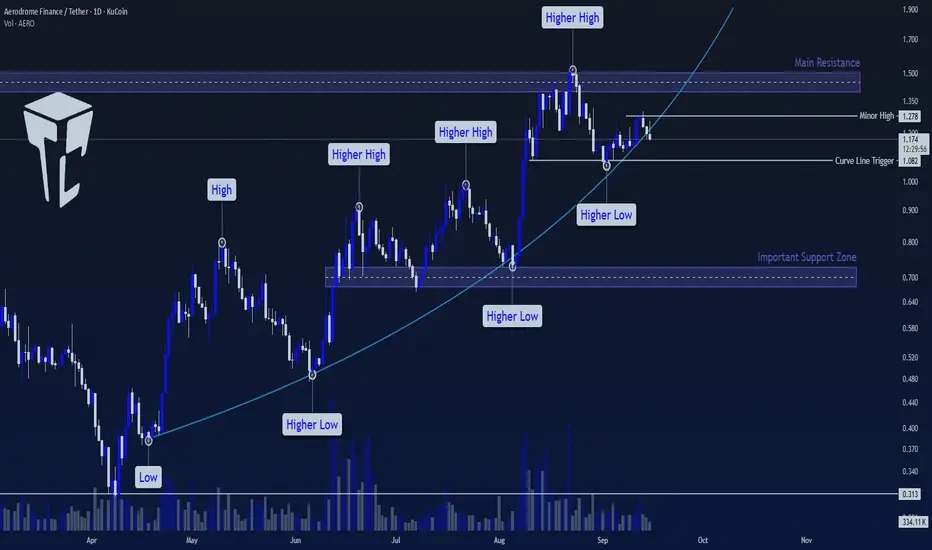
TradeCity Pro | AERO Testing Key Support on Curved Uptrend👋 Welcome to TradeCity Pro!
In this analysis, I want to review the AERO coin for you. It is one of the largest crypto DEX platforms that mainly operates in China Base and currently ranks 77th on CoinMarketCap with a market cap of $1.05 billion.
📅 Daily Timeframe
In the daily timeframe, we see an uptrend that has been moving sharply upward along a curved trendline.
⚡️ The main resistance for AERO is the 1.5 zone, which I have marked on the chart.
✔️ Price has touched this area once and has now returned to its trendline, forming a minor top at 1.278. If it gets rejected from this level and triggers 1.082, this level will turn into a major top.
🔍 Currently, the 1.082 level is a very good trigger for a short position. Breaking this level confirms the trendline break and could start a large corrective wave toward the next support zone.
✨ However, if the price forms a range box between 1.082 and 1.278, we can open an early long position after the breakout of 1.278. The main trigger for a long position or even a spot buy will be the breakout of the 1.5 zone.
📊 A positive sign for the uptrend is that volume has increased well during bullish waves and decreased during corrections. This indicates strong buyer momentum and is a bullish signal for the trend.
📝 Final Thoughts
Stay calm, trade wisely, and let's capture the market's best opportunities!
This analysis reflects our opinions and is not financial advice.
Share your thoughts in the comments, and don’t forget to share this analysis with your friends! ❤️
The altseason will begin!!!The price will drop to the 0.618 Fibonacci level, then pump to 117K. If Bitcoin holds the 113K support, the altseason will begin.

BTCUSD: Rully Continue in Upward ChannelHello everyone, here is my breakdown of the current Bitcoin setup.
Market Analysis
From a broader perspective, we've seen a significant shift in the market structure for Bitcoin. The price has successfully broken out of a prior Downward channel, a key event that signaled a reversal and shifted control from sellers to buyers, establishing a new bullish phase.
This new bullish phase has since formed a well-defined Upward Channel. The price has been making a series of higher highs and higher lows within this structure, but is currently in a corrective pullback, heading towards the channel's ascending support line, which is a key area to watch.
My Scenario & Strategy
My scenario is based on the expectation that this newly formed Upward Channel will continue to be respected by the market. I'm looking for the price to complete its dip and test the ascending support line. A confirmed bounce from this dynamic support would be the key signal that the correction is over and the next impulsive move up is beginning.
A successful rebound would validate the long scenario, with the price then expected to rally towards the top of the channel and break the intermediate Resistance at the 116700 level. The primary target for this move is 118500.
That's the setup I'm tracking. Thank you for your attention, and always manage your risk.

WEEKLY UPDATE ON BTC, ETH, BTC.D - 9/7/2025This weekend's technical analysis is an update from previous week's analysis posted. I am expecting BTC to continue it's price action to the daily 200 EMA after the relief bounce off from the weekly 21 EMA as noted last week. Our BTC analysis will be invalidated if the on the daily chart we get a candle open and close above $114k on good volume and momentum as the weekly and monthly chart is still in a strong uptrend.
ETH pullback is also intact as discussed from last week and approaching the breakout price level of $4000 which coincides with the weekly 9EMA support zone. I will be expecting ETH bulls to battle this level in a consolidation price action before a break down to the weekly 21 EMA target of 3,500.
Bitcoin Dominance did follow through our analysis last week with the inverted hammer play and has now also given some confirmation of a temporal reversal based on indicators. I will be expecting a bounce on Bitcoin Dominance to the resistance level of 59.2% and if there enough momentum to break through the resistance then next target will be 60.64%.
That's a summary of what I will be looking for on these charts as the week unfolds. Thanks for spending time to listen to my analysis and opinion and I wish you the best of trading this week. Cheers !!!

BE AWARE OF 111K BTC RETRACEMENT IF LARGER H&S STARTS FORMINGMorning folks,
So, our 116.15K target is perfectly met. What's next? First is, some quiet time should be until the Fed meeting. As market hits upside AB=CD, forming daily "222" Sell around resistance area, it is reasonable to suggest a pullback.
Normally, (before BTC proceeds to 119K target here) is to expect the pullback to nearest two levels - 114+K and 112.60-113.17K K-area as it is shown on 1H chart. But, we also do not exclude scenario of a bigger reverse H&S
So, if you will see that market is dropping further - keep an eye on 111K support. This is the last bullish outpost for short-term tendency. Drop to 111K doesn't mean yet that the upside game is over.
So, let's watch first for most common scenario of retracement, but also keep in mind 111K level. We do not consider any bearish trades for now and watch for deeps to buy.
I mark this idea as "bearish" just because of expected retracement. In general we have a bullish view.
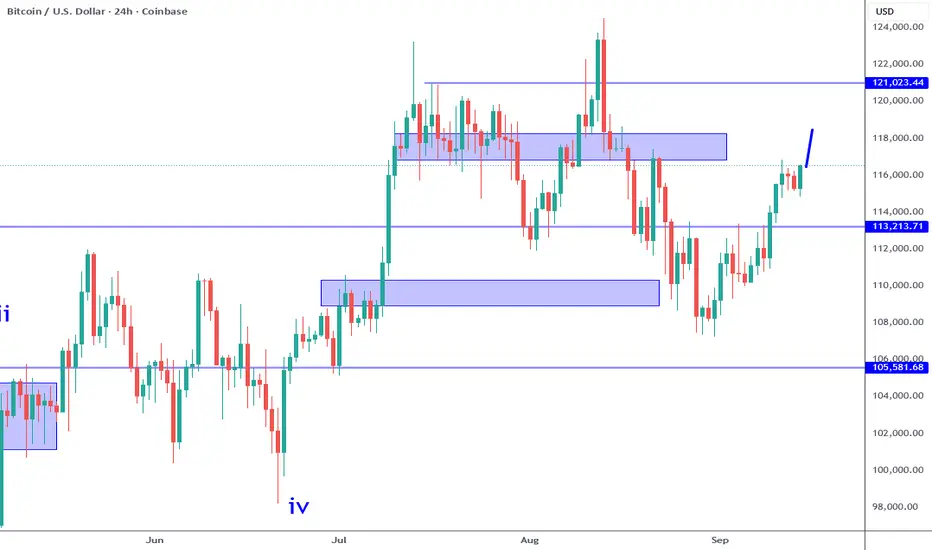
Bitcoin - Will Bitcoin break out of range?!Bitcoin is above EMA50 and EMA200 on the four-hour timeframe and is in its ascending channel. If the downward trend continues towards the specified demand range, we can buy Bitcoin with appropriate risk-reward.
Bitcoin’s rise to around 121,000 and its arrival at the specified supply range will provide us with its next selling position. It should be noted that there is a possibility of heavy fluctuations and shadows due to the movement of whales in the market and capital management in the cryptocurrency market will be more important. If the downward trend continues, we can buy within the demand range.
Bitcoin continues to fluctuate within the $110,000 to $117,000 range, as reduced capital inflows into ETFs combined with intensified profit-taking exert mounting pressure on its upward momentum. In this environment, the derivatives market—driven by the strong presence of futures and options contracts—plays a central role in balancing and shaping market direction. Profit-taking by 3–6 month holders, alongside losses realized by recent buyers at price peaks, has fueled selling pressure across the market.
On-chain liquidity still maintains a constructive structure, but signs of gradual weakening are evident. Meanwhile, net ETF inflows and outflows have declined to around 500 BTC per day, significantly undermining demand from traditional finance (TradFi), which had previously been a key driver of rallies in March and December 2024.
Following the mid-August all-time high, market momentum steadily weakened, dragging Bitcoin below the cost basis of recent buyers at the top and pushing the asset back into a range-bound structure. The critical question now is whether this reflects a healthy consolidation phase or the beginning of a deeper corrective cycle.
While dip-buyers provided some support, the primary selling pressure originated from experienced short-term holders. Data shows that 3–6 month holders have been realizing approximately $189 million in daily profits (based on the 14-day moving average), accounting for nearly 79% of total short-term holder realized gains. These figures indicate that many investors who entered the market during the February-to-May correction used the recent rally as an opportunity to lock in profits—creating considerable resistance against upward continuation.
In addition to profit-taking from seasoned short-term holders, recent peak buyers also capitulated by realizing losses during the pullback, further amplifying selling pressure. Alongside on-chain dynamics, assessing external demand through ETFs remains crucial, as these instruments have been pivotal in driving the current market cycle.
Since early August, net inflows into U.S. spot ETFs have sharply declined, currently averaging around 500 BTC per day (14-day moving average). This is far below the levels of capital inflows that had previously supported the bullish phase of the cycle, reflecting weakening momentum from TradFi investors. Given the central role of ETFs in fueling Bitcoin’s recent uptrend, the slowdown in flows makes the market’s current structure noticeably more fragile.
Meanwhile, blockchain-based prediction platform Polymarket has announced a new collaboration with Chainlink. The partnership aims to launch 15-minute crypto prediction markets featuring rapid settlement and industry-leading security standards.
The integration of Chainlink’s oracle technology with Polymarket’s trading infrastructure is expected to enhance user access to accurate and reliable data, delivering a new experience in short-term prediction markets. This collaboration could mark a turning point in the development of innovative trading instruments and price forecasting tools.

Bitcoin: Bullish Engulfing Setup Into FOMC Week.Bitcoin has formed a minor impulse structure and is currently showing a potential wave 4. The fact that it has initially rejected the 116K area resistance, but has barely retraced is a sign of strength. No wave 1, wave 4 overlap lap means a bullish wave 5 is more likely. A 5th wave can see price testing the 118 to 120K area this week. This puts my B wave scenario that I spoke about a week earlier into question which is the nature of subjective wave counts and why it is important to stay flexible.
This week we have the FOMC meeting where the FED is expected to cut interest rates by AT LEAST 25 basis points with an increasing possibility of a greater cut. Keep in mind the 25 point scenario is priced in. If they cut as expected, the focus will be on the press conference and how Powell responds to questions. This is where the market can fluctuate wildly depending on what hints he provides about future rate cuts, etc. Such a catalyst can be substantial enough to push Bitcoin into the 120K area, which will also move the other major markets dramatically as well.
What will invalidate the current bullish setup is a break back below the 113K support. IF this occurs as a result of the upcoming meeting, or any other reason, it will strengthen my B wave argument that I made the week earlier. So at this time, swing trade longs make sense, just be prepared for a dramatic change. IF for whatever reason price tests the 123Ks or higher, that will point to a potential run to the 130KS because it will confirm the current formation is still part of a broader wave 4. Yes it can be confusing, and when it is, focus more on the market structure itself.
Thank you for considering my analysis and perspective.