Bitcoin — Bearish Bias Intact as Price Pressures Interim SupportAs explained in my previous analyses, my medium-term bias on Bitcoin remains bearish, with 75k as the minimum zone I expect to be reached before any meaningful and sustainable bullish reversal can take place.
Looking at the chart:
- After the drop to November lows toward 80k, BTC once again entered a consolidation phase
- This range has been capped by a clear resistance zone around 95k
- Following the latest rejection from that resistance, price rolled over and is now trading just above the interim support area at 89,500–90,000
This puts the market at an important decision point.
⚖️ Two Medium-Term Bearish Scenarios
At this stage, I am working with two possible paths, both ultimately pointing toward the same downside objective.
1️⃣ Support Holds — Final Push Before Deeper Drop
- Bulls manage to defend the 89.5k–90k support
- A corrective rebound follows
- Price could even push above 100k
- This move would, in my view, represent a final distribution phase
➡️ followed by a broader decline toward the 75k target zone
2️⃣ Support Breaks — Direct Continuation Lower
A clean break below the interim support
This would significantly increase the probability of
➡️ a direct move lower toward 75k, without another major upside attempt
📌 Bottom Line
Until price proves otherwise, I remain bearish on BTC.
The market is currently sitting at a level where structure, not opinion, will decide the next move. Whichever scenario plays out, risk management and patience remain key. 🚀
Btcsignals

BTC Side-waives for BUY BTC this move on side-waives ,its come a down side below FVG hit back to up-side at RED-Line target OR 2nd is current price goes up and re-test back to up side for a BUY Formation its a clear up side make, and normal volume is down-ward its price doesn't want move for sell side, its made a trip where i said price come down then Movie UP-side. now lets see

BTC Analysis: Rising Channel Resistance & Volume Divergence
1. Reaching Ascending Channel Resistance
Looking at the turquoise Ascending Channel on the chart, the current price has reached the top of the channel (resistance line).
In technical analysis, the upper boundary of an ascending channel acts as a strong resistance zone. Unless there is a strong breakout (overshoot), the price tends to revert to the channel's median or bottom. Therefore, selling pressure (profit-taking) is likely to dominate in this area.
2. Bearish Volume Divergence
The most critical signal is indicated by the white arrow on the volume indicator.
Phenomenon: The price continues to make Higher Highs, but the volume is making Lower Lows.
Implication: This is a classic 'Bearish Divergence' signal, indicating that the buying momentum driving the rise is becoming exhausted. It suggests a lack of "fuel" to sustain the rally, meaning a trend reversal is highly probable in the near term.
3. Volume Profile & Support Retest Required
Pay attention to the gray Volume Profile on the left and the yellow box.
POC (Point of Control) Reversion: The longest bar in the volume profile (white line, approx. 87.8k) represents the 'High Volume Node' where trading was most active. Due to the rapid price increase, it is highly likely that the price will retrace to this zone to fill the low-volume areas and retest support.
Box Top Support Confirmation: It is not yet clear if the top of the yellow consolidation box (approx. 90k) has successfully flipped into support after the breakout. Therefore, a healthy correction down to the 90k–88k range (indicated by the red line) is expected.
4. Liquidity Zones
Although the chart shows an uptrend, the dense yellow liquidity zone formed just below at 91.8k is likely to act as a magnet pulling the price down.
Therefore, it is reasonable to expect a short-term pullback to around 91,800 USDT. The market will likely decide whether to resume the uptrend or decline further after sweeping the liquidity in this area.
5. Coinbase Premium
The Coinbase Premium has been rising for the past 4-5 days, but it remains in negative territory.

BTC Analysis
BTC price reached a resistance area that has been touched prevoisuly coulpe times, seems now its time to break.
Check daily candle close and with confrimation join buyers.
Stay tuned for our next updates.

Bitcoin Stuck in a Holiday Range — CME Gap Below?During the Christmas period, Bitcoin ( BINANCE:BTCUSDT ) didn’t exhibit strong momentum and has been moving within a range.
Bitcoin is currently near the resistance zone($90,960-$90,090) and the Cumulative Short Liquidation Leverage($91,840-$90,920).
From an Elliott Wave perspective, it appears that Bitcoin has completed the Double Three Correction(WXY).
I expect that given the weekend and generally lower trading volume at this time, Bitcoin may struggle to break the resistance zone($90,960-$90,090) and could begin to decline, potentially filling the CME Gap($88,720-$88,120). If BTC breaks the support lines, we can expect further declines to the support zone($87,050-$86,420).
Note: Additionally, two important trading levels to watch for Bitcoin are $90,300 and $87,830.
What are your thoughts? Do you think Bitcoin will continue its trend into 2026, or should we prepare for a correction? I’d love to hear your opinion!
Cumulative Long Liquidation Leverage: $87,110-$86,020
First Target: Support lines
Second Target: Support zone($87,050-$86,420)
Stop Loss(SL): $91,880
Points may shift as the market evolves
💡 Please respect each other's opinions and express agreement or disagreement politely.
📌Bitcoin Analysis (BTCUSDT), 1-hour time frame.
🛑 Always set a Stop Loss(SL) for every position you open.
✅ This is just my idea; I’d love to see your thoughts too!
🔥 If you find it helpful, please BOOST this post and share it with your friends.

Bitcoin Christmas Rally? $90K/More in SightBitcoin ( BINANCE:BTCUSDT ), as I previously expected , has risen to its initial target and has broken above the important level of $88,200, which is a positive sign for continued bullish momentum.
At the moment, Bitcoin is striving to break through the resistance zone($89,230-$87,720).
From an Elliott Wave perspective, it seems that Bitcoin is completing microwave B of the main wave Y.
I expect that after breaking the resistance zone($89,230-$87,720), Bitcoin could rise at least up to the significant level of $90,300, approaching the Cumulative Short Liquidation Leverage and the 50_SMA(Daily). If BTC breaks above the 50_SMA(Daily), we can anticipate even further gains for Bitcoin.
The question is: do you think Bitcoin will hold above $90,000, or will it begin to decline again?
And finally, a little note about Christmas: I hope you enjoy a wonderful holiday season with your loved ones, and let’s see how Bitcoin performs as we head into the new year!
Cumulative Long Liquidation Leverage: $86,690-$85,990
First Target: $90,161
Second Target: $90,721
Third Target: 50_SMA(Daily)
Stop Loss(SL): $86,850
Points may shift as the market evolves
💡 Please respect each other's opinions and express agreement or disagreement politely.
📌Bitcoin Analysis (BTCUSDT), 1-hour time frame.
🛑 Always set a Stop Loss(SL) for every position you open.
✅ This is just my idea; I’d love to see your thoughts too!
🔥 If you find it helpful, please BOOST this post and share it with your friends.

BITCOIN HIGH PROBABILITY BUY SETUPSOON!!!🚨BTC HIGH PROBABILITY BUY SETUP 🚨
* Here We Can See Clearly The Next Potential Moves For BTCUSD Coming Hours.
* Keep Your Eyes Close On Your Trading Positions.
* Happy PIP Hunting Traders.
FXKILLA.

Bitcoin Tries to break Key Resistance—New Weekly Rally Starting?Bitcoin ( BINANCE:BTCUSDT ), exactly as expected in my previous idea , started to decline from the resistance zone($89,230-$87,720) and successfully reached its downside target.
Currently, despite the low trading volume during the weekend, Bitcoin appears to have broken above the resistance lines and is now actively attempting to confirm a breakout above the key resistance zone($89,230-$87,720).
From an Elliott Wave perspective, Bitcoin seems to have completed the main wave B within the support zone($85,400-$83,900). The structure of this main wave B appears to be an Expanding Flat(ABC/3-3-5), which aligns well with the current price behavior.
Considering Bitcoin’s strong correlation with the S&P 500 index ( SP:SPX ), and given that my outlook on the S&P 500 index remains bullish , the probability of another upward move in Bitcoin increases as we approach the start of the new trading week.
Based on this confluence, I expect Bitcoin to successfully break above the resistance zone($89,230-$87,720) and potentially move higher toward the $90,217 level as a minimum upside target.
Cumulative Long Liquidation Leverage: $86,800-$85,580
Cumulative Long Liquidation Leverage: $84,400-$82,900
Cumulative Short Liquidation Leverage: $91,870-$90,700
Cumulative Short Liquidation Leverage: $98,400-$97,000
First Target: $90,217
Second Target: $91,177
Third Target: 50_SMA(Daily)
Stop Loss(SL): $85,517Worst)
Points may shift as the market evolves
What is your view on Bitcoin at this stage?
Do you think Bitcoin can sustain a move above $90,000, or will it face rejection again?
💡 Please respect each other's opinions and express agreement or disagreement politely.
📌Bitcoin Analysis (BTCUSDT), 4-hour time frame.
🛑 Always set a Stop Loss(SL) for every position you open.
✅ This is just my idea; I’d love to see your thoughts too!
🔥 If you find it helpful, please BOOST this post and share it with your friends.

BITCOIN (BTC) TRADE SETUP: THE BULL & BEAR BOX STRATEGYBitcoin is currently trading in a choppy consolidation zone. Instead of guessing the direction in the middle of the noise, we are focusing on specific "Decision Boxes" to guide our trades.
We use them as confluence with our standard technical analysis (indicators, patterns, etc.) to confirm entries.
Here is the game plan based on the chart levels:
1. THE YELLOW BOX (MAJOR DEMAND ZONE)
This is the "Line in the Sand" for the bulls.
- Bullish Scenario: If price dips into this yellow box and shows rejection wicks or a lower timeframe reversal pattern, it is a high-probability LONG entry targeting the Red Boxes above.
- Bearish Scenario (Breakdown): If the price breaks below this yellow box with a strong 1H or 4H candle close, the bullish structure is invalidated. This flip from Support to Resistance would trigger a SHORT setup targeting lower liquidity levels.
2. THE RED BOXES (OVERHEAD SUPPLY WALLS)
These red boxes represent areas where sellers are active.
- Bearish Scenario: If price rallies into a Red Box and gets rejected (long wicks to the upside), it is a valid SHORT signal to play the range back down.
- Bullish Scenario (Breakout): If price breaks cleanly through a Red Box, that zone flips from Bearish to Bullish. We then wait for a retest of that broken box to go LONG, targeting the next Red Box higher.
HOW TO TRADE THIS
Do not blindly buy or sell just because the price touches a line. Use these boxes as CONFLUENCE.
- Step 1: Wait for price to enter a Box.
- Step 2: Look for a reaction on the lower timeframe (15m or 5m).
- Step 3: Enter only if you see a reversal candle (Hammer, Engulfing) or a confirmed breakout/retest.
SUMMARY
- Yellow Box Holds = Bullish Bias.
- Yellow Box Breaks = Bearish Bias.
- Red Box Rejects = Bearish Bias.
- Red Box Breaks = Bullish Bias.
Let the market come to your levels. Patience pays.
Disclaimer: This analysis is for educational purposes only. Cryptocurrency trading involves high risk. Always manage your risk properly.

GET READY FOR BITCOIN HIGH PROBABILITY LONG SETUP SOON!!!🚨BTC HIGH PROBABILITY BUY SETUP 🚨
* Here We Can See Clearly The Next Potential Moves For BTCUSD Coming Hours/Days.
* Keep Your Eyes Close On Your Trading Positions.
* Happy PIP Hunting Traders.
FXKILLA.

BTC Isn’t Bottoming — It’s Bargaining: Why 75k Still Makes SenseAs I mentioned in my previous analysis, the idea that “BTC has bottomed” simply doesn’t convince me.
And let’s be honest: when a true bottom forms, you won’t see every account on social media announcing it. Markets don’t work that way — especially crypto, where optimism is often weaponized.
From a structural perspective, the entire rise from the 80k zone looks like a textbook corrective move. Yes, we had a perfectly normal rebound into the 94k area, but everything that followed has been classic corrective behavior:
- Mostly ranging price action
- Repeated spikes into 95k that were quickly sold
- Clear overlapping structure
- A bearish flag, which statistically favors continuation lower
If we also consider the four-month distribution phase between 110k–120k, it becomes even harder to justify a bullish reversal narrative. Distribution of that scale rarely resolves into instant trend reversals — instead, it usually marks the beginning of a deeper cycle shift.
So from a psychological standpoint, the crowd is still bargaining — trying to convince themselves the trend is intact, even though the structure keeps printing lower-probability bullish outcomes. That cognitive dissonance is exactly what fuels bear markets.
My view remains unchanged: 75k remains the primary downside target.
And for me, nothing changes unless BTC manages to stabilize above 100k — not just wicks above, but hold with clear buying interest.
Until that happens, selling rallies is the only rational play.

BTC/USDT: Bulls Defend 89K as Price Eyes 96K ResistanceBTCUSDT is holding firm above its ascending trendline after defending the 89,000 support zone, preserving the broader bullish structure. The recent dip swept short-term liquidity before buyers re-entered, signaling a corrective move rather than a full reversal.
As long as price stays above 89,000, BTC has room to climb toward the 96,000 resistance zone near the weekly high. Continued higher lows and trendline respect favor upside, with consolidation phases adding strength to the bullish case.
➡️ Primary scenario: higher lows hold → continuation toward 96,000 resistance area.
❗️ Risk scenario: a break below 89,000 would invalidate the bullish setup and shift focus toward deeper support zones.

Bitcoin Pumps +10% — Bull Trap or Trend Reversal?Bitcoin( BINANCE:BTCUSDT ) has experienced over a +10% increase in the past two days, which came as a surprise to many analysts considering the previous bearish momentum. In other words, Bitcoin is on something of a roller coaster lately😂.
The question now is whether Bitcoin has started a new bullish trend or if it’s likely to see another decline.
Let’s dive into the 4-hour chart of Bitcoin. Currently, Bitcoin is approaching a resistance zone($94,850-$93,000), a Cumulative Short Liquidation Leverage($94,710-$94,063), and the monthly pivot point. This cluster of resistances, combined with the recent upward momentum, might make it challenging for Bitcoin to break through.
It’s also worth noting that the trading volume during this recent rally hasn’t been particularly high, so Bitcoin could still surprise us. This recent behavior shows that Bitcoin can move sharply both up and down, so it’s crucial to maintain proper risk management.
From an Elliott Wave perspective, considering Bitcoin’s recent decline, I initially expected that Bitcoin might at least test the low of its main wave 3 again. However, the recent rebound suggests that the main wave 5 may be truncated, and the corrective waves could still push Bitcoin lower, potentially even below $75,000.
From a classical technical analysis perspective, Bitcoin might be forming a bearish flag pattern, with the ascending channel acting as the flag’s pole.
In addition, the USDT.D%( CRYPTOCAP:USDT.D ) is still on an upward trend, which indicates that the cryptocurrency market might still face downward pressure.
Moreover, geopolitical tensions, such as those between the U.S. and Venezuela, could also act as a trigger for further Bitcoin declines if they escalate.
Lastly, the S&P 500 index( SP:SPX ), despite its recent bullish trend, doesn’t show the same positive correlation with Bitcoin. In fact, a decline in the S&P 500 could amplify Bitcoin’s downward movement.
Considering all these factors, I expect Bitcoin to continue its bearish trend and potentially test the heavy support zone. If these support levels break, we could see even more significant declines in the crypto market.
Based on the above explanation, I expect Bitcoin to have at least a correction to the targets I specified on the chart, and then depending on the momentum, we can expect a continuation of the decline or a resurgence.
Note: In general, with the opening of the US markets, financial market movements have become more intense these days than before, and it is better to be prepared for any scenario at that time.
What do you think? Do you believe Bitcoin will dip below $75,000, or will it bounce back?
Cumulative Short Liquidation Leverage: $98,591-$96,688
Cumulative Long Liquidation Leverage: $91,860-$90,960
Stop Loss(SL): $96,200
Points may shift as the market evolves
💡 Please respect each other's opinions and express agreement or disagreement politely.
📌Bitcoin Analysis (BTCUSDT), 4-hour time frame.
🛑 Always set a Stop Loss(SL) for every position you open.
✅ This is just my idea; I’d love to see your thoughts too!
🔥 If you find it helpful, please BOOST this post and share it with your friends.

Bitcoin: Final Pump Before the Fall?Over the past five to six days, Bitcoin ( BINANCE:BTCUSDT ) has been attempting to recover from previous weekly declines, and it still appears to be in a corrective phase. This analysis builds on my previous idea, and if you’d like a deeper look at Bitcoin’s mid-term chart, you can check out the 4-hour timeframe in that previous analysis .
Now, a key point for Bitcoin traders is that, despite the recent rally in the S&P 500 ( SP:SPX ) over the past few days, Bitcoin hasn’t been able to keep pace. While it had a good correlation with the S&P 500 in the past, it didn’t experience a similar upward movement this time. Therefore, once the S&P 500 corrects, we may also see Bitcoin resume its downward trend.
Currently, Bitcoin seems to be near a resistance zone($92,200-$88,400) and Cumulative Short Liquidation Leverage($91,570-$89,660). It also appears to be forming an ascending channel over the past few days, indicating a corrective structure.
From an Elliott Wave perspective, Bitcoin seems to be completing microwave C of the microwave Y of the main wave 4, and we can expect this corrective phase to end soon, leading to another downward move. A break of the lower line of the ascending channel would confirm the end of this Wave 4.
I expect that after the Cumulative Short Liquidation Leverage($91,570-$89,660), Bitcoin will resume its decline and move towards the Support zone($86,200-$85,130).
Cumulative Long Liquidation Leverage: $86,000-$85,000
Cumulative Long Liquidation Leverage: $83,249-$81,840
Cumulative Long Liquidation Leverage: $80,263-$78,131
First Target: $86,290
Second Target: $83,800
Stop Loss(SL): $92,229
Points may shift as the market evolves
Note: At lower price levels, Bitcoin’s price includes several Cumulative Short Liquidation Leverages, each potentially causing further price drops. However, if the S&P 500 starts another correction, these levels may break more easily.
Note: Overall, trading in crypto has become a bit challenging lately, with less volatility, so it’s wise to be cautious and manage your capital carefully.
Note: If Bitcoin breaks through the resistance zone($92,200-$88,400) around $92,229, we can expect a renewed upward trend and hope for a bullish movement.
💡 Please respect each other's opinions and express agreement or disagreement politely.
📌Bitcoin Analysis (BTCUSDT), 1-hour time frame.
🛑 Always set a Stop Loss(SL) for every position you open.
✅ This is just my idea; I’d love to see your thoughts too!
🔥 If you find it helpful, please BOOST this post and share it with your friends.

BTC Bounce Looks Corrective – Bottom Not In Yet1. Recap of My Last BTC Outlook (5 November)
In the 5th November analysis, I noted that the 106k support zone was under pressure, and if that level failed, the next meaningful target would be 90k — because 100k, despite being psychological, should not offer much after technical break.
That played out perfectly:
- 106k failed
- 100k offered nothing but a small rebound
- BTC dropped straight into the 90k zone
And then continued even deeper, almost touching 80k before rebounding
We’re now trading around 87,500, after a textbook corrective bounce.
2. Is the Bottom In?
➡️ In my opinion, no. Definitely not.
And here’s where I apply my usual contrarian filter:
Whenever I start hearing the same voices saying the same thing —
“Bitcoin bottom is in! Bitcoin up only!”
— I immediately become cautious.
These are the same people who never consider the other side of the market.
A broken compass can show the right direction once in a while, but it’s still broken.
3. Technical Picture – Nothing Bullish Here
- Yes, the bounce from 80k is normal and expected.
- Yes, BTC can easily retrace 10–15k after a large drop.
- But nothing in the current structure suggests a meaningful bottom.
What we have right now is:
- A classic corrective rebound
- Weak impulse
- No break back above of important resistance
- No reversal pattern
- No shift in market bias
It looks exactly like what price should do after a violent leg down — not like a new bull trend.
This is the type of rebound where retail screams “moon,” but professionals simply prepare for another sell.
4. My Outlook – Bearish Until BTC Reclaims 100k With Conviction
My plan is simple and level-driven:
Preferred Sell Zone:
- 92k → This is where I want to sell, ideally on a weak rally
Downside Targets:
- 80k → Recent low and first logical stop
- 75k → Major structural support and second target
Bearish outlook is invalidated ONLY if:
➡️ BTC reclaims 100k with conviction (not a wick, not a temporary spike)
Until that happens, every rally is a potential shorting opportunity.
5. Conclusion – Still Bearish, Despite the Bounce
BTC has done exactly what it was supposed to do:
- Drop to 90k
- Overshoot to 80k
- And bounce in a corrective manner
Nothing about this price action signals a bottom.
If anything, it signals more downside ahead — once the corrective rally into 92k completes.
Bias: Bearish
Approach: Sell rallies
Invalidation: Break and hold above 100k with conviction
Until then, the narrative “bitcoin up only” remains a meme, not analysis. ⚠️

Downside protected, upside unprotected — BTC to 500kThere's a ton of intriguing action unfolding with Bitcoin right now. Several cycle low indicators I track have started firing off around the $80K mark—pretty wild if you ask me. Let's break them down step by step.
1. 2-Week RSI Signal
It's a straightforward fact: the two-week RSI is sitting at 42, a level that has consistently marked cycle lows in the past. So, at $80K, we've got our first major cycle low signal.
2. Fear & Greed Index
Historically, after a cycle top, the first wave down has driven the Fear & Greed Index to a reading of 10 in the last two cycles.
The rest of the time? It's signalled cycle lows or major bottoms ahead of massive rallies.
#### What This Means: History Rhyming (Again)
This setup screams repetition—Bitcoin has now topped out after exactly 1,064 days, mirroring the last two cycles. On this first corrective wave, Fear & Greed has already plunged to 10. But here's where it gets really telling: layer in the Sharpe ratio for some nuance.
As the chart shows, the Sharpe ratio has dipped into negative territory—a rare event that *only* occurs during true cycle lows.
Invalidation & Bear Market Confirmation
The chart makes it crystal clear: Bitcoin is primed to echo the last cycle's playbook, with a full rejection at the 0.382 Fibonacci retracement. In the prior two cycles, after the initial drop from the cycle high, any subsequent rally completely fizzled out right there at 0.382.
If Bitcoin fails to rally and close decisively above that level by mid-January 2026, the odds skyrocket for a full-blown bear market. Keep an eye on it—this could be the pivot that defines the next leg.
What do you think then?
500k or 67k by October 2026?
Still fully on the upside boat. Risk is heavily skewed to the top side, not down

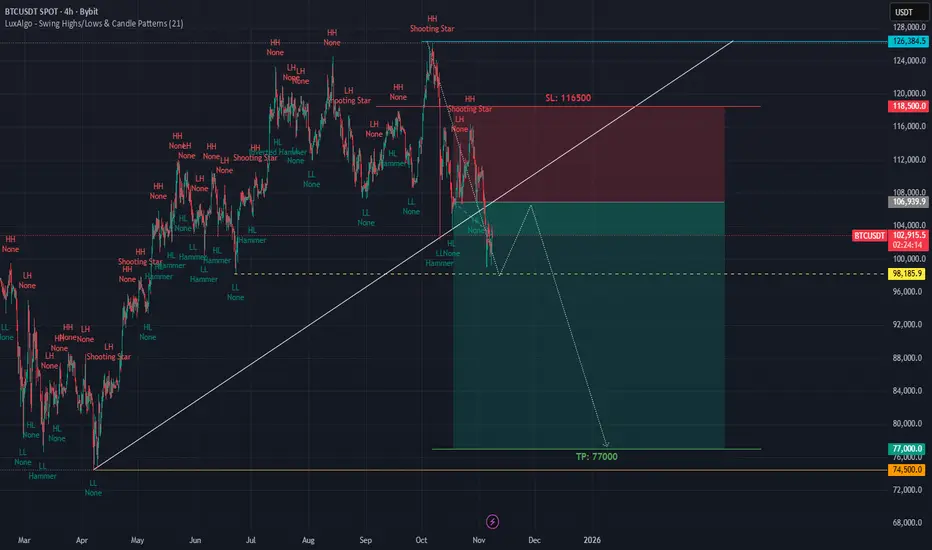
BTC/USDT - Make-or-Break Demand Zone: Reversal or Breakdown?Bitcoin is now entering one of the most critical zones of its mid-term market structure. After a sharp decline from the 126k peak, price is sliding into the major demand block at 83,000–78,000, a region that previously acted as a springboard for the rally earlier this year.
This 3D chart clearly highlights a structural decision point:
➡️ Hold this zone → strong bullish continuation potential
➡️ Lose this zone → the market opens room for a deeper macro correction
The next few candles in this zone will shape the direction of the entire Q4–Q1 trend.
---
Why This Yellow Block Matters
The 83k–78k zone is not random. It represents:
The origin of a previous rally, where institutional buying stepped in aggressively
A macro demand cluster, confirmed by multiple touches and consolidations
A liquidity “rebalance zone”, often retested before trend continuation
A structural higher-low area in the broader bullish cycle
If BTC wants to maintain a macro uptrend, this is where buyers must show up.
---
Market Structure & Pattern Description
The chart shows a macro uptrend, followed by a deep correction from the top.
Price is now approaching the key retracement zone of the previous expansion.
This area previously formed a base pattern before the 50k → 126k breakout.
Candles entering the demand zone show seller exhaustion signals, but no confirmation yet.
A reversal pattern here (engulfing, long-wick rejection, inside bar break) would be the first bullish signal.
A clean 3D close below 78k would convert this demand zone into supply — a strongly bearish structural shift.
This is the type of zone where trends are born or destroyed.
---
Bullish Scenario (Reversal from 83k–78k)
For the bullish thesis to remain valid:
🔥 Conditions Needed
Rejection wick or bullish engulfing on the 3D timeframe
Higher low confirmation on daily
Return above key short-term resistance around 92,400
🎯 Bullish Targets
TP1: 92,000 (short-term reclaim)
TP2: 110,000 (macro mid-range)
TP3: 126,000 (previous high → breakout zone)
If buyers defend this zone, BTC maintains its macro bullish structure.
❌ Bullish Invalidation
A 3D full-body close below 78,000
Followed by failed attempts to reclaim the zone
---
Bearish Scenario (Breakdown of 78k)
If price fails to hold the demand block:
🔥 Breakdown Confirmation
Strong 3D candle close under 78k
Retest of 78k–83k as resistance
Increasing selling volume
🎯 Bearish Targets
Target 1: 72,000 (major liquidity zone)
Target 2: 62,000 range
Target 3: 49,000 (macro support from prior cycle)
A breakdown here would confirm a macro correction, not just a pullback.
❌ Bearish Invalidation
Price quickly reclaims 80k–83k with momentum
Failed retest turns into a deviation
---
Trading Notes
This is a macro (3D) zone — be patient.
Let confirmation develop, avoid knife-catching.
Use wide stops; 3D signals require larger breathing room.
Watch volume:
Increasing volume near the bottom = accumulation
Increasing volume on breakdown = distribution
#Bitcoin #BTCUSD #BTC #CryptoMarket
#PriceAction #DemandZone #CryptoTA #BullishScenario #BearishScenario #MarketStructure #CryptoOutlook #MacroAnalysis

BTC/USDT THIS IS MY PLAN FOR BITCOIN!!!Bitcoin has been pretty weak in recent weeks.
However, we should have some targets.
Target number 1 by Sunday if the market closes above 50 EM the market will be pretty good and I won't be so bearish.
However, if the candle closes below EM, i.e. below $100,000, then I will expect it to hit the $87,700 levels.
The market needs attention.

BTC CRACK! UPDATE WARNING!!⚠️ BTC CRACKS — Officially in a Bear Market (-24%)
Bitcoin has now broken below $97,000, down 24% from its highs, officially entering bear-market territory.
I’ve been warning about this setup for months — not because I enjoy being bearish, but because the structure was screaming caution.
This isn’t a “buy-the-dip” moment or a garden-variety correction. We’ve hit a major technical and psychological level that could decide the next phase for the entire crypto space.
If this level fails, expect a chain reaction across risk assets — leverage, liquidity, and sentiment all roll over together.
It could be years before you see another uptrend. Note: This is not a short-term trade.
Stay sharp. The real test for crypto starts now.
Thank you ALL FOR getting me up to 5,000 followers!! ))
Click boost, follow, comment nicely for more authentic, no BS, raw analysis. Let's get to 6,000 followers. ))

We are NOT finished.Weekly close has come in and, as expected, BTC has closed above the band once again.
Since the start of this cycle, Bitcoin has had the following pullbacks:
September 2023: 21%
August 2024: 34%
April 2025: 33%
November 2025: 21%
Tell me, people—what has changed? Has Bitcoin done anything different from what it’s been doing all cycle?
NO!
Yet 95% of sentiment is extremely bearish. The other 5% who aren’t bearish are patting themselves on the back because they “called the top”—you know, the same “top” everyone is staring at, the same top that can be calculated using basic math from the last two cycles.
Since I joined this space, I have NEVER seen sentiment this bad after only a 20% pullback. Complete madness. The only time I saw emotion this raw was during the COVID crash.
This level of bearish sentiment is what you find at the BOTTOM of rallies, not the top.
The idea that the top is in just because of “cycle length” is invalid—especially when EVERYONE is thinking the exact same thing. It’s never that easy with Bitcoin.
Mark my words: it WILL rally above 200k in 2026, and everyone who sold this year will be buying back in higher. That’s the nature of these markets.
Every cycle, you have to stay grounded, stick to the technical data, and ignore all the noise.
The technical are still holding strong—we are NOT finished!

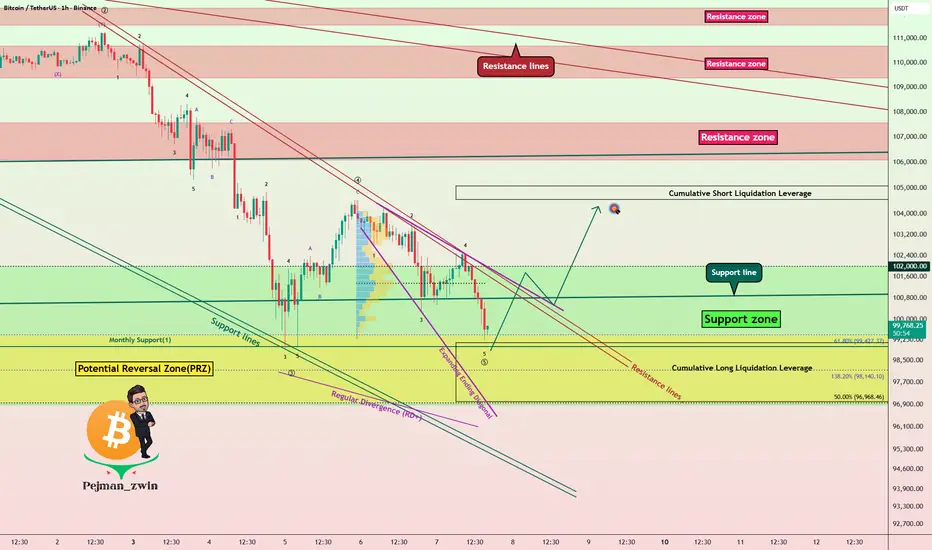
Bitcoin Bulls Defending $97K – Reversal Loading!Before diving into the Bitcoin analysis , it’s worth noting that Bitcoin has had a strong correlation with the SPX500 index ( SP:SPX ) in recent weeks. So, alongside analyzing Bitcoin, it’s a good idea to keep an eye on the SPX500 chart these days.
Currently, Bitcoin( BINANCE:BTCUSDT ) is moving in a Support zone($10200,980-$96,880) near a Potential Reversal Zone(PRZ) and a Cumulative Long Liquidation Leverage($99,145-$97,208) .
From an Elliott Wave perspective, it looks like Bitcoin is forming an Expanding Ending Diagonal to complete the microwave 5 of the main wave 5 .
Also, we can see a Regular Divergence(RD+) , which is a good sign of a potential reversal.
Given my expectation that the SPX500 Index will start to rise again, I also expect that Bitcoin will follow suit and could climb at least to around $104,200 .
Cumulative Short Liquidation Leverage: $105,074-$104,551
Stop Loss: $96,178
Please respect each other's ideas and express them politely if you agree or disagree.
Bitcoin Analysis (BTCUSDT), 1-hour time frame.
Be sure to follow the updated ideas.
Do not forget to put a Stop loss for your positions (For every position you want to open).
Please follow your strategy and updates; this is just my Idea, and I will gladly see your ideas in this post.
BTCUSD Volume Based SetupAn easy short long on BTCUSD based on volume taking advantage of SNR and SND

BTC will dump to $7600 follow my structure last month Oct 25BINANCE:BTCUSDT BTC I said on Oct 17, 2025 last month will dump to $7600, now new month in November 2025, look like follow my structure