BTC-----Sell around 104500, target 103000 areaBTC Contract Technical Analysis, November 6th:
On the daily chart, yesterday's close was a small positive candle, with a pattern of consecutive negative candles followed by a single positive candle. The price is below the moving average, and the accompanying indicators are in a death cross, indicating a clear downward trend. As previously mentioned, the weekly chart also shows a clear downtrend. Therefore, the strategy is to sell at higher prices and focus on the impact of news and data, avoiding counter-trend trades. On the hourly chart, yesterday's Asian session saw a price rebound from support, which continued into the day, but the momentum was weak and the price failed to break the high. Currently, the Asian session has seen a slight pullback without further continuation, and while the momentum is weak, it doesn't affect the overall trend. The European session is expected to see a further decline and breakout.
Today's BTC Short-Term Contract Trading Strategy:
Sell at the 104500 area, stop loss at the 105000 area, target at the 103000 area.
Btctrend

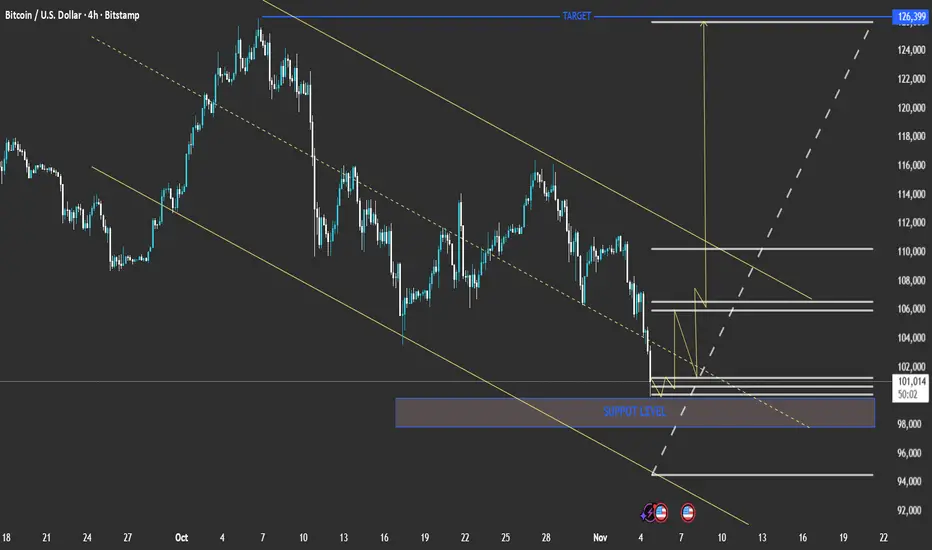
technical analysis of your Bitcoin (BTC/USD) 4-hour chartPair: BTC/USD
Timeframe: 4H
Current Price: ≈ 101,240
Trend: Downtrend within a descending channel
Main Zones:
Support Level: 98,000 – 100,000
Short-Term Resistance: 104,000 – 106,000
Major Target (Upside): 126,399
📉 Technical Outlook
Bitcoin continues to respect the descending channel drawn with parallel trendlines.
The price is now hovering near the lower boundary of the channel, close to the support level zone.
A potential bullish reversal may occur if this support holds, leading to a push toward mid-channel resistance (around 106,000).
📈 Bullish Scenario
If the support at 98,000–100,000 holds:
BTC could rebound toward 104,000 → 106,000 → 110,000.
A confirmed breakout above 110,000 may trigger a strong rally toward the main target of 126,399.
📉 Bearish Scenario
If BTC breaks below 98,000:
Expect further downside to 94,000 – 92,000, the next major demand zone.
This would confirm continuation of the descending channel trend.
⚙️ Summary
Aspect Bias
Trend Bearish (short term)
Key Support 98,000 – 100,000
Key Resistance 106,000 – 110,000
Long-Term Target 126,399 (if breakout occurs)
Short-Term Risk Break below 98,000 FPMARKETS:BTCUSD FPMARKETS:XLMUSD FPMARKETS:SOLUSD FPMARKETS:ETHUSD FPMARKETS:RPLUSD FPMARKETS:DOGUSD FPMARKETS:LTCUSD FPMARKETS:LNKUSD FPMARKETS:ADAUSD FPMARKETS:EOSUSD FPMARKETS:EOSUSD
BTC faces a crash, can it hold the $100000 mark?#BTCUSD BITSTAMP:BTCUSD BINANCE:BTCUSDT BITSTAMP:BTCUSD BINANCE:BTCUSDT
Affected by market news, BTC's hourly chart showed a large bearish candlestick, falling to a low of around 104000. Currently, regardless of the time frame, BTC has reached the lower Bollinger Band area, and all moving averages across different timeframes are trending downwards in tandem, with the MACD indicator showing a bearish crossover and increasing volume. There are no signs of a technical reversal yet, and in the short term, BTC still has room for further downward correction.
If 104000 is breached again, BTC may further decline to 102000-101000, or even the psychological level of 100000. It's only a matter of time, and the bulls will temporarily back down.
Therefore, if BTC rebounds to 105500-106500 in the short term, shorting BTC can be considered.

BTC/USDT — 1H Chart AnalysisTechnical Bias: Bullish Reversal Setup
Analysis Overview:
BTC is showing strong signs of a potential bullish reversal after retesting the key $99,000 support zone, which has historically acted as a high-volume demand area. The current structure suggests absorption of selling pressure with narrowing spreads and stable volume — a classic VSA accumulation signal.
Key Technical Insights:
Support Zone ($99,000 – $100,000): Price rebounded from this zone with visible buying tails and decreasing spread on down bars, indicating professional demand stepping in.
Resistance Zone ($114,000 – $115,000): Previous double-top area highlighted in green; this will be the next major resistance where profit-taking may occur.
Volume Behavior: Volume dropped during the last downward push, suggesting a lack of selling momentum — a bullish sign within VSA logic.
RSI Recovery: RSI bouncing from the oversold region confirms early momentum shift to the upside.
Trade Setup:
Buy Entry: Above $106,000 (confirmation of reversal structure)
Target Zone: $114,500 – $115,000
Stop Loss: Below $105,000 support
Risk–Reward Ratio: ~1:5, favoring long bias
Conclusion:
BTC holds a higher probability of upside continuation, supported by strong demand near support and weakening supply pressure. A sustained close above $106,000 will likely trigger a momentum rally toward the $115K resistance area.

Bitcoin BTC Bears Regain Control: Watching for a Short Setup 📊 Bitcoin Analysis (BTCUSD)
Currently, Bitcoin is showing clear bearish intent on the higher timeframes 🧭. After an extended period of range-bound price action, we’ve now seen a decisive displacement to the downside 💥 — a strong signal that sellers are taking control.
From here, I’ll be watching for a retracement back into equilibrium ⚖️ — the 50% level of the most recent swing — and will then look for signs of rotation and a break of structure 🧩 on the 30-minute chart to confirm a potential short setup 📉.
Patience is key here 🕰️ — I want to see price react efficiently to that retracement before considering entries.
⚠️ Disclaimer: This is not financial advice. Always conduct your own analysis before taking any trade.

#BTC/USDT – When the Bullish Wave Returns#BTC
The price is moving within an ascending channel on the 1-hour timeframe and is adhering to it well. It is poised to break out strongly and retest the channel.
We have a downtrend line on the RSI indicator that is about to break and retest, which supports the upward move.
There is a key support zone in green at 106775, representing a strong support point.
We have a trend of consolidation above the 100-period moving average.
Entry price: 107347
First target: 107742
Second target: 108525
Third target: 109246
Don't forget a simple money management rule:
Place your stop-loss order below the support zone in green.
Once the first target is reached, save some money and then change your stop-loss order to an entry order.
For any questions, please leave a comment.
Thank you.

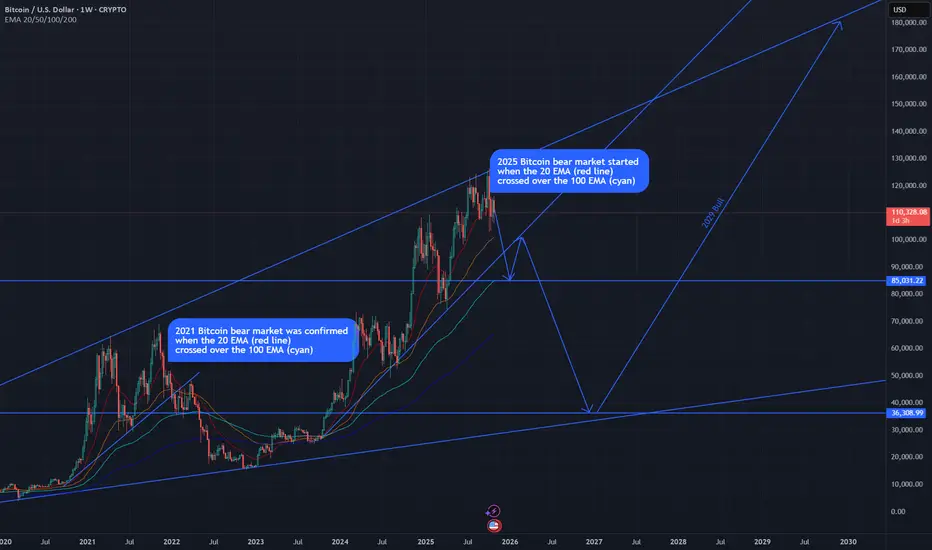
Bitcoin Beyond 2025, Path to 2029 Peak & 4 year cycleLikely bitcoin price movement for the rest of 2025 to the bear market bottom of 2026/27 and finally to the next bull peak of 2029
Check in early 2027 for accuracy

Bitcoin Beyond 2025, Path to 2029 PeakLikely bitcoin price movement for the rest of 2025 to the bear market bottom of 2026/27 and finally to the next bull peak of 2029
Check in early 2027 for accuracy
BITCOIN HIGH PROBABILITY SETUP SOON!!!🚨 BTC HIGH PROBABILITY SELL/BUY SETUPS 🚨
* Here We Can See Clearly The Next Potential Moves For BTCUSD Coming Hours/Days.
* Keep Your Eyes Close On Your Trading Positions.
* Happy PIP Hunting Traders.
FXKILLA.

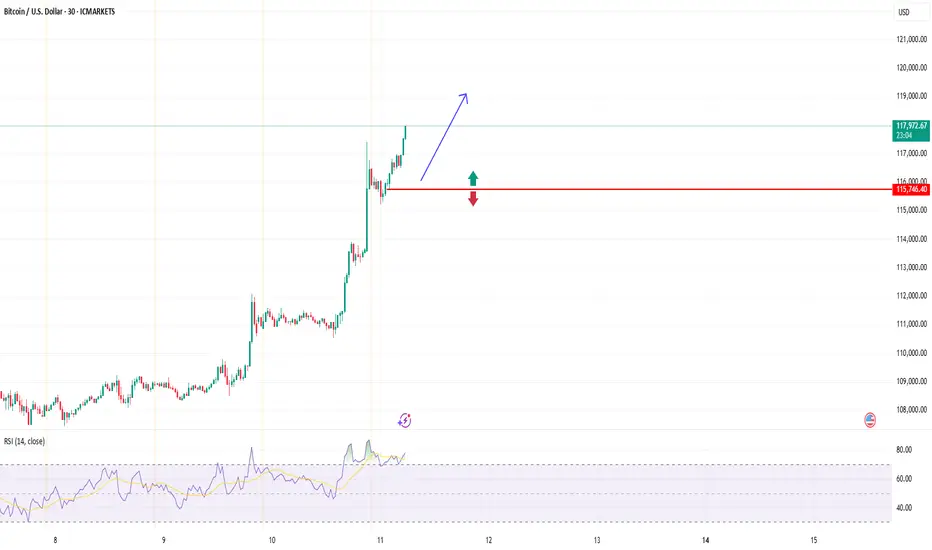
BTCUSD (Bitcoin): Forex Technical AnalysisDate: 11 July 2025
Momentum: Up
First Scenario : long positions above 115,706.14 with targets at 117,269.52, 117,904.51 and 118,513.05
Second Scenario : short positions below 115,706.14 with targets at 114,544.35, 113,774.89 and 113,053.39
Comment: RSI - Bullish.
Supports and resistances :
118,513.05 **
117,904.51 *
117,269.52
116,747.25 - Last price
114,544.35
113,774.89 *
113,053.39 **
Market volatility, why I dare to be bullish on BTC#BTCUSD BITSTAMP:BTCUSD BINANCE:BTCUSDT
The BTC market has been declining since yesterday's US session, with a sharp drop following Powell's hawkish comments, hitting a low of around 106,500. Institutional trading activity has decreased in the short term, suggesting a deliberate wait-and-see approach, anticipating further price corrections before re-entering the market. Therefore, do not blindly participate in trading in the short term.
The current BTC market may seem bustling, but it is actually rife with undercurrents. A new direction will only be established when sentiment reaches its peak and volatility subsides. Perhaps the next real starting point will not be in the current clamor, but after the cheers of retail investors subside. Pay attention to the performance of the downward channel support level of 160,000-104,500. If it pulls back to this range, you can consider establishing a small long position.

Bitcoin Daily Analysis – October 30, 2025🚀 Welcome to another Bitcoin analysis!
Yesterday, the interest rate was cut by one step, just as everyone expected — and that’s definitely a positive signal for Bitcoin. 💪💰
But why did we see a drop? 📉
The world is still anxious about the U.S.–China tariff situation, and those concerns intensified after Powell’s comments, suggesting the December rate cut isn’t guaranteed.
Right now, the market is in a fear phase 😨 — meaning both good and bad news can move prices sharply.
Stay calm and patient, and don’t let the candles scare you. 🕯️🧘♂️
Overall, conditions still favor a bullish continuation, and unless major negative news comes from the U.S. or China, we could soon start the final leg of this uptrend. 📈🔥
The $106,000–$102,000 zone is showing strong demand, making it a potential entry area — but always manage your risk and capital wisely. ⚖️
Remember: every decision in this part of the market should follow your predefined scenario — never trade emotionally or react impulsively. 🧠💼
Disclaimer:
This content is for informational purposes only and does not constitute financial or investment advice. © DIBAPRISM
Larry D.Kohn

BTC/USD: Wave 5 Launch or Wave Cycle End?BTC/USD: Wave 5 Launch or Wave Cycle End?
📈 Weekly Scenarios
Bullish scenario: Price holds above ~$110,000, breaks through ~$120,000 → wave (5) strengthens → possible rise to ~$135,000-140,000.
Consolidation: Price trades between ~$110,000 and ~$120,000 without a formed structure, the market is paused.
Bearish scenario: Break of support at ~$110,000 with volume → corrective wave A-B-C → possible decline to ~$100,000-105,000.
✅ Conclusion
On the weekly timeframe, BTC/USD is at a key turning point: either an upward impulse (wave (5)) or the beginning of a major correction.
Holding support at ~$110,000 is the basis for a bullish scenario.
A breakout of resistance at ~$120,000 is a signal for continued growth.
A breakout below ~$110,000 is a signal for a change in structure.

BTC-----Sell around 113200, target 111700 areaOctober 29th BTC Contract Technical Analysis:
Today, on the daily chart, yesterday closed with a small bearish candle, indicating a continuous decline. The price remains at a high level, and the accompanying indicators show a golden cross. Although the current decline is significant, the price hasn't broken down further, suggesting a range-bound trading pattern. Therefore, our trading strategy should be to sell high and buy low within this range; the high is around 116500, and the low is around 107000. On the hourly chart, the price was under pressure during the US session and continued to decline during the Asian session. Currently, there is a slight rebound, but the trend remains bearish. Therefore, we should expect a further decline and a break below the lows during the European session.
Today's BTC Short-Term Contract Trading Strategy:
Sell at 113200, stop loss at 113700, target 111700.

BTC/USDT: Symmetrical Breakout and Channel ContinuationHi guys!
Bitcoin has successfully broken out of a symmetrical triangle, confirming a bullish continuation pattern after several days of consolidation. The breakout was followed by a clean retest of the triangle’s upper boundary, which now acts as support.
Currently, the price is moving inside a rising parallel channel, showing a healthy bullish structure with higher highs and higher lows. As long as BTC maintains above the midline of this channel, the short-term trend remains upward.
In the coming sessions, price may continue oscillating within this ascending channel, forming a series of higher lows before reaching the next key resistance around $118,682 , and potentially extending toward the triangle’s measured target at $122,56 7.
On the downside, a confirmed close below the channel’s lower line would be the first sign of weakening momentum and could lead to a deeper pullback toward $112,000–$113,000.
Important levels:
Support: $114,000 / $112,500
Resistance: $118,682 / $122,567
Trend: Bullish above $114,000

Bitcoin Analysis - Bulls vs ResistanceBitcoin triggers have been activated just as expected. Personally, I don’t think it’s a bad idea to hold current positions — we’ve got some solid entry points already.
📈 Bitcoin is showing a bullish trend, and as we approach the upcoming interest rate decision, momentum could build even more.
Above the $116,000 zone, we could see a long trigger, but personally, since I already have two open entries from lower levels, I won’t be adding new ones for now.
💡 If the interest rate is lowered, there’s a chance we’ll see a few red candles initially, but overall, it should be positive for the crypto market.
Right now, Bitcoin is facing a key resistance zone — breaking above it could confirm a bullish continuation on higher timeframes. 🚀
Disclaimer:
This content is for informational purposes only and does not constitute financial or investment advice. © DIBAPRISM
Larry D.Kohn

BTC has a bright future and is bullish with no regretsThanks to the positive news of the easing of Sino-US trade tensions over the weekend, BTC has gradually recovered from the severe consolidation it has experienced repeatedly since the brutal crash on October 10. This modest recovery appears to confirm the continuation of its upward trajectory.
From the perspective of technical indicators, the MACD golden cross continues to increase in volume and is always above the signal line, further strengthening the bullish sentiment of BTC. At the same time, from the 4H chart, the Bollinger Bands have expanded significantly as prices have risen, indicating that short-term volatility has increased. The fact that BTC prices have remained largely near the upper Bollinger Band suggests that, at this point, the market is more likely to continue its upward trend than to reverse.
However, it is worth noting that the small cycle is trending downward, and the divergence between RSI and price suggests that there may be profit-taking in the short term. Therefore, in the short term, BTC may face a small pullback to retest support before rising.
Pay attention to 114000-113000 below. If it retreats here, you can consider going long on BTC with a light position, with the target at 115000-117000.

BTCUSDT TradeI when trading in IG:BITCOIN try come to breakeven in big candle for again entry buy or sell.
But you need fix target or trailing stop on new swing in profit.
Please have risk management.

Inside the channel and Flies.If you look at market patterns and Bollinger bands, price always goes from high volatility to price discovery, tightens. Market shows clear direction, ie 🟢 or 🔴.
The same when using longterm charts, they fluctuate and you can almost find where the important channel gonna be.
It's psychology.
85% bullish. 15% it fails, imo.:)

technical analysis for your BTC/USD chart:Pair: Bitcoin / U.S. Dollar (BTC/USD)
Current Price: around $111,628
Structure: Ascending channel pattern
Key Zones:
Resistance Level: $112,000 – $112,500
Target Level (Support): $106,572
📊 Technical Analysis
Trend Structure:
BTC/USD is moving within a rising channel, showing short-term bullish momentum.
Price is now approaching the upper boundary of the channel and a major resistance zone ($112,000–$112,500).
Resistance Reaction Expected:
This zone has previously rejected price, so sellers may re-enter around this region.
If price fails to break above the resistance, a bearish correction is likely.
Bearish Scenario (Primary Expectation):
A potential reversal from resistance is indicated on your chart.
Confirmation: A strong bearish candle or break below the midline of the channel.
Downside target: around $106,572, aligning with previous demand/support and the lower boundary of the broader channel.
Bullish Scenario (Alternative):
If BTC/USD breaks above $112,500 with volume, price could extend toward $113,500–$114,000 before any correction.
⚙️ Trading Plan (Summary)
Direction Entry Zone Stop-Loss Target
🔻 Short (Sell) 112,000 – 112,500 Above 113,000 106,600
🔺 Long (Breakout) Above 112,500 (confirmed) Below 111,800 113,500 – 114,000
🧩 Technical Indicators (Implied)
Trend Channel: Uptrend but nearing exhaustion.
Volume: Likely decreasing as price nears resistance (sign of weakening momentum).
Market Sentiment: Short-term bullish → potential reversal zone ahead. RUS:SBER RUS:VTBR RUS:LKOH RUS:ROSN RUS:MOEX RUS:PLZL RUS:T RUS:NVTK RUS:AFLT RUS:SMLT

Will Btc bounce off this support?Btc bounce incoming off support? If not, and support is broken... long way down to 85K.
Too soon for concern, but Btc is currently bottom feeding off my lowest support.
Followers of my charts would Know that "strangely accurate" calls have been made throughout Btc's recent months worth of price action. I anticipated this recent low and expressed my concens about this dump to a lower low. But I wish I knew how low and how long Btc stays in this lower range.
What I do know is that the "3 Red Week Down Rule" warned us that this lower low was coming. So now is a way better time to concider this asset, than at the recent top!
-Good luck

BTCUSD SHORT Jan.1 You try, 2026. jan 1. Short position
Target 1
Target 2
Target 3
check out my profile!
Easy!

Pay attention to the Payment Innovation ConferenceOn October 21, the Federal Reserve will hold a payment innovation conference that could rewrite the industry landscape, inviting top cryptocurrency companies such as Chainlink, Circle, and Coinbase to its Washington headquarters. This conference precisely targets the core players in the entire chain of stablecoins, infrastructure, and trading terminals. However, it is worth noting that if the meeting only discusses the direction without details, the BTC market may pull back in the short term.
Looking at technical indicators, the short-term MACD has broken through the signal line, reflecting a bullish change, but the divergence signal of the RSI may foreshadow a short-term pullback. Based on the above information, BTC is likely to experience a short-term correction followed by an upward trend. Focus on the lower levels of 109,700-109,300 in the short term, with key support at 107,500-106,500. Above this level, focus on the short-term resistance levels of 111,000-112,000. A break above this resistance level could lead to a move towards 114,000-115,000.
BITSTAMP:BTCUSD
