BTC/USD Long Setup: RBR Zone Retest After Channel BreakoutTechnical Structure
Rising Channel (Highlighted in Red):
Price was moving within a bullish channel.
The channel was broken to the upside, indicating strong bullish momentum.
RBR Zone (Rally-Base-Rally):
A demand zone marked in red.
This area acts as a support zone where price is expected to bounce after a pullback.
It's the ideal entry area according to this strategy.
Current Price:
BTC/USD is trading around 117,910.63.
The price has just broken out of the channel and is expected to retest the RBR zone.
🎯 Trade Setup
Label Price Level Description
Entry Point 116,772.43 Ideal buy level after retest of RBR zone.
Stop Loss 116,077.82 Below the RBR zone. Gives room for a fakeout.
Target Point 120,013.92 Profit target based on the projected move.
📊 Risk to Reward Ratio (RRR)
Let's calculate the approximate Risk:Reward:
Risk: 116,772.43 - 116,077.82 = 694.61 points
Reward: 120,013.92 - 116,772.43 = 3,241.49 points
✅ Risk:Reward ≈ 1:4.67, which is excellent.
🔄 Expected Price Action
The chart suggests the following scenario:
Price breaks out of the bullish channel.
It retraces back into the RBR zone.
It finds support near the entry level.
A bounce follows, pushing BTC toward the target level of ~120,000.
📌 Summary
✅ Bullish setup after breakout from a rising channel.
✅ RBR demand zone suggests strong support at the entry.
✅ RRR is favorable (~1:4.67) — a good reward for the risk taken.
⚠️ Risk: If price drops below the stop loss zone, the trade idea is invalid.
Btcusdanalysis

ANFIBO | BTCUSD in my view todayHello guys! It's me, Anfibo.
Here is my Strategic and Market Sentiment Perspective :
I agree with the view that BITSTAMP:BTCUSD is currently in a compression phase. The market seems to be waiting for a catalyst (potentially economic data or macro news) to break out of this consolidation zone.
>>> Key observations:
Trading volume has shown signs of decline over the past few sessions, reflecting investor sentiment of waiting on the sidelines rather than taking strong action.
Funding rates and overall market sentiment remain positive but not overly euphoric, which is a healthy signal supporting the case for a sustainable upward move.
On the Daily timeframe, the primary trend remains bullish, and the current sideways movement appears to be a technical correction within the broader uptrend.
>>> Strategic approach for today:
> For short-term traders: consider accumulating small positions around the support levels of 115,200 – 114,400, with stop-loss orders set below 114,000 to manage downside risk.
> For medium-term investors: it is more prudent to wait for a confirmed breakout above the 117,000 – 118,000 resistance zone before scaling into larger positions, targeting the 120,000 – 123,000 levels.
Have a beautiful day!

What happened to the BTC pump? Been hearing about the BTC pump etc., but it was already priced in. Starting to cross key indicators DOWN. Now, we are seeing that the market has hit a ceiling and gravity is strong (correction). Wish all the crypto bros with lambos all the best, but it's going to cross 110k then 75k as whales leave and protect their liquidity (at least, what's left).

Bitcoin BTC price analysis FOMC Fed rate🚀 CRYPTOCAP:BTC price is rising, while altcoins remain silent.
What happens tomorrow when the Fed announces its new rate? 🤔
📊 Expectations:
98% believe in a -0.25% cut
2% expect -0.5%
and no one believes it will stay unchanged at 4.5%
That’s why the market has already priced this in. But tomorrow, once the official decision comes — everything could flip ⚡️
📉 The chart looks like chaos to most, but a "trained eye" sees harmony: candles moving level to level.
🔑 Key zones for OKX:BTCUSDT :
Upper channel boundary: $117,800 – $118,000 (only breakable on massive volumes).
September is statistically weak. It opened at $108K, that’s the “zero point”. Logical scenario — dip to $102K.
😬 Worse scenarios:
$96,500
GAP close at $91,600 (but you’ll roast us for this one 😂).
❓Your take: By the end of September, will #Bitcoin be above $108K or below?
______________
◆ Follow us ❤️ for daily crypto insights & updates!
🚀 Don’t miss out on important market moves
🧠 DYOR | This is not financial advice, just thinking out loud.

TA says ~40k by Sep 2026. Trend- base fib time between halving suggesting lows around Sep2026. We are in the top. Stop dreaming about 200K for this cycle.

BITCOIN UPDATEHello friends
According to the open cycle, we can say that our trend is bullish and is in a channel, but a resistance has stopped it, which it has hit twice. Now we have to see if this resistance will finally be broken or if the price will continue to suffer below this resistance.
If the price breaks the resistance, it will move to the specified targets.
Trade safely with us.

BITCOIN NEXT MOVE REVEALED!!!!! (this will make you scream) Yello Paradisers! In this video, we went through multiple timeframes as professional traders. We assumed things to analyze in Elliott Wave and other important indicators and advanced technical analysis tools. What's the next movement going to be with the highest probability!
Paradisers! Keep in mind to trade only with a proper professional trading strategy. Wait for confirmations. Play with tactics. This is the only way you can be long-term profitable.
Remember, don’t trade without confirmations. Wait for them before creating a trade. Be disciplined, patient, and emotionally controlled. Only trade the highest probability setups with the greatest risk to reward ratio. This will ensure that you become a long-term profitable professional trader.
Don't be a gambler. Don't try to get rich quick. Make sure that your trading is professionally based on proper strategies and trade tactics.

BTCUSD – Key Levels & Outlook Bitcoin trades near $115,445 as mBitcoin trades near $115,445 as markets weigh the upcoming FOMC rate decision that could spark broad risk-asset moves.
Key Levels
Resistance (1H): $115,668 – 116,318. A clean breakout above this zone could open the door to $116,600+.
Intermediate Zone: $115,532 – 115,477 around the 30m FVG (fair value gap).
Support (1H): $115,100, with deeper bids around $114,744 – 114,376 and a final line near $114,134.
Scenarios
Bullish: A dovish Fed or rate-cut surprise could lift BTC through the 1H resistance toward $116,600–117,000.
Bearish: If the Fed stays hawkish or signals fewer cuts, watch for a slide toward $115,100 and potentially $114,700.
Fundamentals
The FOMC decision (8 pm UTC-2) is pivotal. A rate cut would generally weaken USD liquidity costs and may boost crypto demand.
Risk sentiment is key—BTC often mirrors equity volatility during major Fed events.
⚠️ Plan: Expect heightened volatility around the announcement; confirmation of direction likely comes after the Fed press conference.
This is market commentary, not financial advice.
Greetings,
MrYounity

Bitcoin - H1 Accumulation and Possible Divergence in Play📢 NFX Market Update – COINBASE:BTCUSD
BINANCE:BTCUSD Currently in a strong support zone with major accumulation in play. Divergence formation in sight around support indicating high possibility for a bullish move soon
📊 The key question still remains: Will this support hold, or will price dip lower?
💬 Share your thoughts in comment below

Will Bitcoin break new highs?Bitcoin has seen no major market moves. Overall, the ascending channel remains intact, and there seems little more to elaborate on. We maintain our previous view: exchange time for space.
Key Resistance: The $116,800 level has become the main battlefield for bulls and bears. If it breaks through strongly, the short-term target will look toward $118,000 or even $120,000.
Key Support: The $114,400 level is the first line of defense below; a break below this level may lead to a retracement to $113,200.
If you agree with my views, please give me a thumbs up. Thanks for your encouragement and support.

BTC - WEEKLY OUTLOOK 🚀 #BITCOIN - Weekly Price Update 🚀
Trend: Bullish on the monthly chart, still marching higher!
Weekly outlook: The charts are flashing a bull‑continuation signal, but we’ll need next week’s candles to lock it in.
Daily vibe: Neutral territory.
Key daily resistance zones:
🔹 118,500 $
🔹 120,000 $
🔹 123,000 $ – 123,500 $
Right now the bulls dominate above 107k $ and 100k $. If we keep consolidating there, a fresh all‑time high could erupt soon.
Short‑term forecast: Expect a few sideways days with occasional rejections 📉.
My take:
🔸 A retest around 112,500 $ –-112,000 $ looks likely next.
🔸 For a solid long‑term play, we need a weekly candle closing above 120,000 $ backed by strong buying volume, that’s the green light for the next big upward wave!
🌐 #ALTS - Altcoin Market
With Bitcoin holding steady above the 110k $ mark, altcoins stand to gain from the added stability and resilience.
💡 Stay tuned, keep those alerts on, and ride the momentum!

BTCUSD HOURLY IDEA FOR, 17TH SEP, 2025.As usual, Price did it thing yesterday as it invalidated our step-up by moving back up and is currently trading around 117,000+ above a balance area within the range from 114,000 - 116,000. Price trades currently at 117,000 within the London open, and on a short retracement downward as we watch if the price is going to stay above the balance or go back into the previous range.

Fed rate cut in focus: Bitcoin eyes new ATHFed rate cut in focus: Bitcoin eyes new ATH
Markets are on edge ahead of today’s Fed decision, with a 25 bps cut to 4.1% widely expected. Traders see this as fuel for risk assets, though surprises could trigger sharp moves. Bitcoin leads the pack, backed by $230M ETF inflows and growing dominance over alts. Still, strong sell walls at $117K–119K signal heavy resistance.
Support remains firm at $111K–113K, where fresh demand continues to absorb supply from large holders. Momentum indicators show strength, similar to Q2 when BTC rallied from $105K to $120K.
Altcoins stay in the background: ETH faces outflows and struggles to hold above $4,500, while SEC delays on new ETF applications weigh on sentiment. Other majors like Solana and Ripple could see inflows if BTC stabilizes, but downside risks remain high if expectations disappoint.

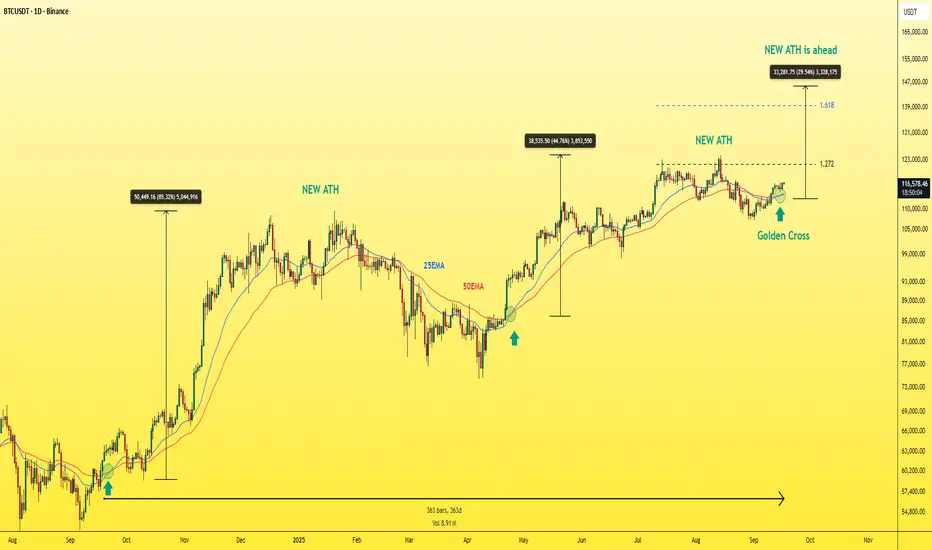
BITCOIN - New ATH is ahead!Over the past year — exactly 363 days — Bitcoin has only formed the Golden Cross pattern 3 times.
If you look at the chart, you’ll notice that each time this pattern appeared, it triggered a strong bullish rally leading to a new ATH (all-time high), as clearly shown.
And right now, Bitcoin is forming this exact pattern again on the daily timeframe.
For clarity:
- The Golden Cross happens when a smaller EMA (like the EMA 25) crosses above a larger EMA (like the EMA 50) .
This crossover is a classic bullish signal often marking the start of major upward moves.
based the fibonacci The next expected ATH for BTC is projected around 140K
Best Regards :
Ceciliones
BTC 2017 All Over Again? Is It About to Go Parabolic?Forbes just ran with a headline about a Bitcoin “death spiral.” The wording might be sensational, but the risk they are pointing to is real. It is sitting inside Bitcoin treasuries.
Companies like MicroStrategy (NASDAQ:MSTR) and Nakamoto are being packaged as safe institutional gateways to Bitcoin. The truth is, they are not just buying and holding. They are borrowing, issuing debt, and selling shares to continue buying more BTC. That structure works brilliantly when the price is running higher. When BTC pulls back, the debt remains while the value of the collateral falls. If their share prices sink at the same time, they cannot raise fresh equity. That is when forced selling begins, and the pressure feeds on itself.
This is where the LUNA comparison fits. LUNA collapsed because the system relied on TWAP buying to keep its peg alive. It needed a constant programmed demand. The second confidence cracked that demand disappeared, the mechanism broke, and the whole structure fell into a reflexive death spiral. Bitcoin treasuries carry a similar fragility.
They look strong on the way up because debt and dilution keep the system fed. But if one cracks, others will likely follow, and the forced selling could cascade through the market. It is history repeating in a new form.
The Cycle Overlap
Now layer in the cycles. December 2024 marked the rollover of the 8-year stress cycle in traditional markets. That signal has already triggered. But treasuries are not following that rhythm. They are moving in line with Bitcoin’s 4-year cycle. Every halving is followed by a strong run, a cycle top, and then a correction. That puts the real pressure point into December 2025. If treasuries hit the wall at the same time Bitcoin’s bull cycle peaks, the overlap could accelerate a blow-off followed by a brutal correction.
The 8-Year Stress Cycle (Traditional Markets)
2000 → Dot-com bubble rollover. Fed started cutting rates, but equities crashed hard into 2001–2002.
2008 → Global Financial Crisis. Fed slashed rates aggressively, but markets fell into a full-blown meltdown before recovery. 2009 was the brutal washout before recovery.
2016 → Global growth scare, China devaluation, Fed hiking cycle wobble. Markets pulled back, stress showed, then liquidity stepped in.
2024 → December rollover. The signal of cracks returning: inflation sticky, rate cuts being prepped, credit stress building, and leveraged players under pressure.
The pattern - every 8 years, traditional markets hit a rollover point where stress shows up, liquidity shifts, and the system resets.
The 4-Year Bitcoin Cycle
2013 → Top after 2012 halving, deep correction.
2017 → Top after 2016 halving, brutal correction in 2018.
2021 → Top after 2020 halving, correction in 2022.
2025 → Halving cycle points to a top window in December 2025, with correction risk into 2026.
Where Tether Fits
Tether (CRYPTOCAP:USDT) is not just minting stablecoins. It has become one of the largest buyers of short-dated US Treasuries on the planet, with more than 120 billion US dollars worth on its books.
In calm conditions, that makes sense, they clip yield and backstop redemptions. But if markets crash and liquidity dries up, redemptions spike. To meet them, Tether must raise dollars by selling or repo’ing those T-bills. Normally, that is seamless. In stress, selling can add to liquidity drains at the edges of both the Treasury market and crypto. If redemptions surge at the same time treasuries are being forced to sell BTC, you get a double liquidity squeeze.
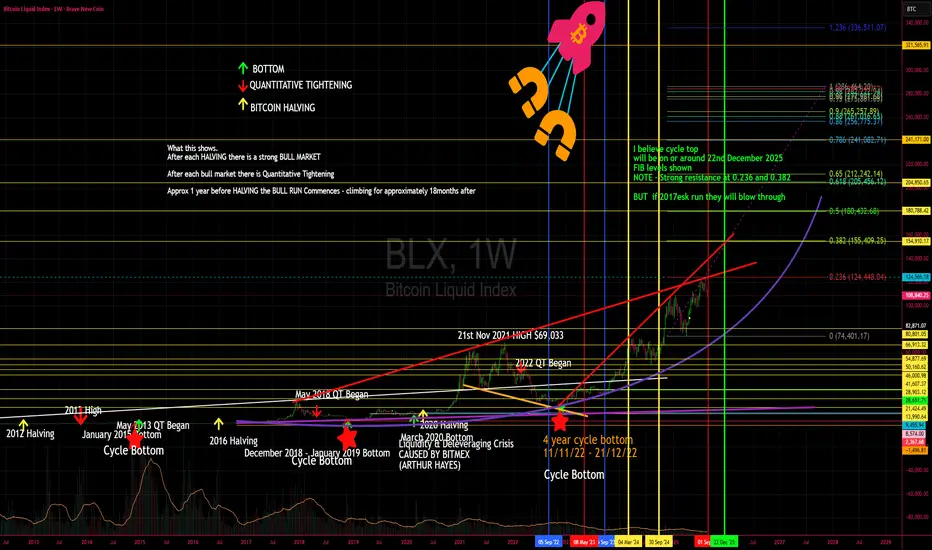
The Technical Picture
Look at the Fibonacci structure on the chart. The key levels line up with what could be a wave 3 of 3 in Elliott Wave terms — the most explosive part of any trend. That explains the sharp upside move this year. It is powerful, but it is also the phase where leverage and euphoria get stretched the furthest. If this lines up with treasuries cracking and Tether redemptions spiking, the volatility on both sides will be extreme.
2016–2017 vs 2024–2025
In 2016, traditional markets were rattled by China’s devaluation, an oil price collapse, and Fed policy missteps. Liquidity reset the system. For Bitcoin, that reset coincided with the halving and set up the most explosive run in its history. By 2017, equities were making new ATHs and Bitcoin went parabolic to nearly $20k before the brutal 2018 correction.
Now in 2025 we are seeing the same setup. Stress triggered in December 2024, but liquidity is flowing back. Markets everywhere are hitting new ATHs. Bitcoin has surged and is acting like it is in its 2017 phase right now, the blow-off leg of the 4-year cycle.
That puts the risk squarely into December 2025 for a cycle top followed by a correction.
The Cycle Top Target
I believe the cycle top for Bitcoin will land on or around 22nd December 2025.
The Fibonacci levels line up cleanly with this window:
Strong resistance at 0.236 and 0.382.
Under normal conditions, these zones would cap the move, but if we are truly in a 2017-style run, price can blow straight through them in a parabolic surge before the eventual correction. Fibs left on the chart for reference.
Key points
BTC treasuries are leveraged and debt-loaded.
Many treasuries exist, not just one, so cascades are possible.
December 2024 = 8-year rollover in traditional markets.
December 2025 = 4-year BTC cycle top window.
Tether can flip from stabiliser to amplifier if redemptions rise.
Fibonacci shows a potential wave 3 of 3, explosive but unsustainable.
2025 mirrors 2017: markets at ATHs, Bitcoin in parabolic mode.
Target: 22nd December 2025 as the likely top.
Stop losses and capital protection are critical.
It looks like BTC 2017 all over again.
The parabolic phase may not be finished yet, but the closer we get to December 2025, the sharper the risk of a brutal correction. This is not Bitcoin dying. This is a test of leverage and liquidity. If treasuries and Tether both get squeezed into the cycle top, the correction could be brutal. But as always, it will clear the field for the next 4-year cycle if you survive the next brutal 2026 BEAR Market.
Thanks for Reading, and please let me know your thoughts
<3 Lisa
ANFIBO | BTCUSD on 09.17.2025 to 09.21.2025 I guess ???Hello guys, Anfibo's here! 👋
I think BITSTAMP:BTCUSD is bullish on the uptrend channel and still holding strong without any break. BTC may retest the support zone of $111.000 and re-reach the resistance levels of $123.000 and $127.000, and possibly up to $135.000.
Here's my setup:
✅ BUY SCALP: 110 - 111, SL 107, TP 122 - 126
❌ SELL SCALP: 126 - 128, SL 130, TP 120 - 114
Wishing my followers all the best <3

UPDATES ON BITCOIN.As previously stated, Bitcoin is respecting structure and direction based on previous analysis, which suggests sellers are still in control, but in the short term, as we are headed further downwards, keep watching! {Not Financial Advice, trade responsibly}

Can Bitcoin Still Rise to 120,000?The Bitcoin market is currently in a range-bound consolidation phase, with no clear overall trend breakout. Yesterday, the price once surged above the 116,000 mark, but failed to hold this position, and then quickly fell back into the oscillation range, forming a typical "false breakthrough" trend on the technical side. This phenomenon clearly indicates that the market still faces strong selling pressure at high levels, and bullish momentum to push prices upward is somewhat insufficient, making it difficult to break out of the volatile market in the short term.
From a macroeconomic perspective, the window for the Fed to cut interest rates is approaching, and the market is in the process of digesting policy expectations, which makes the current market more characterized by "accumulating strength and waiting" - both bulls and bears remain relatively cautious, and the game intensifies near key points, waiting for clear policy signals or capital flows to break the balance.
By observing the daily level pattern, it can be found that the market has recently shown a healthy volume structure of "large volume rise and small volume pullback". At the same time, the lower edge support of the rising channel formed in the early stage is still valid, the price pullback has not fallen below the key support level, and the overall upward trend framework has not been destroyed. Based on the above analysis, we still maintain the original strategy unchanged, continue to hold the existing long positions, and adhere to the operating idea of "trading time for space" - not being disturbed by short-term false breakthroughs or shock fluctuations, patiently waiting for the market to complete accumulation and clarify the direction, and then seize trend opportunities.

BitCoin $BTC weekly demand from $110,500 is playing out wellBitCoin CRYPTOCAP:BTC weekly demand from $110,500 is playing out well. Trying to reach the resitance level overhead and hopefully break all-time highs.

BITCOIN PREDICTION: NOBODY is EXPECTING THIS!!! (this will hurt)Yello Paradisers! In this video, we are going through multiple timeframes. We are taking a look at the CME futures gap that has closed. As professional traders, we are going through the ultra-high timeframe chart I'm sharing with you, including the channel reclaim and retest, the bearish divergence, and the decrease in volume. On a high timeframe chart, I'm sharing with you the zigzag.The possible start of the impulse is now in the secondary wave. The bearish divergence means we need to wait for a cross, a shooting star candle on the daily, and nice volume as well. If we look at the medium timeframe, we are seeing the bearish divergence, plus the cross, plus the resistance, the Elliott wave, the shooting star, and the double top formation.
Paradisers! Keep in mind to trade only with a proper professional trading strategy. Wait for confirmations. Play with tactics. This is the only way you can be long-term profitable.
Remember, don’t trade without confirmations. Wait for them before creating a trade. Be disciplined, patient, and emotionally controlled. Only trade the highest probability setups with the greatest risk to reward ratio. This will ensure that you become a long-term profitable professional trader.
Don't be a gambler. Don't try to get rich quick. Make sure that your trading is professionally based on proper strategies and trade tactics.

Bitcoin Next Step Towards LiquidityI guessed a little wrong with the time. But the probability theory works as usual. Because the thoughts of the market maker cannot be guessed more accurately.

Bitcoin Price’s Grip on $115,000 Weakens—Here's the RiskBitcoin is trading at $114,770, slipping below the $115,000 support level in the process. Should bearish sentiment persist, BTC may fall further, potentially testing the uptrend line that has supported its rise since the start of the month. This would mark a crucial point for investors.
If selling pressure intensifies, Bitcoin could struggle to hold $115,000 as support and slide toward $112,500. This would represent a critical setback, reinforcing the ongoing distribution phase observed among holders and limiting near-term upside potential for BTC.
On the other hand, if Bitcoin absorbs the selling pressure and regains momentum, reclaiming $115,000 as support could trigger another rally. In this case, BTC would target $117,261 in the coming days, reaffirming its bullish outlook and reinforcing investor confidence.

Is BTC affected by SELL the news?Analysis of BTC:
BTC is fluctuating around the 114k – 115k range, which is an important equilibrium zone. If buying pressure holds strong, the price could move toward the 118k resistance area – a key level that will determine the upcoming trend.
• Scenario 1: If BTC successfully breaks above 118k, the uptrend will be reinforced, with the next target at 123k – 124k.
• Scenario 2: If rejected at 118k, the price will likely retest 112k – 110k before recovering.
Summary: The overall trend still leans bullish, but 118k is the crucial resistance zone to watch closely in order to confirm the next direction.
