Bitcoin - Post-Breakout Compression at the Gate of Fibo - 0.786.⊣
⟁ BTC/USD - BINANCE - (CHART: 1D) - (Aug 14, 2025).
◇ Analysis Price: $118,876.69.
⊣
⨀ I. Temporal Axis - Strategic Interval - (1D):
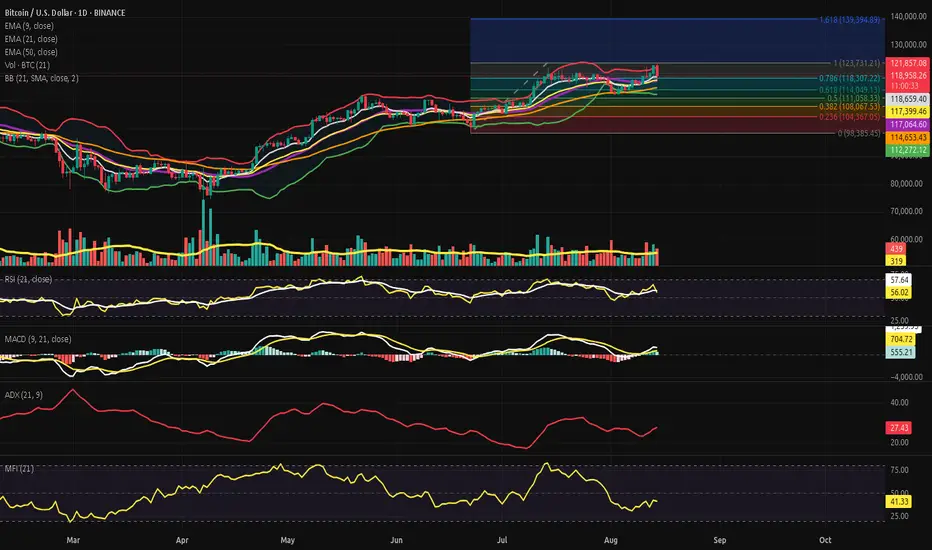
▦ EMA9 - $118,643.08:
∴ Price has pulled back toward the EMA9 after peaking at the recent (ATH of $123,731.21);
∴ Current positioning above EMA21 and EMA50 keeps the short-term trend intact despite the intraday retracement;
∴ EMA9 slope remains positive, signaling residual bullish momentum.
✴️ Conclusion: Short-term dynamic support intact; breach would increase pressure toward EMA21.
⊢
▦ EMA21 - $117,392.05:
∴ Serves as the first significant swing-support layer in the daily structure;
∴ Distance between EMA9 and EMA21 is narrowing due to today’s sell-off;
∴ Sustained closes below EMA21 would threaten the current daily uptrend.
✴️ Conclusion: Structural pivot for sustaining the bullish daily cycle.
⊢
▦ EMA50 - $114,650.23:
∴ Represents medium-term equilibrium and major market memory zone;
∴ Considerable gap between price and EMA50 indicates an extended run from equilibrium;
∴ A deeper retracement could naturally gravitate toward this zone for rebalancing.
✴️ Conclusion: Last defensive bastion before mid-term trend deterioration.
⊢
▦ BB (21, 2) - Upper: 121,847.18 / Basis: 117,060.71 / Lower: 112,274.25:
∴ Price reached the upper band during the ATH spike, triggering volatility expansion;
∴ Retraction from the upper band indicates profit-taking pressure;
∴ Basis line aligns closely with EMA21, reinforcing its importance as structural midline support.
✴️ Conclusion: Current movement reflects band rejection; volatility contraction likely if basis holds.
⊢
▦ Volume (21) - Current: 397 / MA: 317:
∴ Above-average daily volume during ATH session confirms real participation;
∴ Today’s sell-side volume surge shows immediate counterforce;
∴ Sustained high volume in both directions could precede a range formation.
✴️ Conclusion: Market is in active price discovery with heightened participation.
⊢
▦ RSI (21, 9) - RSI: 55.87 / Signal: 57.61:
∴ RSI cooled off from near overbought levels (above 70) toward midline;
∴ Positive divergence versus recent price pullback not yet visible;
∴ Momentum has weakened but remains in bullish territory above 50.
✴️ Conclusion: Momentum is consolidating; failure to hold 50 will shift control to sellers.
⊢
▦ MACD (9, 21, 9) - MACD: 548.09 / Signal: 702.94 / Histogram: 1,251.03:
∴ MACD histogram contracting, indicating fading bullish impulse;
∴ Cross-over risk emerging if current trajectory persists;
∴ Still in positive zone, showing bulls have residual control.
✴️ Conclusion: Bullish momentum waning; MACD line needs resurgence to avoid daily cross-down.
⊢
▦ ADX (21, 9) - 27.43:
∴ ADX below 30 suggests trend strength is moderate;
∴ Rising slope in recent days indicates a possible re-acceleration attempt;
∴ Low-to-mid readings show this ATH push lacked extreme trend force.
✴️ Conclusion: Trend strength improving but not yet at dominant breakout levels.
⊢
▦ MFI (21) - 41.60:
∴ MFI pulled back sharply from high 70s toward neutral zone;
∴ Indicates capital outflow matching the retracement in price;
∴ Still above oversold threshold, leaving room for either renewed inflow or deeper drawdown.
✴️ Conclusion: Liquidity pressure present; directional bias still undecided.
⊢
▦ Fibonacci Retracement - (from $98,385.45 to $123,731.21):
∴ 0.0: 98,385.45 – cycle origin;
∴ 0.236: 104,367.05 – minor support;
∴ 0.382: 108,067.33 – intermediate support;
∴ 0.500: 111,068.53 – psychological & technical balance;
∴ 0.618: 114,049.13 – golden retracement zone;
∴ 0.786: 118,307.22 – rejection point in current candle;
∴ 1.000: 123,731.21 – ATH resistance;
∴ 1.618: 139,394.89 – next major extension target.
✴️ Conclusion: Price reaction at 0.786 signals a possible retracement cascade unless recovered.
⊢
🜎 Strategic Insight - Technical Oracle:
∴ The daily chart reveals a market in the aftermath of a sharp thrust to ATH, now facing immediate rejection at the Bollinger upper band and (Fibo - 0.786);
∴ EMA structure remains bullish but compression between EMA9 and EMA21 signals a vulnerability window;
∴ Momentum (RSI, MACD) is losing altitude, while trend force (ADX) is only moderately engaged; ∴ Liquidity flow (MFI) shows sellers matching buyer aggression post-ATH;
∴ The golden retracement at 0.618 aligns with EMA50 as a potential deeper support target if selling accelerates. Bulls must reclaim (Fibo - 0.786) quickly to preserve the breakout narrative.
⊢
𓂀 Stoic-Structural Interpretation:
∴ The chart speaks in tempered cadence - the market reached upward into new territory, only to feel the weight of its own ascent pressing back;
∴ Structure remains poised, with EMA lines still aligned to the north, yet their narrowing gap whispers of momentum’s fatigue;
∴ Momentum and liquidity indicators agree in their caution: the thrust was bold, but the grip on this altitude is not yet certain;
∴ (Fibo - 0.786) stands as the immediate gatekeeper - a threshold where either conviction renews or gravity takes its due;
∴ Trend force is not absent, but it is not yet the roar of inevitability; the ADX reads not triumph, but preparation;
∴ Inflows and volume affirm the battle is active, not concluded - the field is contested, not surrendered.
⚖️ The Stoic mind sees in this neither triumph nor defeat, but the natural stillness between impulse and outcome - a moment to fortify structure, for in patience the stronger hand prevails.
⊢
✦ Structure holds, yet breathes caution.
▦ This is a post-breakout compression - the market testing its new heights while equilibrium forces gather for the next decisive move.
⊢
· Cryptorvm Dominvs · MAGISTER ARCANVM · Vox Primordialis ·
· Dominivm Cardo Gyratio Omnivm · Silence precedes the next force. Structure is sacred ·
⊢
Btcusdanalysis
BTC Accumulates and Adjusts Slightly💎 BTC WEEKEND PLAN UPDATE (15/08)
BTC Analysis After PPI
Trading Highlights
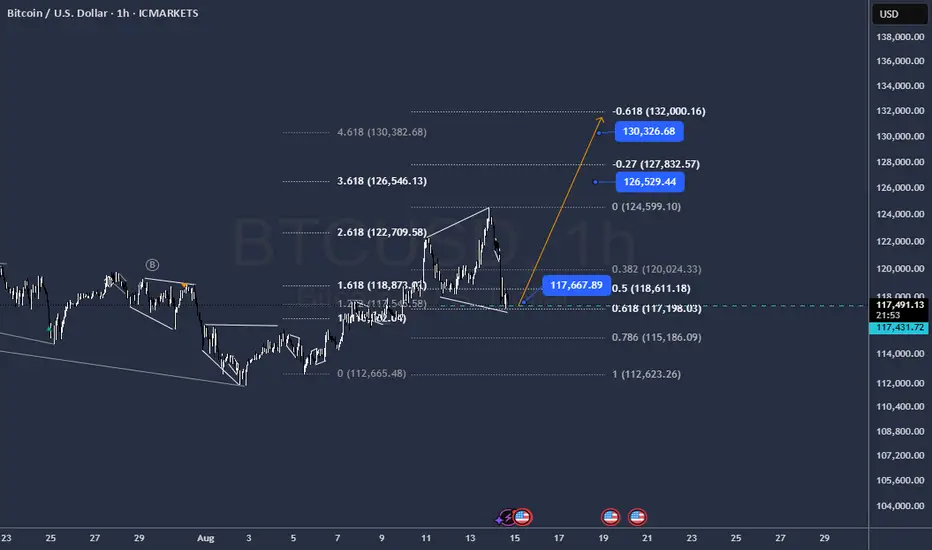
After the PPI release, BTC completed its bullish wave and reached a peak of 123.2K, exactly at the 2.618 Fibonacci Extension level – a strong resistance zone that had been anticipated.
Afterward, the price sharply reversed, dropping to the 117K support area – aligning with the main uptrend line and the 0.236 Fibonacci retracement of the most recent bullish wave → this was where we successfully executed a bottom-picking buy.
Current Price Action
The price is now recovering from 117K toward the 120.7K – 121K resistance area (a confluence of the 0.618 Fibonacci retracement, a previous supply zone, and the H4 EMA).
The short-term trend remains a technical rebound after a sharp drop, with no confirmed sustained bullish reversal yet.
Scenarios & Next Trend
• Main Scenario: Price rebounds to 120.7K – 121K → faces selling pressure → sharply reverses downward following a corrective wave toward 116K – 115K (strong support).
• Alternative Scenario: If 121K is broken with high volume, BTC could revisit the 122.9K – 123.2K zone.
Key Levels
• Resistance: 120.7K – 121K / 122.9K – 123.2K
• Support: 117K / 116K – 115K”

BTC Daily Recap & Game Plan – 15.08.2025BTC Daily Recap & Game Plan – 15.08.2025
📊 Market Sentiment
Overall sentiment remains bullish, supported by expectations of a 0.25% rate cut in the upcoming FOMC meeting. A weakening USD and increasing global risk appetite are creating favorable conditions for further upside in crypto assets.
📈 Technical Analysis
Price has started retracing into the daily swing level and the 0.5 Fibonacci zone, as anticipated in my previous Bitcoin daily update post (linked in the attachment, please check).
We have now seen a 1H break of structure following liquidity grabs.
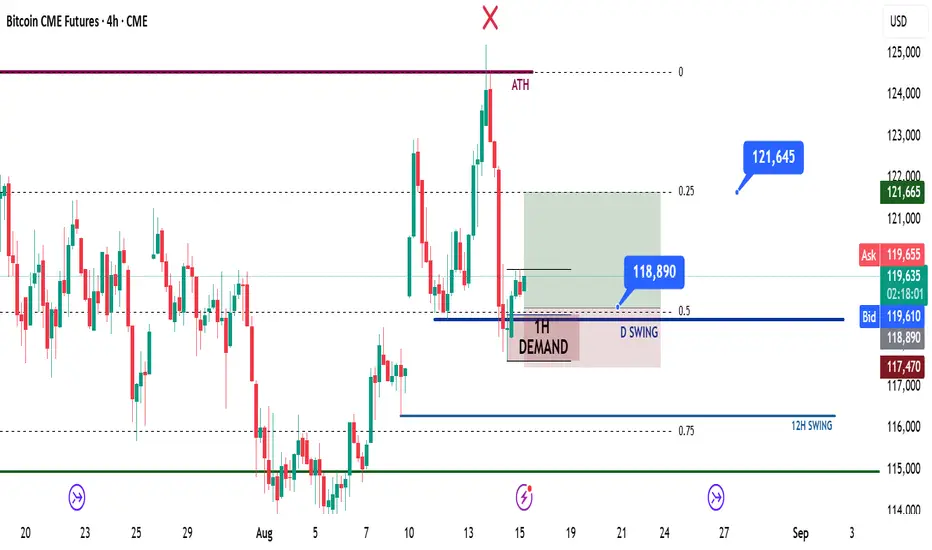
📌 Game Plan
I will be looking for an entry around the $118,800 level, as there is a 1H demand zone that could support a move higher.
📋 Trade Management
Entry: $118,800
SL: $117,000
TP: $121,600
💬 Like, follow, and comment if you find this setup valuable!
Disclaimer: This content is for informational and educational purposes only and does not constitute financial, investment, or trading advice. Always do your own research before making any financial decisions.
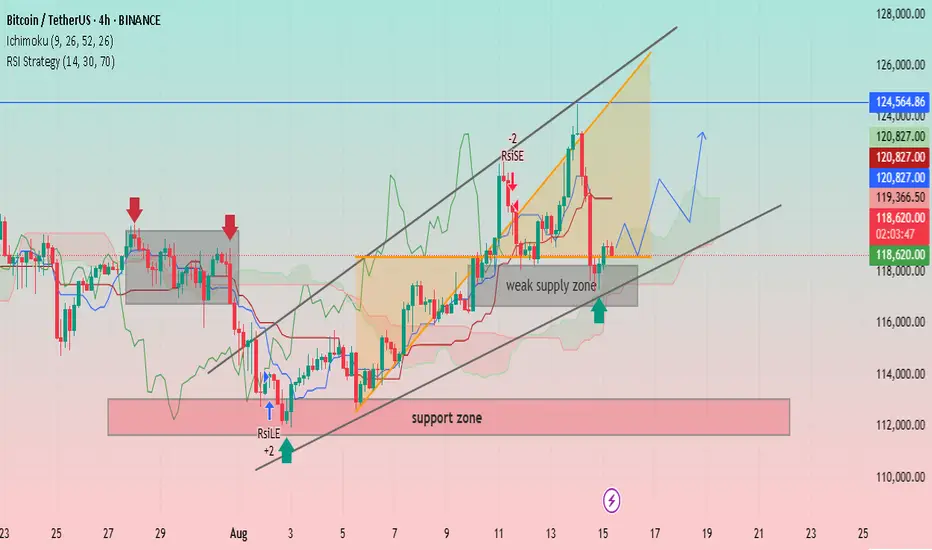
BTC/USDT: Bullish Momentum and Key Support LevelsUptrend Channel: The price is trading within an ascending channel, denoted by two parallel black trendlines. This suggests a bullish trend is in play.
Support and Resistance:
A significant support zone is identified between approximately 112,000 and 114,000 USDT.
A weak supply zone is marked around 118,000 USDT. The price has recently tested this area and found some support.
A strong resistance level is visible at approximately 124,564.86 USDT.
Indicators:
Ichimoku Cloud (9, 26, 52, 26): The price is currently trading above the cloud, indicating a bullish sentiment. The cloud itself appears to be thin and slightly bullish, suggesting potential for continued upward movement.
RSI Strategy (14, 30, 70): The Relative Strength Index (RSI) is used as a strategy, with a "RSILE" signal (likely "RSI Low Entry") marked with a "+2" and a red arrow, suggesting a potential buy signal near the support zone in early August. A "-2" signal is marked near the top of the channel, indicating a potential overbought condition or reversal signal.
Price Action and Projections:
The price recently experienced a sharp decline from the upper trendline, indicating profit-taking or resistance at that level.
The price is currently near the lower trendline and the "weak supply zone," which appears to be acting as support.
A potential future price path is drawn with a blue arrow, suggesting that the price may consolidate or bounce off the current support area and move higher towards the upper boundary of the channel.
Another potential path is drawn with a red arrow, showing a possible further drop towards the lower trendline before a bounce.
Do you ever wonder why most cryptos are doing the same thing?I've been a student of Bitcoin full time for 5 years. Once you learn Btc you know where the rest of the market is going.
Feeling the charts, forecast for August 15, 2025.
I am engaged in the extrasensory of stock charts, that is, feeling the energy of the future chart, this is a meditative technique, and the sensations are mainly tactile.
Forecast for August 15, 2025, I believe that the first half of the day will be upward, as a correction of today's fall, in the second half of the day I expect a significant downward movement.
At the moment, I do not analyze the prices, only pay attention to the price movement impulses. I consider my forecast to be good if the outline of the real chart matches the outline of the chart I drew as a forecast, meaning that the direction and time period of the price movement are correctly indicated.

BTC pretty much ready to skyrocketEntry and Targets marked in cchart
beware to secure Profits onthe way
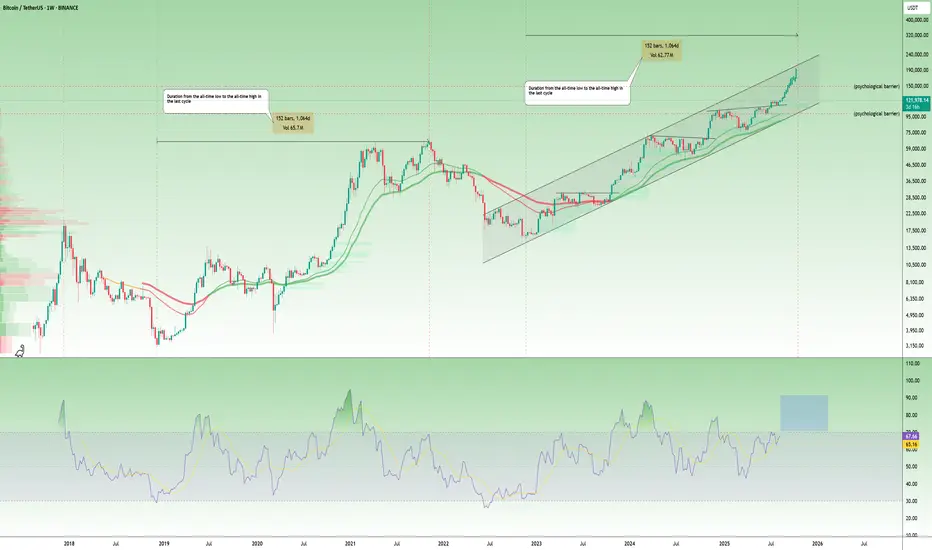
$BTC is repeating history, and it’s doing it with precision.CRYPTOCAP:BTC is repeating history, and it’s doing it with precision. 📈
In the last cycle, it took Bitcoin 1,044 days to move from the bear market bottom to a new all-time high. This cycle is on the same timeline, and we’re now well into that phase.
Price is staying inside the long-term rising channel, and momentum is building. If this continues, a macro top could form between late October and early November, maybe even by the first week of October if the rally speeds up.
The RSI is also climbing toward the same overbought levels seen before past tops. The cycle pattern isn’t random.
It’s the guide.
When will be the next bottom?If the indicator proves to be reliable after this cycle top, we might expect the bottom around August -Sep 2026.

BITCOIN BULLS ARE GONNA DO THIS NOW!!!! (Fakeout Wick) Yello Paradisers! In this video, I've been updating Bitcoin price action and the Elliot Wave theory. I've been doing lots of advanced technical stuff. We've been going through channeling and updating ourselves about the most important support and resistance levels. We've been taking a look at the MACD histogram, the RSI, and the stochastic RSI. We've been professionally analyzing the volume; we've understood who is in power right now and what's going to happen next with the highest probability.
We've also been taking a look at what kind of confirmations we are waiting for in order for us to be able to open long or short positions.
Paradisers, make sure that you are trading with a professional trading strategy. Wait for confirmations, play tactically, and focus on long-term profitability, not on getting rich quick.
Remember, don’t trade without confirmations. Wait for them before creating a trade. Be disciplined, patient, and emotionally controlled. Only trade the highest probability setups with the greatest risk to reward ratio. This will ensure that you become a long-term profitable professional trader.
Don't be a gambler. Don't try to get rich quick. Make sure that your trading is professionally based on proper strategies and trade tactics.

BTC/USD Eyeing Breakout Toward $121.5K – Supply Zone Retest ?Current Price: ~$119,872 showing consolidation just above the 0.618 Fibonacci retracement level.
Structure: Price has bounced from the supply zone (~118.4K–118.6K) and is currently pushing upward.
Ichimoku Cloud: Price is trading within a cloud breakout attempt, indicating potential bullish momentum.
Fair Value Gaps (FVG): Two unfilled FVGs above suggest liquidity targets at ~$120.6K and ~$121.5K.
Support Levels:
Strong Support: ~$115.8K–116.5K.
Local Supply Zone Support: ~$118.4K.
Target: Main upside target sits at $121,533, aligning with a prior high and liquidity pool.
Trade Plan (Long Setup):
Entry: $119,700 – $119,900 (current consolidation zone)
Stop Loss: Below $118,400 (below supply zone)
Take Profit 1: $120,600 (first FVG target)
Take Profit 2: $121,533 (major resistance/liquidity target)
Risk/Reward Ratio: ~2.8
Notes: Wait for a bullish confirmation candle or 1H close above $119,900 before entering. Avoid chasing if price spikes without retest.
This plan follows the chart’s bullish structure and aims to ride the move into the untested liquidity areas above.
If you want, I can also give you a short scenario plan in case price rejects here. That would make this a full two-way trade setup.

BTC looks neutral here pullback first before more action 140kBTC looks ultra good here for the mid term (5 weeks), btc looks ready for the next leg up but first it might go down to support zones.

BTC ALL TIME HIGH-- POTENTIAL RETEST?If today marks the peak of Bitcoin’s current bull cycle, we could see liquidity above these highs get swept before any meaningful pullback. I’m currently watching for a retest of the highlighted zone, which coincides with key Fibonacci retracement levels, making it a high-confluence area for potential entries.

BTC- Test of the Multi Year Trend LineBTC- hitting that trend line top all these years, at a crucial price now. IF we see it cross this, we can expect a new trend upwards, rejection here on the MONTHLY TF= we may not see new highs. Wicks will not count, it will be the closing. Keep a watch

Feeling the charts, forecast for August 14, 2025.
I am engaged in the extrasensory of stock charts, that is, feeling the energy of the future chart, this is a meditative technique, and the sensations are mainly tactile.
Forecast for August 14, 2025, after today's growth, I expect August 14 as a day of a small correction and consolidation at the same time...
At the moment, I am not analyzing the prices, I am only paying attention to the price movement impulses. I consider my forecast to be good if the outline of the real chart matches the outline of the chart I drew as a forecast, meaning that the direction and time period of the price movement are correctly indicated.

Make it or break itThis time double top formed and btc will not make it last chance to catch the knife.
A healthy correction is needed right now being bullish is just fine but fomo is not a great option.
Btc R:R Building slow but valid scene ready for a reaction profit taking will start as soon as you don't notice

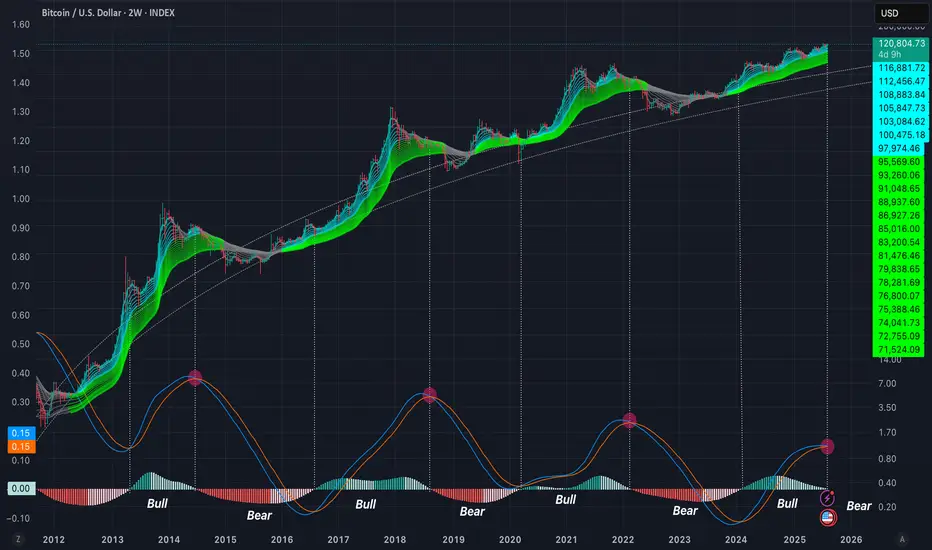
Topping indicator in a 2W Time frameThis time we are going to see the topping indicator in the 2W time frame. As you can see and IF this time is not different we are about to start seeing LMACD crossing and the red histogram showing up indicating the beginning of the bear market. 🥂
Bitcoin Rises as ExpectedAs anticipated, Bitcoin has risen to retest its previous high. Despite facing resistance near the key level and undergoing a pullback, the current retracement remains within a normal and healthy consolidation phase. Technically, the 4-hour chart shows the moving averages maintaining a bullish alignment, and while the MACD exhibits slight sluggishness, there are no clear divergence signals—indicating sustained upward momentum.
Traders holding long positions should monitor the support near 119,600. If the price stabilizes upon retesting this level, it may form a continuation pattern. Personally, I maintain a bullish outlook, expecting a breakout above the previous high after sufficient consolidation, with potential follow-through momentum upon confirmation. However, an unexpected drop below 117,000 would raise concerns about a short-term double-top formation.
Thank you all for your likes, comments and follows, we really appreciate it!

BITCOIN PREDICTION: THIS FIBONACCI SPIRAL WILL BLOW YOUR MIND!! Yello Paradisers! I've revealed to you the secret Fibonacci spiral target. We have been going through multi-timeframe analysis as professional traders. We have been going through the high timeframe chart. We have understood that we are trading inside of that ABC zigzag. Right now, we are in the C wave and we are creating the five moves that are upside. That might take us towards $135,000.
We are right now in the first wave of that fifth wave. We are having bullish divergences on the high timeframe chart. All important indicators like stochastic RSI, RSI, and MACD are having bullish signs, and we have successfully reclaimed the volume profile point of control from resistance into support.
Then, we are turning our focus on the medium timeframe. We are again going through the Elliot wave. We are taking a look at the contracting triangle; the deviation there happened, we are seeing the bullish divergence, and we are updating the Fibonacci spiral. Then we are moving our focus to the low timeframe where we are concluding the Elliot wave count of smaller waves and understanding that the fifth one might be extended.
Paradisers! Keep in mind to trade only with a proper professional trading strategy. Wait for confirmations. Play with tactics. This is the only way you can be long-term profitable.
Remember, don’t trade without confirmations. Wait for them before creating a trade. Be disciplined, patient, and emotionally controlled. Only trade the highest probability setups with the greatest risk to reward ratio. This will ensure that you become a long-term profitable professional trader.
Don't be a gambler. Don't try to get rich quick. Make sure that your trading is professionally based on proper strategies and trade tactics.

BITCOIN PROFITABLE Bitcoin performance has been very great and done what was expected with minim to no pullback, will keep looking for more great opportunities to scalp and turn into a swing trade

BTC accumulation, cash flow through altcoin💎 MIDWEEK BTC PLAN UPDATE (August 13, 2025 )
1. Market Structure & Wave Pattern
The chart is applying the Elliott Wave theory with a completed 5-wave upward structure (1 → 5) and is currently correcting in an ABC pattern.
The current zone is in corrective wave C, with a likely retest of a key support area before bouncing back upward.
2. Key Price Levels
• Short-term resistance: 120,500 – 120,700 (previous breakout zone).
• Nearest support: 118,800 – 119,000 (EMA34 zone + retest of the broken downtrend line).
• Stronger support: 117,500 – 117,800 (EMA200 zone + long-term trendline).
• Major resistance above:
• 122,770 (Fib 2.618, short-term take-profit zone).
• 127,260 – 127,480 (Fib 3.618, strong resistance zone).
3. EMA & Trend
• EMA34 (gold) is above EMA89 and EMA200 → medium-term trend remains bullish.
• EMA200 (red) acts as dynamic support during the correction.
4. Trend Outlook
• Main scenario: Price may continue corrective wave C toward 118,800 – 119,000, possibly testing deeper at 117,500 – 117,800, then sharply rebound in line with the main trend toward targets at 122,770 and 127,260+.
• Alternative scenario: If the 117,500 support breaks, the short-term bullish structure will be invalidated, and BTC could retreat to 115,800 – 116,000 before recovery signals appear.

The pullback is for a better riseAfter testing the lower boundary of the ascending channel, Bitcoin quickly rebounded upward, aligning perfectly with the technical outlook mentioned two days ago. From a 4-hour perspective, the recent pullback was a normal retracement following the breakout of a key resistance level, with diminishing trading volume indicating limited selling pressure. The bullish trend remains intact, and the current trading strategy should still focus on buying the dips, particularly near the lower trendline support zone, while staggered entries based on candlestick reversal signals. If the price consolidates above the mid-channel line, it may further unlock upside potential.
