BTCUSD (Bitcoin): Forex Technical AnalysisDate: 11 July 2025
Momentum: Up
First Scenario : long positions above 115,706.14 with targets at 117,269.52, 117,904.51 and 118,513.05
Second Scenario : short positions below 115,706.14 with targets at 114,544.35, 113,774.89 and 113,053.39
Comment: RSI - Bullish.
Supports and resistances :
118,513.05 **
117,904.51 *
117,269.52
116,747.25 - Last price
114,544.35
113,774.89 *
113,053.39 **
Btcusdanalysis
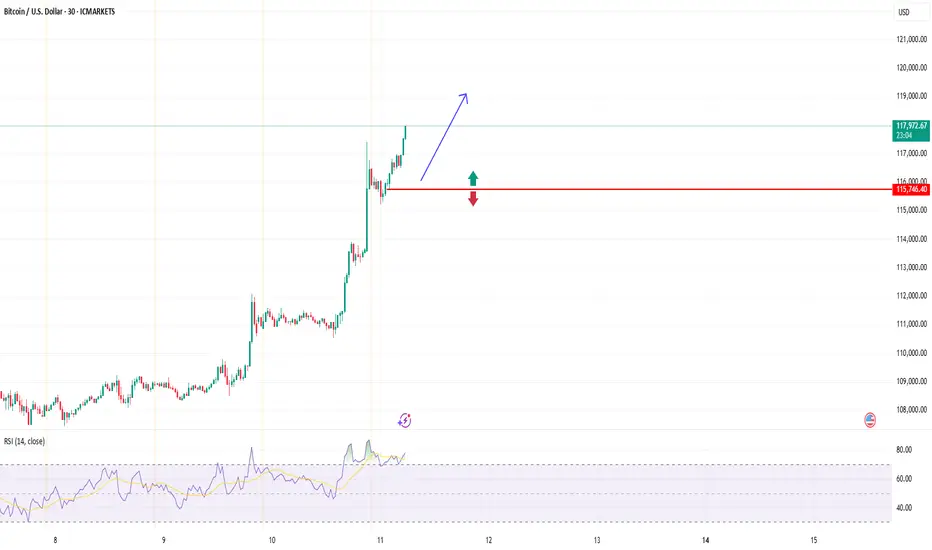
Bitcoin 30 Mints Support Rebound & Structure Break SetupBitcoin has shown a clean rebound from the 30-minute support zone, followed by a break of structure, indicating renewed bullish momentum. The market structure suggests a potential short-term continuation toward the 111,800 resistance area as buyers step back in control.
Key Levels:
Buy Entry: 109,700
Take Profit: 111,800
Stop Loss: 108,500
Reasoning:
Technically, BTC/USD has confirmed a structure break after retesting the support base, signaling strength from buyers. The formation of higher lows and the appearance of increasingly bullish candles reflect momentum continuation toward the next resistance.
Fundamentally , improving crypto market sentiment and stable U.S. dollar movement ahead of upcoming macro data are helping sustain Bitcoin’s recovery tone.
Disclaimer:
This analysis is for educational purposes only and not financial advice. Always manage risk and follow your own trading plan before executing any trade.

BTC 4H ENG.My kids are scared; they got scared with the October 10th crash. Do you know when they stop being scared? When it goes up! I have my futures take profits at 117k; you're my target. I've had my entry pattern very clear, since I was at 106k. The red box indicates an ideal entry area, although you should already be inside.

BTC/USD: Anticipating Rejection from FVG and Short-Term DropRecent Trend: Following a period of upward movement (October 24th - 27th), the price experienced a sharp drop from its peak near $116,000, indicating a short-term structural break to the downside.
Fair Value Gap (FVG): The shaded gray box, labeled FVG, represents a zone of price inefficiency created during the aggressive drop (between approximately $112,000 and $113,000). The price is currently trading near the lower boundary of this FVG.
Consequent Retracement Levels (CRT):
CRT-L (around $113,600) is the highest level of the FVG structure.
CRT-H (around $109,200) is the next anticipated level of support and the target for the expected decline.
Proposed Price Action:
The primary curved arrow indicates the expectation that the price will move up into the FVG zone to "fill" or mitigate the inefficiency.
After reaching the FVG, the price is expected to reject the zone and resume its decline (indicated by the straight black arrow) towards the CRT-H support level at approximately $109,200.
Interpretation and Trading Bias
The analysis suggests a short-term bearish outlook for Bitcoin. The setup is based on the principle of price mitigating its imbalances (the FVG) before continuing the move that created that imbalance. The trade idea is to wait for the price to reach the FVG (the area of liquidity/resistance) before entering a short (sell) position targeting the CRT-H low.

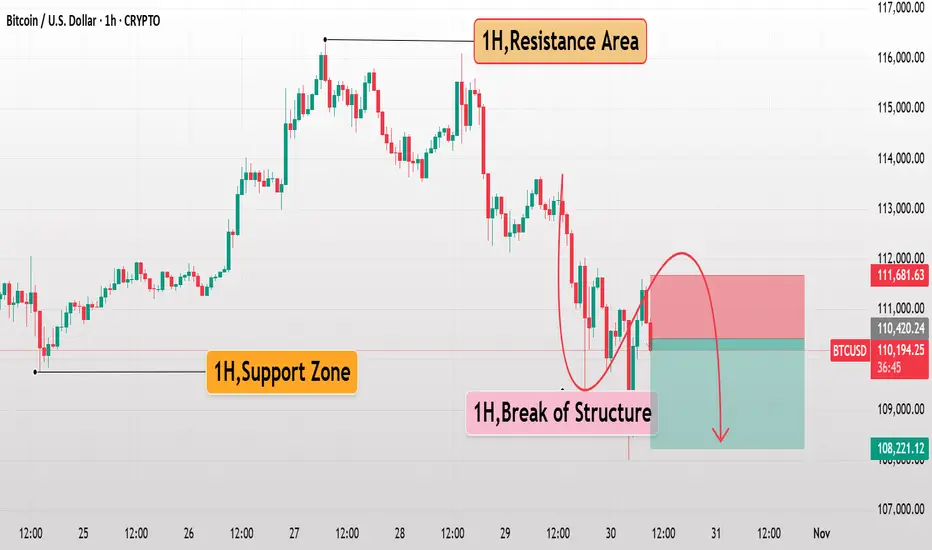
Bitcoin Bearish Setup After Structural BreakBitcoin continues to trade in a bearish structure, forming lower highs after a clear break of the structure from the resistance area. A short-term retest toward the 1H resistance provides a potential swing sell opportunity targeting the next support zone as sellers remain active below key levels.
Key Levels:
Sell Entry: 110,400
Take Profit: 108,200
Stop Loss: 111,700
Reasoning:
Technically, price action confirms a shift in market structure as BTC/USD fails to maintain bullish momentum and breaks below previous support. The 1H chart clearly shows sellers defending the resistance area, suggesting further downside continuation.
Fundamentally, Bitcoin remains under pressure as the U.S. dollar strengthens and global risk sentiment weakens. Investors are turning cautious ahead of upcoming U.S. economic data, favoring safe-haven assets and reducing crypto demand.
Disclaimer:
This analysis is for educational purposes only and not financial advice. Always manage risk and follow your own trading plan before executing any trade.
BTC/USD Breaks Descending Channel – Targeting $116K After BullisAsset: Bitcoin (BTC/USD)
Exchange: Bitstamp
Timeframe: 30-minute
Current Price: $108,168
Trend: Breakout from descending channel; potential bullish reversal forming.
🔍 Key Chart Features:
Descending Channel (Yellow Trend Lines)
Bitcoin was trading inside a well-defined downward-sloping channel.
Multiple touchpoints confirm the validity of the pattern.
The price has now broken out above the upper trendline, suggesting a shift in momentum.
Buy Zone (Purple Rectangle, ~$105,600 – $106,300)
Marked as “ZONE BUY.”
This acted as a strong support zone where price bounced.
Aligns with previous reaction lows.
Breakout Confirmation
The breakout from the channel, followed by a higher low within the buy zone, confirms bullish sentiment.
Immediate rally of +1.85% (1,970 points) adds weight to the breakout.
Target Projection: $116,052
Based on measured move (channel height or breakout projection).
Represents a potential +9.5% upside from breakout region.
Shown with a large blue arrow indicating bullish target zone.
🧠 Interpretation:
Current Market Structure:
A trend reversal is likely underway after prolonged selling pressure.
Bullish Setup:
Rejection from the buy zone with a sharp move up.
Break of channel trendline + confirmation pullback = classic reversal pattern.
Upside Target:
$116,052, if momentum holds and support zones remain protected.
Risk Management:
Invalidation level: Below $105,600 (bottom of the buy zone).
Consider trailing stop-loss as price rises.
✅ Summary Strategy:
Entry Zone: ~$106,000 (within Buy Zone or breakout retest)
Stop-Loss: Below $105,600 (buy zone base)
Target: ~$116,052
Reward/Risk: Attractive (approx. 9.5% potential upside vs ~1.5% risk)

DeGRAM | BTCUSD broke the dynamic resistance line📊 Technical Analysis
● BTC/USD has broken above its dynamic resistance line, signaling a shift toward bullish momentum after consolidating near the 110K zone.
● A potential retest of 114K–115K could act as a springboard for continuation toward the key 118K resistance, aligning with the upper channel boundary.
💡 Fundamental Analysis
● Bitcoin’s rally is fueled by ETF inflows and renewed institutional demand, while easing U.S. inflation expectations support risk-on sentiment.
✨ Summary
● Long bias above 114K; targets 118K. Bullish breakout and improving fundamentals favor medium-term upward continuation.
-------------------
Share your opinion in the comments and support the idea with a like. Thanks for your support!

H&S on BTC accompanied by rejection from IDT (still forming)Bearish signal for further declines on crypto
Weakening volumes on the short up move

BTC/USDT: Bearish Drop to 108,500?BINANCE:BTCUSDT is signaling a bearish breakdown on the 1-hour chart , where price is trapped in a descending triangle formed by a downward trendline and an upward trendline, with increasing pressure at the convergence point near resistance—indicating potential for a downside continuation if sellers dominate. This classic pattern suggests weakening bullish momentum amid recent pullbacks.
Entry zone between 112,500-114,000 for a short position. Target at 108,500 near the support zone, offering a risk-reward ratio of 1:2 . 📊 Set a stop loss on a close above 114,500 to protect against an upside breakout. 🌟
Look for confirmation on a break below the entry with surging volume, capitalizing on Bitcoin's current choppy range.
Fundamentally , Bitcoin has seen high volatility recently, hitting new all-time highs above $125K earlier this month before dropping to around $105K, now stabilizing near $111K amid mixed macro signals and uncertainty from large holder movements. Additional catalysts include ancient wallet awakenings transferring billions in BTC and ongoing debates on tokenized gold versus Bitcoin's value. 💡
📝 Trade Plan:
✅ Entry Zone: $112,500 – $114,000 (short zone near resistance)
❌ Stop Loss: Close above $114,500
🎯 Target: $108,500 (major support area)
💎 Risk-to-Reward: Approx. 1:2 – clean, structured short setup within a bearish pattern.
What's your take on this setup? Drop your thoughts below! 👇

BTC/USDT: Symmetrical Triangle Signals Potential Downside MoveHi!
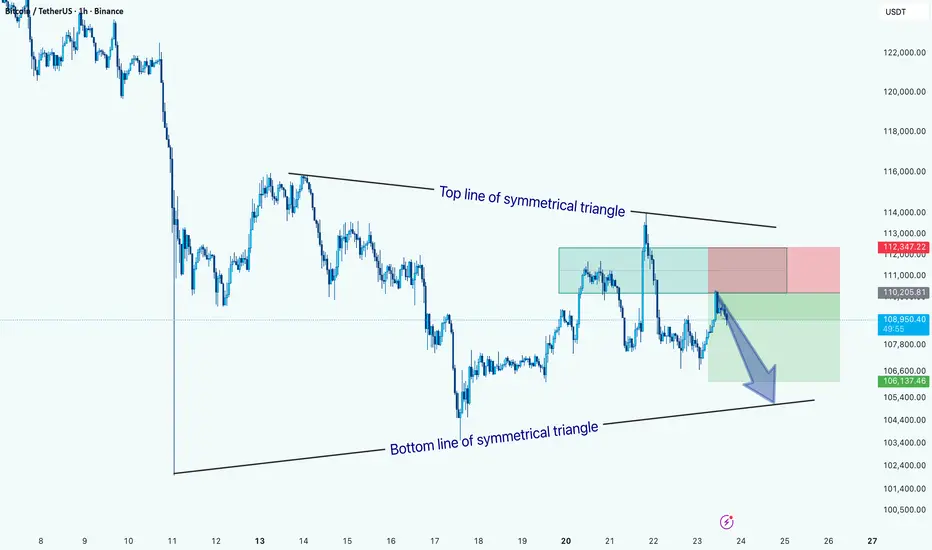
The price action is currently forming a symmetrical triangle pattern, marked by converging trendlines, the top line showing lower highs and the bottom line showing higher lows.
At present, BTC is trading near the upper half of the pattern but has recently faced rejection from the top trendline, indicating potential bearish pressure. The highlighted setup suggests a short position targeting a move toward the bottom boundary of the triangle around $106,000–$105,500, with a stop loss near $112,300.
A confirmed break below the lower trendline could accelerate bearish momentum, while a breakout above the top line would invalidate this bearish scenario and signal possible trend reversal.
Bias: Bearish within the symmetrical triangle until a clear breakout occurs.
Key Levels:
Resistance: $112,300
Support: $106,000 / $105,500
BTC Bottomed at $109,3542025-10-25 Daily Chart
BTC bottomed at $109.354, and is ready to move higher.
2RL 118,993
1RL 114,080
0CL 109,354
1SL 106,555
2SL 103,605

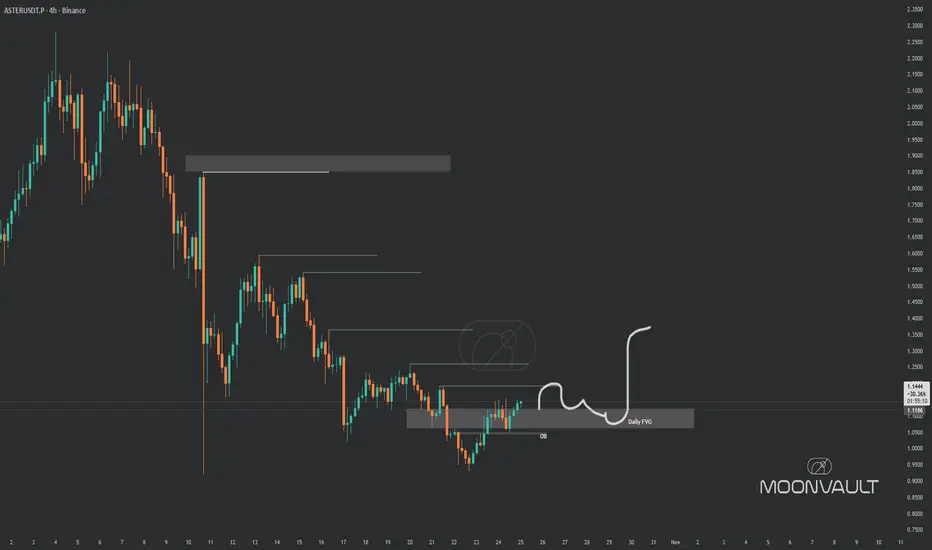
$ASTER put it on your watchlistSEED_WANDERIN_JIMZIP900:ASTER fans be aware of Aster move: break structure by reclaim daily FVG and staying above until CRYPTOCAP:BTC don't ruin party... this one looks good here, it's aster
time again.
Pain stage is just starting I am standing with my short position from 123k when the signal flashed. We are now entering the most painful stage.

BITCOIN + ETH SIGNALS: MASSIVE MOVE INCOMING!!!(Nobody Watching)Yello Paradisers! Enjoy the video!
And Paradisers! Keep in mind to trade only with a proper professional trading strategy. Wait for confirmations. Play with tactics. This is the only way you can be long-term profitable.
Remember, don’t trade without confirmations. Wait for them before creating a trade. Be disciplined, patient, and emotionally controlled. Only trade the highest probability setups with the greatest risk to reward ratio. This will ensure that you become a long-term profitable professional trader.
Don't be a gambler. Don't try to get rich quick. Make sure that your trading is professionally based on proper strategies and trade tactics.

$BTC might explode after the washout!CRYPTOCAP:BTC is once again reacting strongly from the lower channel support, similar to the previous green-circle bounces we’ve seen this year.
Each green circle has marked key accumulation points — followed by strong upside momentum.
Meanwhile, red circles highlight resistance rejections where profit-taking zones formed near the upper channel boundary.
🧭 Key Levels to Watch:
Support: $106.8K – $110.5K
Resistance: $120.1K – $123.5K
Trend: Holding firmly inside the rising channel
If CRYPTOCAP:BTC continues to respect the green zone, we could be looking at the early stages of another leg up toward the top of the channel.
But if support fails, expect a deeper retest of the lower structure.
Note:
History doesn’t repeat perfectly — but it rhymes. Stay calm, stay patient, and let the chart tell the story.

Oct2026 might see the bottom It would be fun seeing time cycles paying out again. Around low 40k might be the bottoming target.

BTC Trade Set Up Oct 23 2025Btc has come into 1h supply and respected it with price making LH on the 15m and a BOS on the 15m so i will be taking sells to lower SSL that have not be tapped yet

Bitcoin - BTCUSDT – Daily NeoWave AnalysisStructure: Contracting Triangle (ABCDE)
Current Price: $108,985 (+1.3%)
🧠 Wave Structure Overview
Bitcoin’s daily chart is forming a Contracting Triangle pattern under NeoWave principles (Glen Neely).
This triangle appears to be part of a wave (4) correction within a larger impulsive cycle, consisting of subwaves A–B–C–D–E with well-balanced price and time proportions.
🔹 Wave Details
Wave A: Decline from 126K → 104K
Type: Impulsive start, setting the corrective tone.
Wave B: Sharp recovery to 123K (≈78.6% retrace of A)
Type: Zigzag – strong bullish response typical for triangles.
Wave C: Pullback to 106K, forming a 3-wave Flat correction.
Wave D: Rally to 118–119K, reaching 70% of wave B — perfectly proportional for a contracting structure.
Wave E: Final leg down toward 106K–107K, with diminishing momentum and volume — a textbook NeoWave E-wave behavior signaling triangle completion.
🔍 Technical Observations
Strong bullish divergence between price and RSI/OBV at the E-wave low.
Decreasing volume during wave E → confirms a terminal corrective phase.
Price remains above the long-term rising trendline and key demand zone near 106K.
🟢 Primary Scenario (≈70% Probability)
Triangle completed at E-wave (106K) → beginning of wave (5) to the upside.
Targets:
1️⃣ 115K–118K – short-term breakout zone
2️⃣ 123K–126K – retest of triangle resistance
3️⃣ 138K–145K – extended target if wave (5) unfolds impulsively
🔴 Alternative Scenario (≈30% Probability)
If BTC breaks below 106K, wave E may extend deeper toward 102K–100K, forming a Running Triangle E before a strong bullish reversal.
⚙️ Summary
✅ Current pattern: Contracting Triangle (ABCDE)
✅ Position: End of wave E of (4)
📈 Expectation: Start of wave (5) impulsive advance
⚠️ Invalidation: Daily close below 102K
Conclusion:
BTC is likely completing a major corrective phase. Holding above 106K keeps the bullish breakout scenario valid — watch for a decisive move above 111K–112K to confirm the next impulsive leg.

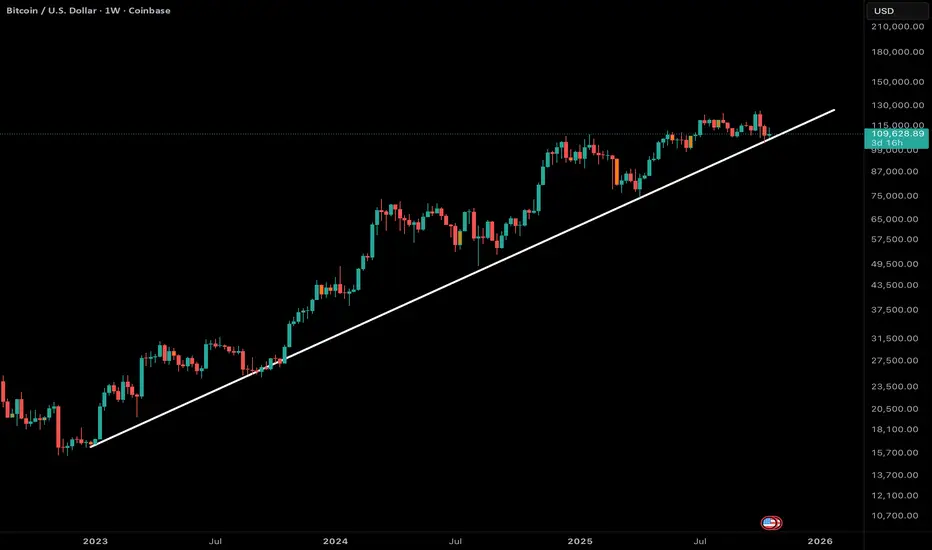
BTC Main TrendlineThis trendline has been the backbone of the entire BTC bull cycle—every major dip has bounced cleanly from it. As long as weekly candles hold above, the bull trend remains intact with each retest offering strong support. But once this line is broken with a decisive weekly close and confirmed rejection on the retest, it will mark a structural shift: momentum flips bearish, higher lows are invalidated, and the bull market phase likely ends.
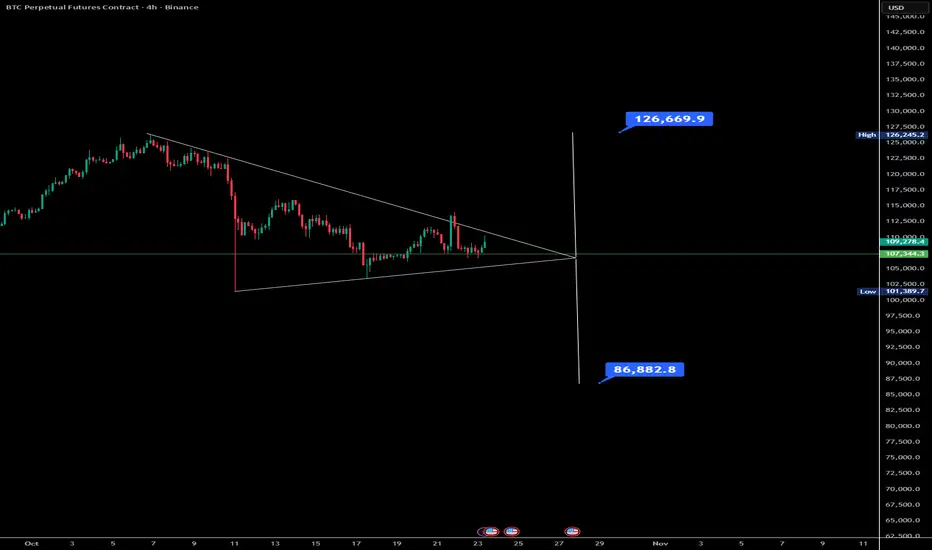
Bitcoin Symmetrical Triangle Breakdown Or Breakout SetupBitcoin sits inside a symmetrical triangle after making a lower low from its all-time high (~101K). The market now faces a binary outcome: break above for the ATH run, or break below for a deeper correction (~87-90K).
Bias: Slightly bearish tilt given distribution phase possibility and macro risk (CPI tomorrow). If you hold long, reduce risk or lock profits before CPI. If you trade the breakout/breakdown, wait for confirmation + volume.
Key Levels:
• Triangle upper break → target ~125K+
• Triangle lower break → target ~87-90K
• Keep stop-loss or hedge accordingly.
Macro trigger: US CPI release tomorrow; one of the largest risk events for crypto this week. Inflation surprise higher → Fed stays hawkish → risk assets (incl. BTC) under pressure. Inflation surprise lower → possible relief rally but distribution risk stays.
While upside remains possible, the safer assumption is that we’re in a distribution phase. Entry for new long positions should be cautious. Until triangle resolves, keep bet sizes moderate and manage risk.
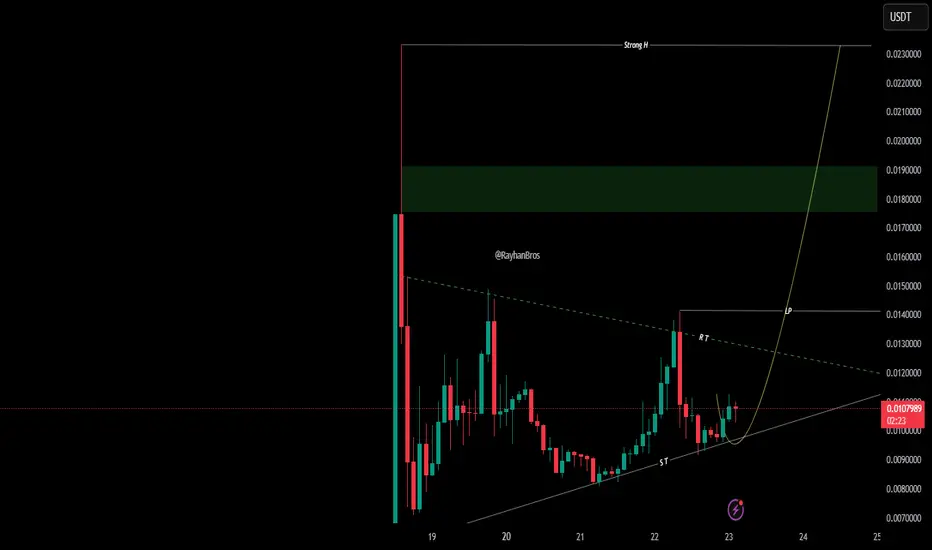
$RVV Breakout Watch
Looks like the rocket’s fueling up 🚀—chart says it loud and clear! BITGET:RVVUSDT
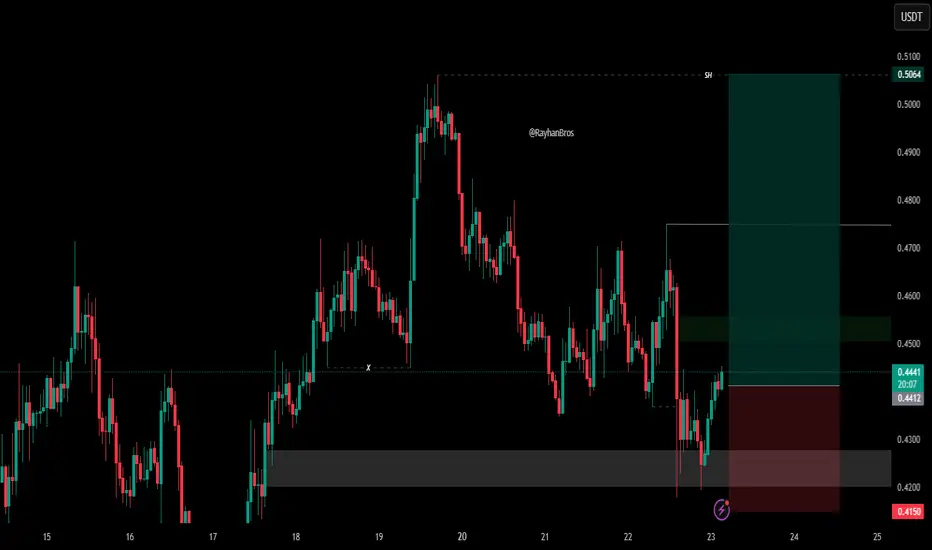
$ENA setting up for its next leg higher.Currently sitting in a high-conviction demand zone, making it an ideal spot for early buyers to position before momentum ignites.
🟢 Entry Zone: $0.4430 – $0.4400
🎯 Target 1 — $0.4530
🎯 Target 2 — $0.4630
🎯 Target 3 — $0.4750
🎯 Target 4 -- $0.500$
🔴 Stop Loss: $0.4180
⚡Momentum building… Smart money is quietly accumulating before the next explosive move!
📌 Use low leverage with Sl...Do proper money management... DYOR BINANCE:ENAUSDT.P
$BNB 1h Looking hot 🟢 Entry : 1084$ - 1070$
🎯 Tps : 1110$ - 1130$ - 1160$ - 1200$
🔴 Invalidation : 1025$
📌 Do proper money management.. Use low leverage.. DYOR... BINANCE:BNBUSDT.P
