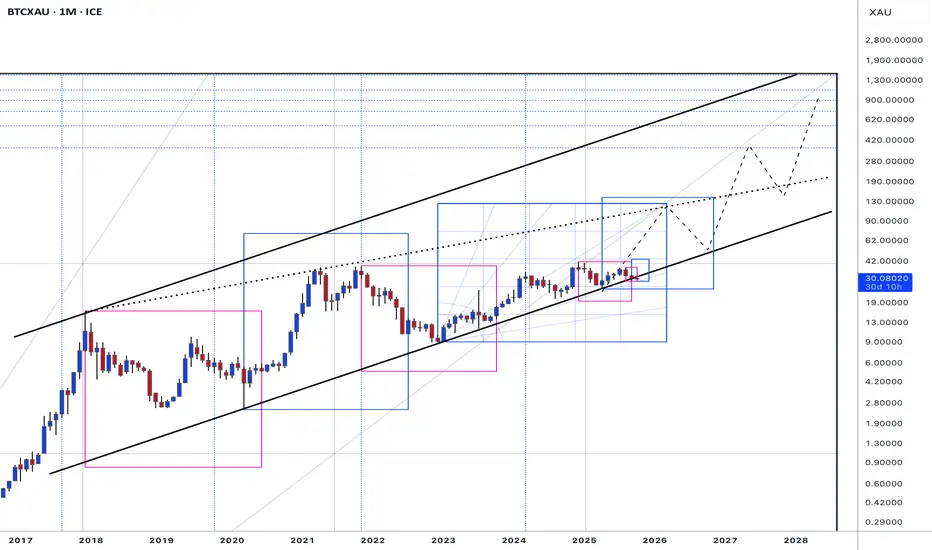
BTC/Gold A Simple Signal That Has Worked Only 4 Times in HistoryThe BTC/XAU (monthly) chart has produced only four clear local bottom signals throughout its entire history.
This is a deliberately simple, noise-free setup. No indicators overload, no short-term speculation—just relative strength between Bitcoin and gold.
Each of these historical bottom zones marked periods where Bitcoin stopped underperforming gold and began a new phase of relative outperformance. In other words, these were moments when risk appetite slowly rotated back from a defensive asset (gold) into a risk asset (Bitcoin).
What makes this signal powerful is its rarity.
It doesn’t trigger often—but when it does, it tends to coincide with major regime shifts, not short-term trades.
The current level once again sits near a historically significant zone.
Whether this becomes another confirmed bottom will be decided by time and follow-through, but historically, this is where long-term investors start paying attention—not chasing price, but watching the ratio.
BTCXAU

The Real Signal Isn’t BTCUSD — It’s the Bitcoin/Gold Ratio!When we read BTCUSD, XAUUSD, and the BTC/Gold ratio together on a monthly logarithmic chart, the real story is told not by price, but by the ratio.
Even if Bitcoin looks strong in USD terms, rallies tend to slow down whenever Bitcoin loses strength against gold.
So why does this happen?
Let’s break it down with 3 key points.
• 19.43 stands out as a critical threshold for the BTC/Gold ratio (orange). During the 2020–2021 bull market, this level marked a local bottom, after which Bitcoin launched its second parabolic move and rallied up to $69K.
• After the 2021 peak, the ratio moved against Bitcoin and stayed below the critical 19.43 level for nearly two years, during which Bitcoin experienced a severe bear market. From November 2022 onward, the ratio strengthened again in Bitcoin’s favor, leading to a rally that carried BTC as high as $124K.
• However, starting in July 2025, the BTC/XAU ratio failed to break above its previous peak and began forming lower highs. This signaled a shift in favor of gold. As the ratio declined, the preference for safe-haven assets became more dominant and clearly showed that Bitcoin is still not perceived by investors as a short-term risk-off asset. In periods of uncertainty, capital once again preferred flowing into gold rather than into risky assets like Bitcoin.
Conclusion
If the BTC/Gold ratio can hold above 19.43, Bitcoin may enter a new phase of relative strength against gold. Otherwise, gold’s leadership is likely to continue, implying a period where Bitcoin may rise in USD terms but remain relatively weak.
The real question is this:
Will Bitcoin make its next parabolic move, or will it remain in gold’s shadow for a while longer?

Bitcoin V Gold V DXY. Who is loosing less right now ?
These charts are all 4 hour charts
The Main chart is Bitcoin USD INDEX and on the Right is CFD's on GOLD
The SMA's are 50 - RED, 100 - BLUE, 128 - GREEN and 200 - YELLOW
Just in the SMA's we can see Gold is in better shape with PA above all SMA lines.
Gold also coming down onto a strong Fib line of support just below the 100 SMA that it just bounced on.
We have to wait and see if this holds.
Bitcoin PA is under resistance, below its SMA's and below the nearest Fib Extension line
However, Strong line of support just below.
So, initially, it looks line GOLD is doing better.
One way to know for sure is to look at the BTCXAUt chart. This is BTC trade Pair with GOLD
This is the 4 hour BITCXAUt left and Gold on the right again. Same colour code for SMA'a
Lopk at that GREEN Candle on the BTCXAUt chart
This implies that BITCOIN is gaining on Gold, OR more accurately, is loosing LESS
This needs to be watched closely as both are approaching lies of support / Resistance.
The rest of this week is going to be interesting to say the least.
And we do have to look at how the USD DXY INDEX is doing.
So, on this 4 hour chart, we see DXY gaining and above its SMA's
The DXY is simply the $ performance against other major currencies.
CONCLUSION
If you want to remain in an asset, it is better to hold on to your BITCOIN for a number of reasons.
Mostly as it is loosing less than Gold right now and, after it has been falling a lot longer, is more likely to Rise again soon, providing the Bulls are ready to step in.
Bitcoin is OVERSOLD on 4 hour & Daily and getting there on the weekly.
GOLD is OVERBOUGHT on most time frames now.
CAUTION is the name of the Game right now.
However, You could sell out to a USD stable coin and while the amount of USDT may not increase, its Value appears to be climbing.
The question is for how long ----------- Amd as mentioned just above, there is little point selling out to another currency as the $ is outperforming them all
In the USA, on the 24th, we have the updated inflation figures Due with the figures expected to remain static.
This WILL effect markets and, for me, is certainly why we may just hang around where we are right now in prices.
BUT we should also be prepared for some Volatility. We have been seeing how markets seem to move just before announcements....
stay safe and , as always, Time will tell

BTCXAU # 001 ( Noting else , Every thing is Clear ! ) Hello dear traders.
First of all thanks for your support and comments.
—————————————————————————-
Still channel is valid and can Finnish monthly Gann Square up to 2028 which is mach with BTCUSDT at 2028 .
In other way Gold is reach to the Weekly Gann Square highest level and need at least 2-3 years correction for Next bull run .
Good luck and safe trades.
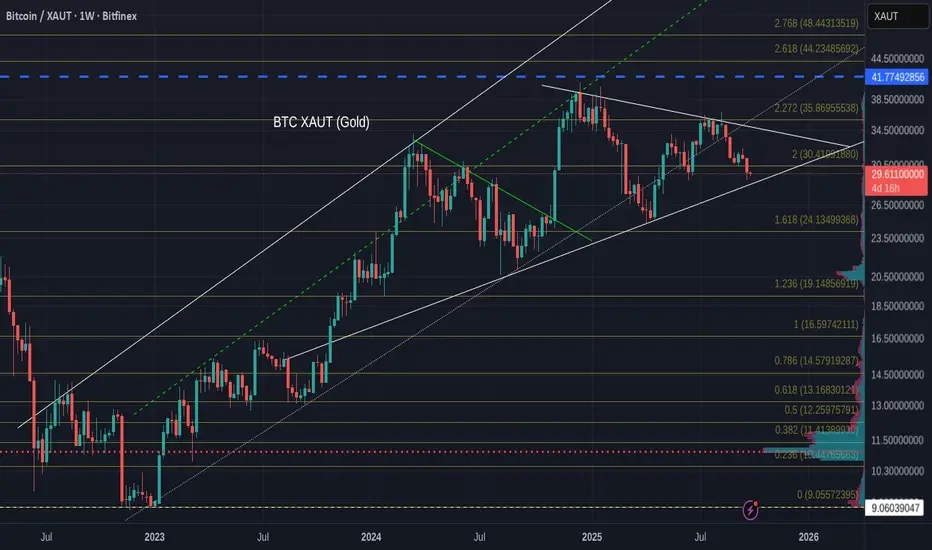
Is Bitcoin about to outperform Gold ? The potential Does exist
As we can see on this weekly Bitcoin XAUT Gold chart, BTC Ranges, pushes, ranges, pushes.
And the BTC PA is now on the line of support ir has strongly bounced off previously.
PA is also beginning to get Squeezed in the Pennant. The Apex is next year but I expect PA to break out of this this year.
It will be interesting to see what happens here this month and I do have Hopes that BTC will begin to outperform gold, certainly while PA pushes up off support and heads towards the upper trend line.
This idea is backed up with the weekly GOLD Chart below.
As we can see, Gold is up on the upper trendline and has hit the 2.768 Fib extension, Both of which are likely to be resistance.
We can also see how Oversold the Gold Weekly MACD is
There is a Strong likelihood that Gold will need to cool off, though we need to understand that MACRO events do control this, so a Drop is not guaranteed.
But I will be watching this CLOSE as The BTCXAUT pair is a much better Pair to watch than the BTCUSD.
Yjr reason being, while the $ looses Value, gains in the BTCUSD pair are Not as good as it may appear. Because you may gain in the number of $ you can get but each $ is worth less.
GOLD meanwhile, is rising in Value or not loosing as much when it ranges. Itis a STORE of Value and is internationally recognised and is politcay neutral.
BITCOIN vs GOLD - Massive Fall in 2025?My prediction: TVC:XAU (Gold) will OUTPERFORM CRYPTOCAP:BTC (Bitcoin) until December of 2025
Here is why:
1. Technical side. The price failed to break through the 33.5 resistance and is now heading downwards. The right shoulder of the H&S pattern has formed clearly. The TVC:XAU chart is very bullish, breaking resistance one by one. In contrast, the CRYPTOCAP:BTC failed to hold above the $117,000 resistance, resulting in a hard dump that seems to be far from over.
2. Fundamental side. People buy gold during uncertain times, and we are currently on the verge of experiencing such a period. Rate cuts are already priced in, and each FOMC meeting is a "sell the news" event. If only Powell refuses to cut rates or cut it just one - markets, especially SP:SPX , will be heavily affected. When crypto and stocks are falling, people buy gold—it's a simple rule.
I'm not calling for a massive correction in the stock and crypto markets, but holding some gold in your portfolio during the fall of 2025 seems like the right thing to do.

Bitcoin will overperform Gold in lower time frame?When i looked into BTC/GOLD chart (BTCXAU), i saw 2 things. The gap has been filled and BTC bounced against GOLD over the trend line support. If this is a retest of bullish continuation, then things will be positive for BTC price. Losing this support zone of 30 - 31 is the invalidation.

Wen Crypto Rally?If we want #CryptoRally , then first of all #usdc dominance must break down daily EMA200 i highlighted in the chart. If this support plays out well, then mid term W bounce of #usdcd must continue. And also in BTCXAU chart, 33 must be broken to be bullish for BTC.

BITCOIN/GOLD BITCOIN/GOLD 🌊
Physical gold vs. Digital gold
2010: 1 BTC 0.0001 GOLD
2025: 1 BTC 27.9 GOLD

Bitcoin Priced in Gold, Seeks Full Coins and BarThe whole number effect is evident here, see orange circles.
With a commodity in price discovery mode every four years, every four years traders sell bitcoin gains for whole portions of gold.
I would say if someone hodled 1 bitcoin through a three year crypto winter, then suddenly it was worth 1kg of pure gold, they might be tempted to do the same.
This informs my extrapolations, will be interesting to watch this play out.
I've included in blue another interesting pattern, where the price on the day of the halving makes the same Fibonacci increase every halving. Obviously not many data points, but something to keep watching as we clearly head toward this very same number again this year.
And to complete the Fibonacci analysis, the clear 0.618 fib level drawdowns are indicated in green, which did not align with the current cycle, may pick back up again.

BTC/XAU (Bitcoin VS Gold) #BTC #GOLDThe chart is an effort to plot Bitcoin and Gold in a ratio to figure out potentially where we are.
The upper band (red) is where it becomes quite risky to hold bitcoin instead of gold.
Mind you this does not mean gold will give better returns but means if Bitcoin goes through a correction, Gold will likely hold stronger.
The green band is where Bitcoin becomes extremely less risky with a huge risk to reward ratio. Having said that, hoping that we will come touch green band is not always a good strategy as it has been proven it might reverse before touching green.
Another level to add to some Bitcoin to your position instead of Gold has been 200 Week Moving Average (200WMA) represented as blue line.
Historically it has been a good level to add Bitcoin instead of Gold. Although it is not a perfect indicator as well but it definitely makes considering Bitcoin vs Gold a little easier as it is a massive support.
As of now, we are not there yet but further downwards price action will take us there.
We can certainly come down and touch green band where it becomes a no brainer for me to allocate my capital to bitcoin instead of gold.
I do also notice the MACD is deeply red and quite oversold. A weekly candle showing reversal could be a good indication of trend reversal while still expecting some choppy price action.
Note: Green and Red bands are not drawn using logarithmic curves but rather connecting the closing price and trying to connect as many as points as possible. I am aware I might not have touched all points but this model is just a visual comparison of trend rather than targeting exact entry or exit points.
What do you think will play out? Tell me in the comments.

Gold is going to outperform Bitcoin for the next yearGold in pair with Bitcoin has broken the dynamic resistance of a falling wedge and made a decent pullback which is at 61.8 fib level of the last pulse.
Gold is going to outperform BTC for at least the next 12 months in my opinion

Bitcoin: Not a buyer until it breaks this line upwardsBitcoin: Not a buyer until it breaks this line upwards

Bitcoin vs GoldPlease 1st of all click the boost🚀 button if you want me to post more ideas and follow me to support my work! It's absolutely for free.
This is comparison of Bitcoin (BTC) versus Gold (XAU) , so if the:
*price is going up, it means BTC is stronger than XAU
*price is going down, it means BTC is weaker than XAU
After strong initial impulse down the pair has been consolidating for almost 5 months and formed this triangle📐. Now the price is breaking down out of this triangle and if it really breaks, I think there is chance for drop to 7.5. TARGET being height of the triangle projected from midpoint of the local range (pink). So this call is predicting that Bitcoin will lose -30% against the Gold .
As you know recently it was a total carnage for crypto market because of the FTX fail. Actually I predicted this FTT extreme drop 2 months ago in the idea down below:
The current situation between Binance and FTX being also a reason why I think the investors will move the funds from crypto to precious metals - safe haven. Let me know your thoughts!
Check my other stuff in related ideas.
Please boost🚀, comment🗣️, follow me✒️, enjoy📺!
⚠️Disclaimer: I'm not financial advisor. This is not a financial advice. Do your own due dilingence.

BTC vs. GOLD: Did we get a signal on May 18, 2021 ?Did we get a signal on May 18, 2021? We will see it with certainty a little later, if the blue moving average line should change sides and cross the yellow circle, but for now it almost looks like it.
History of signals (yellow circles) generated so far:
26-Aug-2011 sell Bitcoin, buy Gold
19-Feb-2012 sell Gold, buy Bitcoin
16-Mar-2014 sell Bitcoin, buy Gold
29-Sep-2015 sell Gold, buy Bitcoin
09-Mar-2018 sell Bitcoin, buy Gold
06-Apr-2019 sell Gold, buy Bitcoin
26-Sep-2019 sell Bitcoin, buy Gold
12-May-2020 sell Gold, buy Bitcoin
18-May-2021 sell Bitcoin, buy Gold?

Gold - No decoupling from the stock market yet On 20th September 2022, we stated that the Fed's pursuit of a tighter economy would continue to weigh on the gold price. After the rate hike, the price marked a new low simultaneously with the stock market. Then, the market rebounded, and in early October 2022, we said that we were growing increasingly anxious regarding the sustainability of the move.
In addition to that, we pointed out a high correlation between the stock market and precious metals, which still continues to threaten gold's prosperity. Because of that, we stay bearish on gold in the short term and expect it to hit 1 600 USD, as we outlined exactly a month ago. Our views are based mainly on fundamental factors, which play into cards for the U.S. dollar, weakening gold's position. However, we also consider other macroeconomic and technical factors described in our other articles.
Despite our grim short-term outlook for gold, we are very optimistic about its bright future. Indeed, we continue to wait for better prices to buy more of the physical metal while shorting paper gold. On the endnote, we voice a word of caution to investors over the upcoming FOMC meeting; we will provide more thoughts on this asset soon.
Illustration 1.01
The picture above shows the daily chart of XAUUSD. The breakout below the short-term support will bolster the bearish case in the short term.
Technical analysis - daily time frame
RSI, MACD, Stochastic, DM+ and DM- are bearish. Overall, the daily time frame is bearish.
Illustration 1.02
Illustration 1.02 displays the daily chart of XAUUSD and simple support/resistance levels.
Technical analysis - weekly time frame
RSI, MACD, and Stochastic are all bearish. DM+ and DM- are bearish as well. Overall, the weekly time frame is bearish.
Please feel free to express your ideas and thoughts in the comment section.
DISCLAIMER: This analysis is not intended to encourage any buying or selling of any particular securities. Furthermore, it should not be a basis for taking any trade action by an individual investor. Therefore, your own due diligence is highly advised before entering a trade.

BTC FAIR MARKET VALUE IN RELATION TO VOLATILITY VS. GOLD. Came across this article which confirmed what I long suspected. The more institutionalized BTC becomes the more it's volatility decreases and value increases but there is a cut off. Fair market value will always be in the forefront as far as an investment grade asset. BTC overtaking gold is highly unlikely in our lifetime. At present, there is in global circulation roughly $11 TRILLION in gold. Compare that to BTC where all the bitcoins in the world were worth roughly $1.03 trillion. Bitcoin is worth only about 9% of the world's gold supply. The combined value of bitcoin was equivalent to just 2.9% of the world's money.
JPMorgan says its long-term bitcoin price target of $150,000 is unlikely as surging volatility challenges institutional adoption.
Bitcoin's "fair value" is 12% below its current price, based on its volatility in relation to gold, according to JPMorgan.
The bank's analysis was made on the assumption that bitcoin is four times as volatile as gold, strategists led by Nikolaos Panigirtzoglou said in a note Tuesday. In that scenario, bitcoin's value would be one quarter of $150,000, or $38,000, they said.
But if bitcoin were only three times as volatile as gold, then its fair value would be around $50,000, they added.
Bitcoin last traded 1.8% higher on the day around $43,564, close to its highest for a month, but is still down 8% so far this year, according to data from CoinMarketCap.
JPMorgan's long-term price target for bitcoin is $150,000, up from last year's $146,000 target, assuming that its volatility level meets that of gold, or bitcoin allocations get the same weighting as gold in investor portfolios.
But the bank thinks this target is unlikely to be reached any time soon, given that such a neat intersection between gold and bitcoin may not happen in the foreseeable future.
Bitcoin has had a rough start to the year, with the overall cryptocurrency market slumping, as appetite for risk assets waned against a backdrop of persistently high inflation and the Federal Reserve's increasingly hawkish stance. The leading cryptocurrency fell below $36,000, and ether tumbled below $2,500 — both off from record highs of around $63,000 and $4,800, respectively.
One of the major drivers for crypto in the last two years has been the huge amounts of cheap cash that has emanated from fiscal and monetary stimulus programs during the pandemic, and much of that is now coming to an end.
JPMorgan said January's crypto market correction, in which bitcoin lost 17% in value, looks less like capitulation, or an extended period of decline, in comparison to last May when bitcoin fell 35%.
Still, strategists said the biggest challenge for bitcoin is its volatility, as it's often unappealing to institutional investors.
JPMorgan said cryptocurrencies are seeing hot growth relative to other alternative asset classes, but this doesn't have to stem from continually rising prices.
"This growth does not necessarily need to come from continuous price appreciation of existing cryptocurrencies such as bitcoin and ethereum, already popular among institutional investors, but in our mind it is more likely to come from the expansion of the universe of digital assets," the strategists said.

Bitcoin to Gold - Expect the top in 5 months not 5 weeks!Trying to make sense of Bitcoin's move, we should probably look at Bitcoin to Gold chart. Why? I think US Dollar has lost it's credibility as unit of account due to massive amount of newly printed dollars. Bitcoin to Gold shows an ascending triangle taking shape at the moment. Now the question is how we can predict when we will see the Bitcoin's top for this bull market cycle (halving cycle). If bitcoin follows the same pattern that is followed in late 2017, we should see the top in 5 weeks (end of Dec 2021 or early Jan 2022), but it has played out differently this time and there are some factors to consider.
The last cycle was fuelled by retail investors, but this cycle's drive is mainly institutional investors, which I believe they are delayed in entering the market and might take few months to see FOMO in institutional level. So this time we might see the top around May 2022. What news will cause the market crash? Probably Mt Gox bitcoin distributions. The top for this cycle, could be around 100oz Gold which might be around 200k-250k USD. I believe in the next cycle we will see the governments and central banks competing to get their hands on enough Bitcoin to not to lose their power. We can see USD $1 million in the next cycle top.
Yes. Bitcoin will become a global currency with $20 trillion dollar market cap by 2026 and we will see other countries copy El Salvador's move in making Bitcoin legal tender.
Back to the topic, here is the prediction. We sill see the top in this cycle around May 2022 due to the nature of decision making in companies which is more time consuming than the decision making process by retail investors. and we will see bitcoin hits 100oz gold per 1 BTC.


Goldbtc XAUBTC Gold in Bitcoin 6 KG Gold for 1 BitcoinSeems in two moths one will need to pay 6 KG Gold to get one Bitcoin.

BTCUSD/XAUUSD ratio secrets...The BTCUSD/XAUUSD chart shows in two dimension, the three dimensional relationship between the USD, Bitcoin and Gold.
Some interesting relationships appear...
Note that there are times when BTC increases whe Gold stagnates. There are peaks and during these times, the bitcoin acceleration is massive. Then comes the technical indicators where it comes down... and it does so with bitcoin dropping typically.
Unless Gold massively runs up to bring down the ratio, it is more likely for BTC to pull back given the rise of the USD or the rise in Gold or both.
Some patterns in the technical indicators show.... and it is about time for the RPM to commit to a cross down and come down, bringing bitcoin price down too.

Bitcoin vs. Gold ratioComparing the longest available Bitcoin chart (Bitstamp) on Tradingview with IDC gold price.
We went from 0oz-0.1oz. From 0.1oz-1oz From 1oz-10oz. Now we are on our way to 100oz/btc.
Will we be able to reach this ratio? What do you think? 1000oz/btc next? 🚀

ETH may be starting its catch up runEthereum usually follows the movements of Bitcoin. However, in the last 18 days, Bitcoin has had a massive run while Ethereum has stayed proportionally behind. BTC has gone 75% over is previous ATH while ETH remains 45% under its ATH. Suppose we are about to see a catch up run like in 2017. The gold denominated resistances are 20grs and 33grs. At current prices that is $1,220 and $2,013 respectively.
A run for the 2,000 dollars area could take the ETHBTC pair above the channel it's been for two years.
The idea of using resistances denominated in dollars-per-grams-of-gold is to account for the depreciation of the dollar.
