NASDAQ Breakout and Potential RetraceHey Traders, in today's trading session we are monitoring NAS100 fora buying opportunity around 25,450 zone, NASDAQ was trading in a downtrend and successfully managed to break it out. Currently is in a correction phase in which it is approaching the retrace area at 25,450 support and resistance area.
Trade safe, Joe.
Bulish

XAUUSD Buyers Step In — Market Aiming for $4,140 RetestHello traders! Let’s take a look at XAUUSD (Gold). XAUUSD maintains a bullish structure after bouncing from the key $4,050–$4,060 support zone, where price also retested the ascending trendline. After breaking out of the descending channel, Gold formed a new accumulation zone and moved higher, approaching the strong $4,140 resistance level. The price is now trading between the ascending support and the local supply zone near $4,140, forming a tightening structure. A breakout above this level could open the way for further upside, while a rejection may trigger a correction back toward $4,060. As long as XAUUSD holds above $4,060 and the ascending trendline, a renewed move toward $4,140 remains likely, with potential for a breakout. Please share this idea with your friends and click Boost 🚀

Bitcoin is going to the hell???hi follow me , boost this post and read
everything shows me that bull trend is over , weakness in highs , candles and the momentum
the targets for retracement is 83 to 74 and after that 50k
i know its hard to hear that but this is market he do what he wants so accept it.
thank you. i reply to questions anytime.

MARIPSX MARI :: Day Level
📈 MARI Trading Recommendation
Current Market Price (CMP): PKR 685
💎 Bullish Bias: BUY & HOLD
✅ My clear view: MARI is a strong buy for long-& Mid term investors. Fundamentals are solid, and the recent dividend announcement strengthens the positive outlook.
💹 Long-Term Investors:
Enter at the current price for early entry and hold for very strong returns.
Support Levels for Accumulation (if price dips):
🔹 654 (immediate support; key level after breaking smaller range Jan–Sep 2025)
🔹 643
🔹 620
🔹 610
This allows accumulating MARI at discounted prices while maintaining a bullish long-Mid term view.
📊 Technical Outlook:
Range Bound: Since January 2024, MARI has been trading in a broader range of 590–744.
Resistance: 723–744
Support: 590–612
Smaller Positive Range: 605–654, which has been positively broken.
654 now acts as key support.
⚡ Intraday / Short-Term Traders:
Monitor daily price action carefully. Not recoomended for intraday Trading but can manag as per below:
Rule: Do not hold if the price closes below 654 with a bearish candle on the daily chart.
A break below may lead to pullbacks toward 643–610.
Target TP1: 723 TP2: 744
Pattern: Formation of a bullish flag indicating potential upward movement.
✅ Summary:
Long-Mid term: Buy & hold 💎
Short-term: Watch 654 closely ⚡
Market sentiment favors upward movement, making MARI attractive for both accumulation and swing trading.

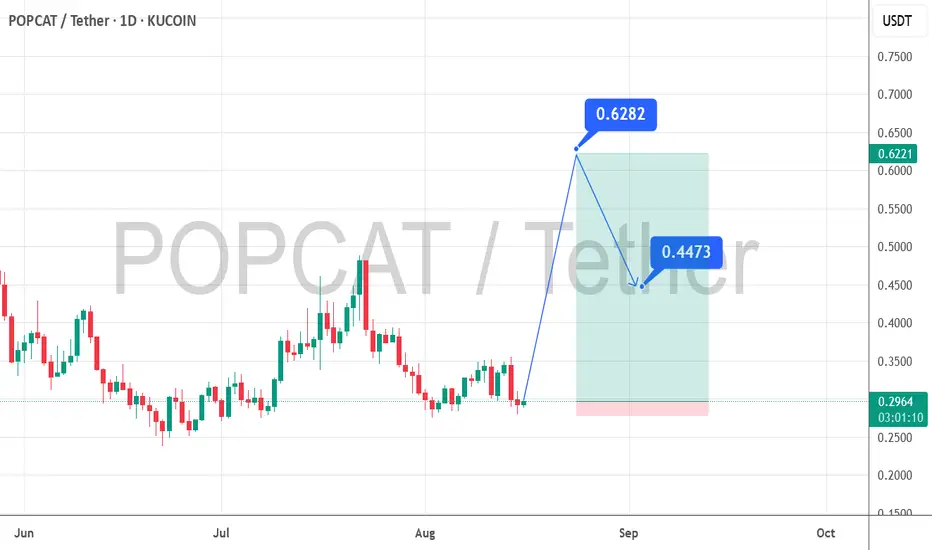
POPCATUSDT 100% Gains? After a period of consolidation, POPCAT is beginning to show signs of a bullish reversal. Indicators such as MACD and RSI are turning positive, and trading volume is on the rise — a classic setup for a breakout. If the price successfully breaks above the key resistance at $0.38, the next target could be around $0.63, representing a potential 100% gain from current levels.
Recent candlestick patterns also suggest strong buying pressure on the 4-hour and daily timeframes. With confirmation above resistance, this altcoin could be entering a powerful rally phase.
XUSDT on the Path to Higher PricesAccording to the chart, a buying opportunity has emerged for a potential XUSDT uptrend. Please make sure to apply proper risk management. As for me—I never do, but hey, I’m not sure about you!

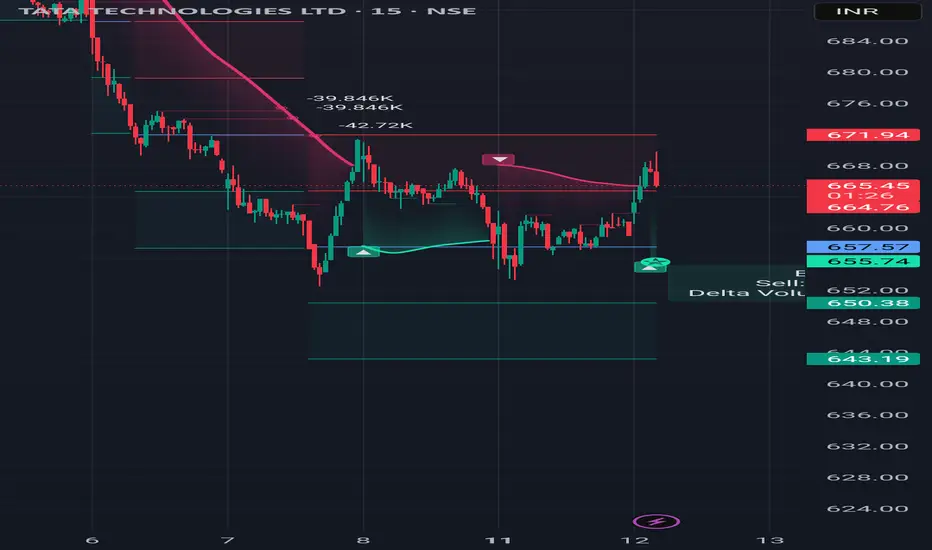
Short term Technical Idea TATATECH📢 PJV FINANCIAL – 1-2 DAYS TECHNICAL CALL 📢
🔷 SCRIPT: TATATECH
🔷 Action: BUY above ₹667.40
🔷 Stop Loss: ₹656 (📉 -1.71%)
🔷 Target: ₹688 (📈 +3.08%)
🔷 Risk–Reward Ratio: 1 : 1.80 ✅
📌 Short-term momentum trade idea – strictly follow SL.
🚀 #PJVSignals | 💼 #TechnicalCall
Gold remains bullish. But....Last week gold was very volitile. with big movements up to 700pips. During market closure gold got big pricegaps. Be carefull trading this volitile market.
Notice the longterm uptrend in the daily and weekly time frame. If we break it down to H2 we got a clear head and shoulder pattern. It will only be valid if gold manage to break the neckline of this pattern and break below the H2 FVG/support located around 3246 up to 3256. Confirmed break will send gold lower. If gold manage to break above the resistance trend our first bull target should be 3365 level.
I use Priceaction trading only.
Resistance: 3319, 3343, 3367, 3385
Support: 3294, 3246, 3232

VOE LONGAs you can clearly see the VOESTALPINE AG stock has found support at a key order block, aligning closely with the 50% Fibonacci retracement — a typical entry point for smart money. Since then, price action has stabilized and is starting to push higher. The declining short interest ratio suggests bearish pressure is easing, while the rising volume delta points to increasing demand. This confluence could signal accumulation and a potential continuation to the upside. Watching for further confirmation and a clean break above recent highs.
#SmartMoney #OrderBlock #VolumeDelta #Fibonacci50 #ShortSqueeze #AccumulationPhase #TradingStrategy #TechnicalAnalysis #MarketStructure #BullishSetup #PriceAction #Orderflow #SwingTrading #TradingViewIdeas

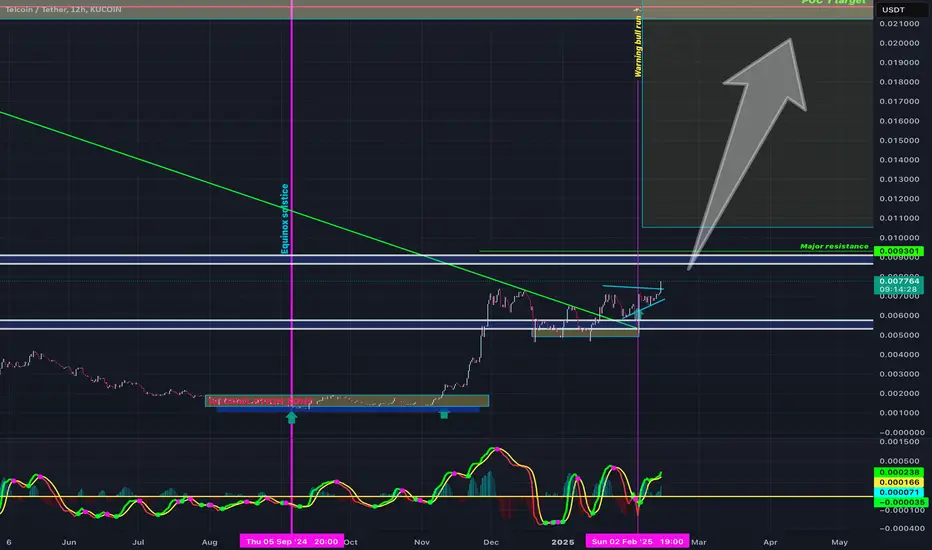
breaking the key resistance at $0.007761 suggest,bullish trend Telcoin is currently ranked #209, with a market cap of approximately $658.96 million.
Price today is gaining steam, breaking the key resistance at $0.007761 suggest a bullish trend, with the 50-day moving average rising and positioned below the current price, indicating potential support for future price movements.
Analysts have identified key resistance levels at $0.007761 and $0.013669. If TEL surpasses these levels, it could signal further upward momentum.
Conversely, support levels are noted at $0.00610 and $0.00472. A decline below these points may indicate potential downward movement.
Overall, Telcoin's recent performance indicates a optimistic outlook, don’t sleep on $telcoin
Let’s see how it holds 🍀✨
SPX: MTF Cluster Support at 5,810 with EMA Confirmation StrategyCurrent Technical Setup
The SP:SPX is testing a significant cluster support level at 5,810, identified by FibExtender Pro with multiple timeframe confluence. The price has shown a clear reaction at this level, making it a potential launching point for a bullish move.
Entry Conditions
Primary Triggers Required:
8 EMA crossing above 34 EMA on 30-minute chart (currently bearish)
Price breaking above last swing high at 5,850
Price holding above cluster support at 5,810
Price Targets
First target: 6,000 (psychological level and major cluster resistance - 4 levels)
Second target: 6,170 (cluster resistance - 3 levels)
Risk Management
Stop Loss Parameters:
Place stops below 5,810 cluster support
Exit if price fails to hold above EMAs after entry
Cancel setup if entry triggers aren't activated
Timeframe Analysis
30-Minute Chart:
Currently bearish configuration
8 EMA below 34 EMA
Waiting for bullish crossover and Price breaking above last swing high at 5,850
Weekly Chart:
Strong bullish structure
Moving averages stacked positively
5,810 cluster support adds confluence
50 EMA > 200 EMA (bullish)
Time-Based Considerations
The January 13 time cluster provides an additional layer of confluence for potential trend reversal. This timing aligns with Fibonacci principles suggesting higher probability setups when time and price zones converge.
Special Notes
The mixed signals between timeframes require patience. The weekly chart provides a strong bullish foundation, but entry must wait for 30-minute confirmation signals to align. The setup becomes invalid if price breaks below cluster support without triggering entry conditions.

avax long midterm"🌟 Welcome to Golden Candle! 🌟
We're a team of 📈 passionate traders 📉 who love sharing our 🔍 technical analysis insights 🔎 with the TradingView community. 🌎
Our goal is to provide 💡 valuable perspectives 💡 on market trends and patterns, but 🚫 please note that our analyses are not intended as buy or sell recommendations. 🚫
Instead, they reflect our own 💭 personal attitudes and thoughts. 💭
Follow along and 📚 learn 📚 from our analyses! 📊💡"

theta long midterm"🌟 Welcome to Golden Candle! 🌟
We're a team of 📈 passionate traders 📉 who love sharing our 🔍 technical analysis insights 🔎 with the TradingView community. 🌎
Our goal is to provide 💡 valuable perspectives 💡 on market trends and patterns, but 🚫 please note that our analyses are not intended as buy or sell recommendations. 🚫
Instead, they reflect our own 💭 personal attitudes and thoughts. 💭
Follow along and 📚 learn 📚 from our analyses! 📊💡"

doge long midterm"🌟 Welcome to Golden Candle! 🌟
We're a team of 📈 passionate traders 📉 who love sharing our 🔍 technical analysis insights 🔎 with the TradingView community. 🌎
Our goal is to provide 💡 valuable perspectives 💡 on market trends and patterns, but 🚫 please note that our analyses are not intended as buy or sell recommendations. 🚫
Instead, they reflect our own 💭 personal attitudes and thoughts. 💭
Follow along and 📚 learn 📚 from our analyses! 📊💡"

etcusdt midtem long"🌟 Welcome to Golden Candle! 🌟
We're a team of 📈 passionate traders 📉 who love sharing our 🔍 technical analysis insights 🔎 with the TradingView community. 🌎
Our goal is to provide 💡 valuable perspectives 💡 on market trends and patterns, but 🚫 please note that our analyses are not intended as buy or sell recommendations. 🚫
Instead, they reflect our own 💭 personal attitudes and thoughts. 💭
Follow along and 📚 learn 📚 from our analyses! 📊💡"

etc long midterm"🌟 Welcome to Golden Candle! 🌟
We're a team of 📈 passionate traders 📉 who love sharing our 🔍 technical analysis insights 🔎 with the TradingView community. 🌎
Our goal is to provide 💡 valuable perspectives 💡 on market trends and patterns, but 🚫 please note that our analyses are not intended as buy or sell recommendations. 🚫
Instead, they reflect our own 💭 personal attitudes and thoughts. 💭
Follow along and 📚 learn 📚 from our analyses! 📊💡"

atomusdt buy midterm"🌟 Welcome to Golden Candle! 🌟
We're a team of 📈 passionate traders 📉 who love sharing our 🔍 technical analysis insights 🔎 with the TradingView community. 🌎
Our goal is to provide 💡 valuable perspectives 💡 on market trends and patterns, but 🚫 please note that our analyses are not intended as buy or sell recommendations. 🚫
Instead, they reflect our own 💭 personal attitudes and thoughts. 💭
Follow along and 📚 learn 📚 from our analyses! 📊💡"

etcusdt Ethereum bitcoin "🌟 Welcome to Golden Candle! 🌟
We're a team of 📈 passionate traders 📉 who love sharing our 🔍 technical analysis insights 🔎 with the TradingView community. 🌎
Our goal is to provide 💡 valuable perspectives 💡 on market trends and patterns, but 🚫 please note that our analyses are not intended as buy or sell recommendations. 🚫
Instead, they reflect our own 💭 personal attitudes and thoughts. 💭
Follow along and 📚 learn 📚 from our analyses! 📊💡"

fil filusdt midterm long"🌟 Welcome to Golden Candle! 🌟
We're a team of 📈 passionate traders 📉 who love sharing our 🔍 technical analysis insights 🔎 with the TradingView community. 🌎
Our goal is to provide 💡 valuable perspectives 💡 on market trends and patterns, but 🚫 please note that our analyses are not intended as buy or sell recommendations. 🚫
Instead, they reflect our own 💭 personal attitudes and thoughts. 💭
Follow along and 📚 learn 📚 from our analyses! 📊💡"
update of filusdt.I think the bulish trend will start soon.

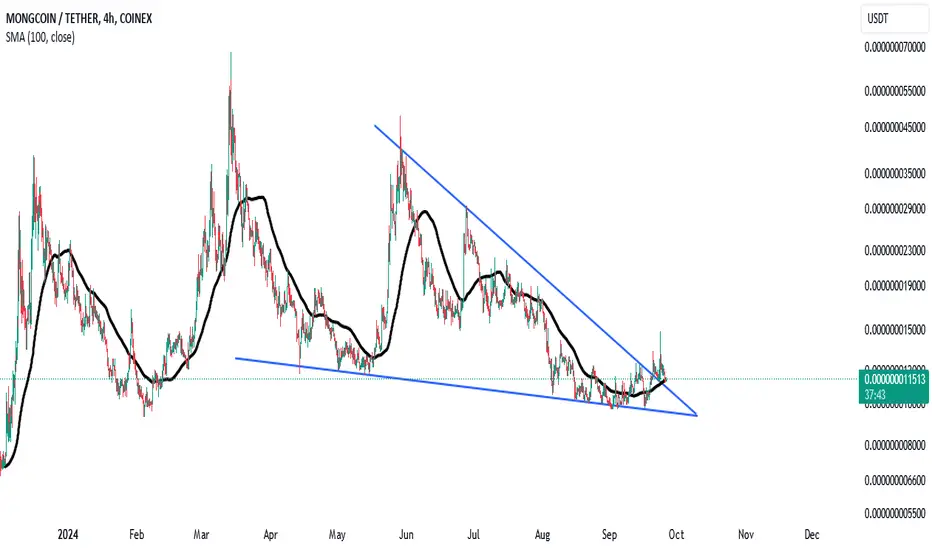
Ready to launch, don't miss MONGThe heavy accumulations in the last month by the big whales of the market show the explosive movement of this meme, don't neglect buying and holding, it behaves like Turbo.

Bitcoin at a Crossroad: Bullish or Bearish?
Bitcoin is currently testing key support and resistance zones, creating two potential outcomes:
Bullish Scenario: If Bitcoin successfully bounces off the current support level around $60,000 and breaks through the first resistance at $70,000 (first condition), we could see a move toward $80,000 or higher. This upward momentum would indicate a continuation of the recent bullish trend, attracting more buyers and potentially leading to new highs.
Bearish Scenario: On the flip side, if Bitcoin fails to hold the $60,000 support level and drops below the second condition (around $50,000), we could see a bearish trend unfold. In this case, the next support level would be near $40,000, as indicated in the chart. A breakdown here might trigger panic selling, pushing Bitcoin further down to retest lower levels.
Watch closely how Bitcoin reacts in the coming days, as these levels will be critical in determining the market direction.
This explanation provides clear insights into both bullish and bearish scenarios, depending on how Bitcoin interacts with the key support and resistance levels shown in the chart.

Heavy accumulation, big pump 2024 for MONGUSDTVery heavy accumulation in the wallets of large currency holders indicates a heavy jump in the price of this currency, the time and price correction is nearing its end, wait and enjoy the fruit.
$RUTSeptember will likely determine the market's direction for the rest of the year. Key U.S. economic indicators, such as the Consumer Price Index (CPI) and unemployment rates, released in the first couple of weeks of September, will provide more confidence to investors. Currently, the market is pricing in a potential rate cut on September 18.
Positive economic news is likely to encourage risk-on behavior, which could be particularly evident in U.S. small-cap companies and may spill over into traditionally riskier markets like cryptocurrencies. Historically, rate cuts have led to very short-term risk-on behavior before major drops in global indices.
