Last Corrective wave of bitcoin After reaching $30k in last month, Bitcoin has increased to $50,000 and "B wave" of Elliot has Formed. We have an important fibonacci cluster in $50,000 zone, now we are wating to last Corrective wave that names "C wave" in Elliot theory. It shows us we have a bearish market in september. There are four important level In front of Bitcoin, 41000-43000, 36000-37000, 30000 and 27000. It can be last wave of bearish market, after that we are coiming back to Uptrend and Move to $100,000.
Bulish

New updated possible upcoming Levels of Dogecoin...Here is the new updated possible upcoming level for Dogecoin.

FedEx (FDX) bearish scenarioThe technical figure Triangle can be found in US company FedEx Corporation (FDX) at daily chart. FedEx Corporation, formerly Federal Express Corporation and later FDX Corporation, is an American multinational shipping & delivery services and supply chain management company headquartered in Memphis, Tennessee. The Triangle has broken through the support line on 28/07/2021, if the price holds below this level you can have a possible bearish price movement with a forecast for the next 9 days towards 274.60 USD. Your stop loss order according to experts should be placed at 301.95 USD if you decide to enter this position.
Risk Disclosure: Trading Foreign Exchange (Forex) and Contracts of Difference (CFD's) carries a high level of risk. By registering and signing up, any client affirms their understanding of their own personal accountability for all transactions performed within their account and recognizes the risks associated with trading on such markets and on such sites. Furthermore, one understands that the company carries zero influence over transactions, markets, and trading signals, therefore, cannot be held liable nor guarantee any profits or losses.

Wait Double Bottom (XAUUSD) for Bullish ContinuationCondition
- 2 Candle Bulish Cross above EMA 200 (reversal sign)
- Wait Double bottom Near SNR area of determination
- Bulish confirmation candle at bottom 2
R : R , 1 : 1.5
Good Luck and be Fleksible ..

NZDCAD-1H-Long positionHello guys;
On this pair,the price is making a bullish pattern like falling wadge So on 4H support level the wave c will complete then we can enter to buy position after we see a reversal candlestick pattern on 4H support Level till the price reaches our targets.
Please put your comment and like .
If you would like my vision , analysis please follow me thanks guys.


$XPEV Xpeng - investment idea 💡Alerting $XPEV based on technical analysis only
- Double button on the daily
- Technical indicators looking ready to signal on daily & weekly charts


bulls push the EJ up...price is under monthly and weekly historical resistance.if resistance hold the price then can expect price to test the 131.00 support zone.but if price break the resistance then we can expect it to go to next level at 133.50 then 137.00 as a strong resistance.
in daily time frame support zone at 131.00 keep the price and push it up so we are bullish on EJ for now.

Alphausdtalpha break the correction lane and complete pullback now
fibo time show us after a hug upside move a correction made then it back and make a new high
every upside movement more than 700% profit so i think it can do it again .
Like and comment if you agree with me

Will it break-free tomorrow or wait until SNL?Looks like either we are breaking free by tomorrow afternoon or waiting until SNL. Interesting to watch!
Please share your thoughts, ideas, and evaluation. If you liked this analysis, smash the like button which will motivate me to publish more of my analysis often. Thanks for viewing!
Disclaimer: There is a very high degree of risk involved in trading. This is my very personal analysis and it does not intend to be a bit of advice in anyways.

Reverse head and shoulder pattern in BTCUSDTIt can be seen that a reverse head and shoulder is being developed in BTCUSDT chart. It indicates that there is a desire to make a bullish reversal

BTC Major Reversal Divergence, this could continue to drop...After reviewing the MACD on the daily chart, you can see the distinct lower highs, but the chart continued higher highs. Now the signal line has passed Zero and technically bearish we need to find the next reversal. Will this continue to dip, will it dip enough to test the daily 200MA around the 43k mark.

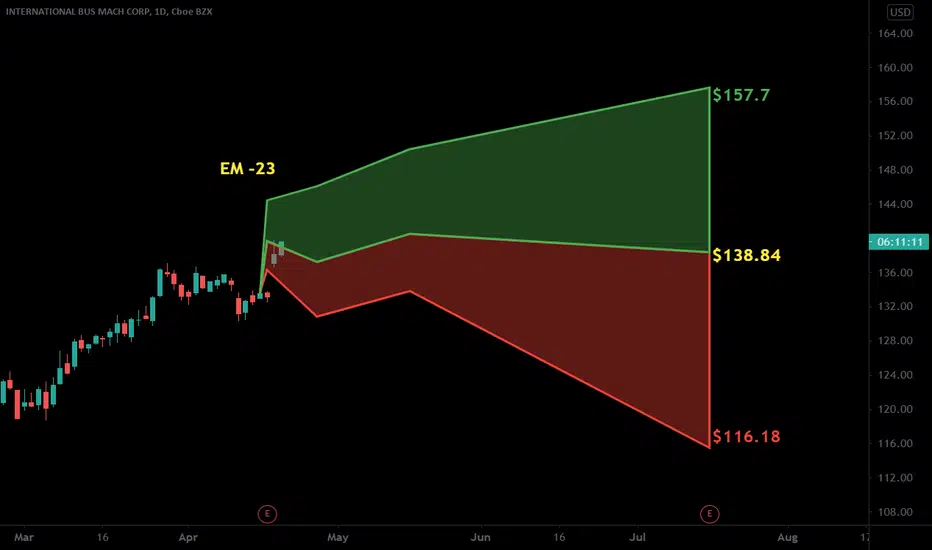
$IBM with a Bullish outlook following its earnings #Stocks The PEAD projected a Bullish outlook for $IBM after a Positive under reaction following its earnings release placing the stock in drift A
If you would like to see the Drift for another stock please message us. Also click on the Like Button if this was useful and follow us or join us.
GBPJPY Trade Idea.Since UK session opening GBP is looking stronger currency pair, while JPY also shows some strength but GBP lead the market, a breakout of channel will lead to more bullish.


ZIL/BTC Long Breakout (H4)Trades > Create:
(Current Price: 0.00000327)
Either confirm or choose to edit the trade
⚡⚡ #ZIL/BTC ⚡⚡
Client: Binance 01
Trade Type: Breakout (Long)
Entry Targets:
1) 0.00000361 - 100.0%
Take-Profit Targets:
1) 0.00000427 - 51.612%
2) 0.00000469 - 25.806%
3) 0.00000538 - 12.903%
4) 0.00000644 - 6.451%
5) 0.00000717 - 3.225%
Stop Targets:
1) 0.00000296 - 100.0%
Trailing Configuration:
Entry: Percentage (0.0%)
Take-Profit: Percentage (0.0%)
Stop: Moving Target -
Trigger: Target (2)

SFPUSD Up 50%Hello traders!
As I told you that sfpsusdt is the best pair to hold as a strong push was expected. Now you can see a strong rise and it adds 50% of the investment but bulls are not over yet it will break the previous high soon.
Support my ideas by hitting the like button and follow to stay connected
sfpusdt previous analysis

NIFTY LONG INTRADAY 3 MAR,2021Dear trader,
If u look at the chart of NIFTY (analysis based intraday only) the NIFTY support 1 at 14950 and support 2 at 14900 and resistance at 15100.
The chart clearly indicates Bullish Trend you can also see the candle stick patters for more in depth analysis.
In Intraday most important thing is to enter and exit points.
Our signals are based on analytics, algorithms, mathematical derivatives.
Always be a responsible trader, kindly trade only when you have maximum opportunity in the market with minimum risk and with keynotes like data, analysis and proper strategies.
Kindly message us for strategies and analysis.

all the way BULISHit seems we're going to see another super bullish breakout from DOGE, but this time on its self without ELON
