Bull Flag possibly forming on SilverDespite silver in over-bought territory, this pattern shows a potential bull flag forming on silver and the target price is just above $100/oz. Not financial advice but this is a pattern I see possibly playing out.
Bullflagpattern

Ascending Channel | Golden Zone Retracement SetupAfter analyzing the chart on the 2-hour timeframe, price action has been moving within a well-defined ascending channel since Tuesday, 25 November 2025. The upper boundary of the channel has been consistently respected, confirming the strength and validity of this bullish structure.
Following a rejection from the upper boundary, price is currently trading around 1.17403. At this stage, the market appears to be developing a bearish corrective structure, resembling either an upper flag formation or a falling broadening wedge, which is still in progress and not yet completed.
Based on this structure and overall market behavior, we anticipate a potential retracement toward the Fibonacci Golden Zone, which aligns with our projected price target. This area may act as a key decision zone for the next directional move, especially if supported by price action confirmation and volume reaction.
Traders should monitor price behavior closely around the channel boundaries and Fibonacci levels for high-probability setups.
Happy Trading
SpicyPips

Bullish Flag Formation on QNTQNT formed a bullish flag, the movement reached the liquidity area that was at the bottom
It is more likely that an upward movement and a pattern execution are expected, reaching the liquidity level formed above
Full breakdown with levels and graphs on the website

GBP/USD: Very Bullish PatternThe GBPUSD pair is currently trading in a long term bullish trend.
Earlier this month, the market established a new higher high, subsequently initiating a corrective movement.
A bullish flag pattern has formed, within which a minor bearish trend has been established.
Yesterday, the pair began to appreciate, with buyers successfully violating the resistance level of the flag.
This development may potentially instigate a trend-following movement.
The next objective is 1.3385.

XRP Review With Focus on Trend Shifts XRP is completing the previously formed bearish butterfly pattern on the global timeframe.
At the same time, a large bullish flag is visible in the chart structure, within which the price continues to move. The lower liquidity zone has already been fully engulfed, while the upper liquidity zone remains intact, making it potentially attractive for a subsequent test.
Also, each new correction forms a higher bottom, indicating a possible global trend recovery. If the lower boundary of this liquidity zone is broken, the structure could shift to a deeper downward movement.
Full breakdown with levels and graphs on the website

BNB Market Structure ReviewBNB is moving within global patterns, an ascending expanding wedge within which a bullish flag has formed.
Five liquidity zones have formed above.
Below, two liquidity zones have formed, the first from January 2025 and the second from February 2024.
Given the Fed's rate tightening plan, the movement is more likely to be upward. Globally, it could reach the previous ATH or even the upper boundary of the wedge.
Also, on the longs and shorts map, it appears that longs are currently in excess.
The liquidity map shows that the enormous liquidity is forming at the top, not the bottom.
According to the media, the indicator is positive, in response to CZ's comment regarding the Fed.
Also, given that BTC is being prevented from breaking the lower boundary of the pattern we discussed in our previous review, BNB's movement against BTC is more likely to be upward along the designated liquidity zones.
If the lower boundary of the pattern is broken, and the candlestick forms deeper than the previous candlestick, the movement is more likely to be upward. downward, with a false breakout to the liquidity area highlighted in red

TWLO | Big Moves Coming After 3 Year Consolidation | LONGTwilio, Inc. engages in the development of communications software, cloud-based platforms, and services. It operates through Twilio Communications and Twilio Segments. The Twilio Communications segment includes the platforms Messaging and Voice. The Twilio Segment involves Segment, Engage, Flex, Email, and others. The company was founded by John Wolthuis, Jeffery G. Lawson, and Evan Cooke in March 2008 and is headquartered in San Francisco, CA.

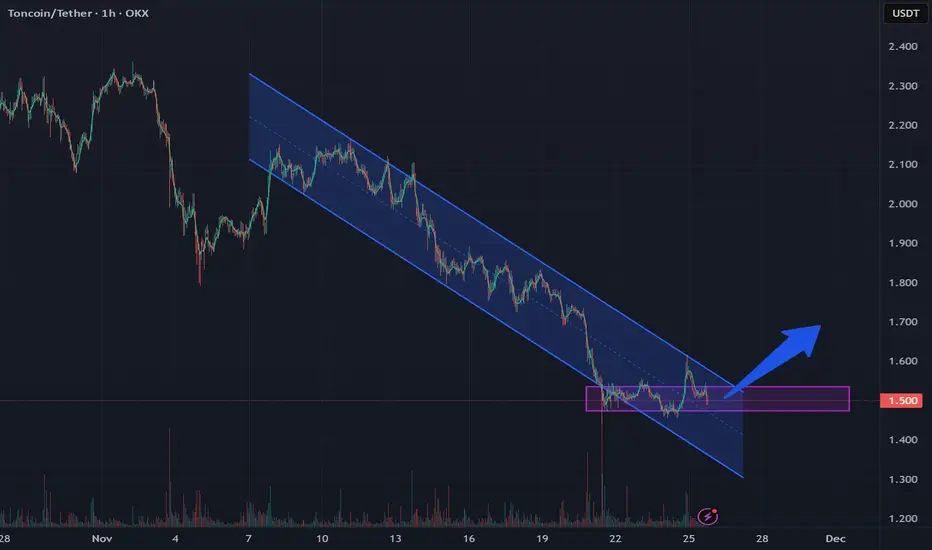
TON forms a bullish flag pattern with a local liquidity zoneTON has formed a bullish flag pattern, and we've also reached the local liquidity zone we've collected
According to the pattern, an upward rebound is expected
Current price: $1.492
If the price falls below the zone of interest and consolidates below, the movement will continue in a downward corridor within the pattern
DASH shows accumulation breakout potentialIt's highly likely that DASH will break out of its accumulation zone
A typical pattern has formed on the chart
Declining within the channel – forming a bullish formation (pGIP in this case) – transition to growth
A locally developed Head and Shoulders pattern, which is usually followed by growth
Dash is also in the anonymous coin narrative, which is currently performing well...
Current price: $76
Based on the above, it's highly likely that the price could reach $85 and above...
If the price breaks below the purple area shown in the chart and consolidates, a downward movement is likely

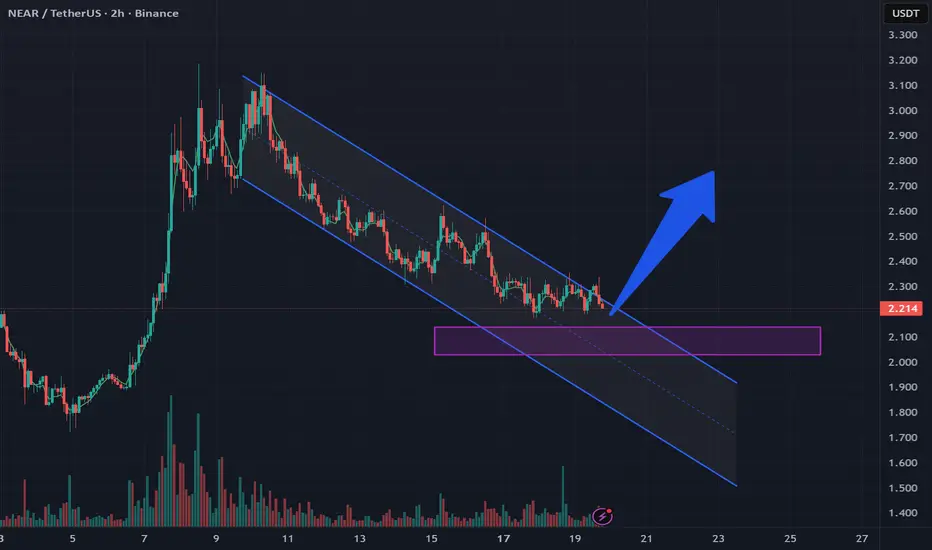
NEAR shows bullish flag setup with potential for upward movementNEAR has formed a bullish flag pattern, and sideways movement is also observed within the pattern
A move higher is more likely, above the MA50 and MA200 , followed by a move to the $2.431 area and beyond
Current price: $2.298
Upwards to the purple area and below are more likely, and the price is more likely to decline further
$BTC: ITS NOT GOOD TO REMAIN BELOW THE 200D SMACRYPTOCAP:BTC appears to be forming either a bullish flag or a falling wedge (although it hasn’t yet fully completed). Regardless, the recent drop has caused it to fall below the 200-day SMA, and attempts to recover above this level over the past two days have been unsuccessful. This is not a positive sign.
DIS | A Possible Bull Flag On Disney | LONGThe Walt Disney Co. engages in the business of international family entertainment and media enterprise. It owns and operates television and radio production, distribution and broadcasting stations, direct-to-consumer services, amusement parks, and hotels. It operates through the following business segments: Disney Entertainment, ESPN, and Disney Parks, Experiences, and Products. The company was founded by Walter Elias Disney on October 16, 1923 and is headquartered in Burbank, CA.

EBAY | This Retail Business Will BOOM | LONGeBay, Inc. is a commerce company, whose platforms include an online marketplace and its localized counterparts, including off-platform businesses in South Korea, Japan, and Turkey, as well as eBay's suite of mobile apps. It offers a platform for various product categories, including parts and accessories, collectibles, fashion, electronics, and home & garden. eBay generates revenue mainly through fees from sales, payment processing, and advertising. The company was founded by Pierre Morad Omidyar in September 1995 and is headquartered in San Jose, CA.

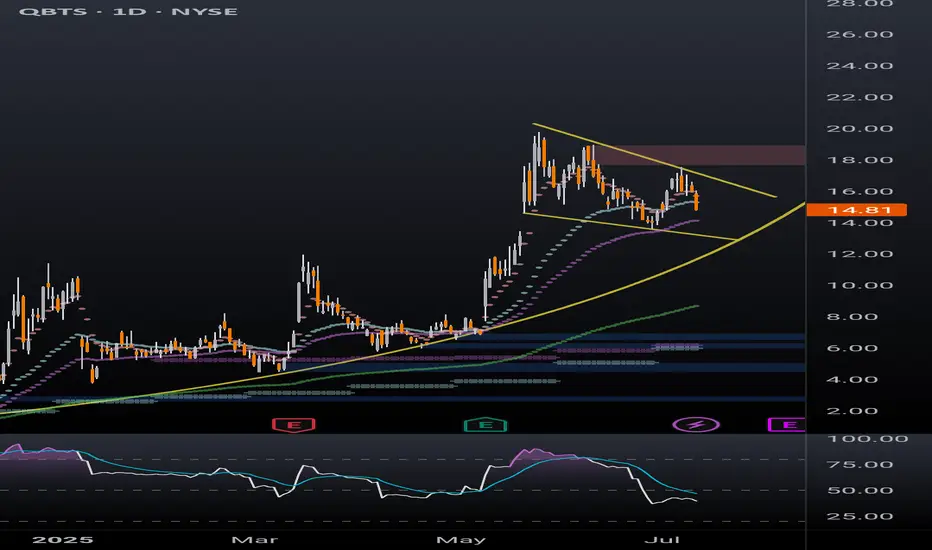
QBTS — RS 99 Leader in a Leading Group | Textbook Bull Flag This chart highlights a classic bull flag continuation setup on D-Wave Quantum (QBTS) — a high Relative Strength (RS 99) name within the Computer–Hardware/Peripheral industry group, one of the top-ranked sectors in the current market.
Even though QBTS’s earnings don’t fully meet traditional CANSLIM criteria, this setup shows why focusing on leading themes, strong groups, and RS leadership can be just as powerful in identifying potential big winners.
Key Leadership Factors:
✅ High RS (99)
✅ Leading Industry Group
✅ Part of the 2025 AI/Quantum Theme
Following a sharp 100%+ move (the flagpole), NYSE:QBTS consolidated in a tight, downward-sloping flag with low-volume pullbacks — a textbook structure signaling healthy digestion of gains.
The breakout came on expanding volume, confirming renewed institutional buying pressure.
Key Technical Traits:
-Strong flagpole with explosive volume
-Pullback of ~19% on lighter volume
-Rising key moving averages
-Breakout on heavy volume
This is a Qullamaggie-style momentum continuation setup — clean, structured, and high risk/reward.

AVAV | Great Investment Medium Term | LONGAeroVironment, Inc. engages in the design, development, and production of multi-domain robotic systems and related services for government agencies and businesses. It operates through the following business segments: UnCrewed Systems, Loitering Munitions Systems, and MacCready Work segments. The UnCrewed System segment focuses primarily on small UAS products designed to operate reliably at lower altitudes in a wide range of environmental conditions. The Loitering Munitions Systems segment focuses primarily on tube-launched aircraft that deploy with the push of a button, fly at higher speeds than small UAS products, and perform either effects delivery or reconnaissance missions, and related support services including training, spare parts, product repair, and product replacement. The MacCready Works segment focuses on customer-funded research and development in the areas of HAPS, robotics, sensors, software analytics, data intelligence and connectivity. The company was founded by Paul B. MacCready, Jr. in July 1971 and is headquartered in Arlington, VA.

LTC in a bullflag LTC is creating a bull flag to finally get to the breakout. This move shall bring LTC to the resistance and allow its price to break it with lower volatility. A breakout with low volatility is the best thing that can happen so that PA can accelerate once the resistance is broken and we get the volume. IMO, over the weekend we will see important PA to the upside.

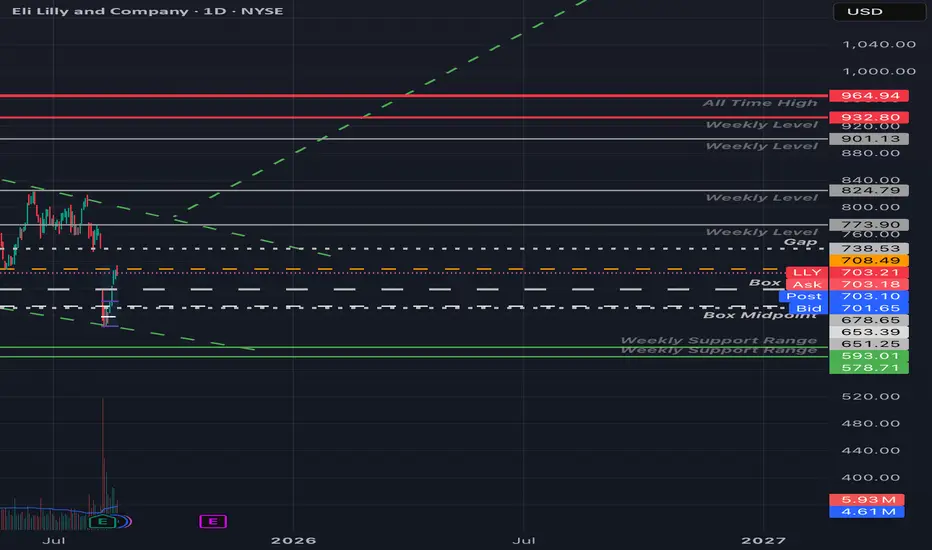
LLY - Clean Levels UpdatedEli Lilly's hit those 708.49 and 711 levels I mentioned in my previous LLY post.
I've added some weekly levels, and a couple relevant spots from my boxed LLY chart.
If LLY loses steam up here we could easily see a retest of that box top area in the $680 - $678 range. Otherwise if we see a market wide reversion from today's liquidation, and LLY clears today's high(~714) and firmly holds that high volume area, that gap($738) fill would be a no-brainer.
Personally leaning on the side of a short continuation(in the near time at least), didn't really trust the low volume float up over the last few trading days, and definitely don't like the decreasing volume into that $711 - $714 area (I'd consider it a Look above and fail).
Regardless of bias, we trade what we see.
~ The Villain.
QBTS bull flag dailyBetter look at quantum computing ticker QBTS bull flag on the daily timeframe. Previous post looked at the weekly timeframe to highlight the bullish momentum. Lots of retail money piled into this one in the last few months, a breakout of this bull flag will likely be followed by a parabolic move.
XRP: Ripple Ready to Unleash a Tsunami?Ripple (XRP) is coiling like a spring—ready to explode. After five clean re-tests of a powerful demand zone, buyers have repeatedly stepped in to defend key levels, launching 40–75% swings each time. Is this the moment it unleashes the wave?
🔍 Technical Breakdown:
✅ Demand Zone Strength
XRP is bouncing from a long-tested demand zone (5+ re-tests). Each bounce led to substantial upside momentum.
✅ Bull Flag Retest
XRP previously broke out of a large bull flag and has been holding the flag’s top trendline for over 40 days—acting as strong support.
✅ Higher Low Structure
Price formed a higher low (H/L) and has climbed steadily for two weeks—building bullish structure.
✅ Volume Profile
Price reclaimed ground above the high-volume node, signaling accumulation strength.
✅ Market Cipher B Divergence
A weekly hidden bullish divergence is present—not massive, but notable—hinting at momentum shift.
⚠️ What to Watch:
Volume is key: Current consolidation shows a decline in volume—a surge could ignite the breakout.
Confirmation for conservative traders: Wait for a break and hold above $2.33 with volume, or a retest of that level.
If past demand zone reactions repeat, a breakout could be imminent.
What do you think?
📈 As always—this is not financial advice. Do your own research.
🧭 Happy Hunting!

Beyond the Headlines - Gold Outlook June 16-20, 2025Beyond the Headlines: Gold's Ascent Amidst Global Shifts & Key Technicals 🌐🚀
Everything about the last week can be found here:
OANDA:XAUUSD 💰📈
We all know what's going on, I believe. Israel struck Iran 💥, and this conflict will likely take a bit before things cool down. 🥶
---
## Geopolitical News Landscape 🌍📰
### Israel / Iran
Since June 12, Israel launched "Operation Rising Lion," targeting Iranian nuclear sites like Natanz and Esfahan – over 128 killed, Iran claims. 🇮🇷 retaliated with missile and drone strikes on Haifa and Tel Aviv, killing at least 10. 🚀
**Outlook:** 🔥 Tensions are spiraling. Without urgent mediation, full-scale regional war remains a real risk. 💣
### India / Pakistan
Since the May ceasefire, few clashes have occurred. However, both navies increased readiness, signaling potential escalation at sea. 🚢
**Outlook:** ⚖️ Peace is fragile. A strategic dialogue is key to avoiding a renewed border or maritime conflict. 🙏
### Gaza Conflict
Between June 7–15, Israeli strikes killed at least 41 Palestinians, including 8 near an aid center in Rafah. Over 55,000 total deaths, and famine is looming. 💔
**Outlook:** 🆘 Gaza remains a humanitarian catastrophe. Global pressure for access and a ceasefire must intensify. 🕊️
### Russia / Ukraine
June 13–15: Russia returned the bodies of 1,200 Ukrainian soldiers in a rare POW swap gesture. 🤝 Fighting remains intense in Sumy and Toretsk; Russia hit a major oil refinery. 🏭
**Outlook:** 🕊️ While symbolic moves continue, no peace is in sight – battlefield outcomes will shape diplomacy. ⚔️
### U.S. - China Trade War
The U.S. hiked tariffs to 55% on key Chinese goods. 🇺🇸🇨🇳 responded with 10% on U.S. imports. Talks yielded a partial truce, but military-use rare earths remain unresolved. 💻
**Outlook:** 🔧 Tech remains the battleground. Without progress on critical materials, the trade war may deepen. 📉
### Global Trade War
The OECD revised global growth downward due to rising tariffs from the U.S. targeting 🇨🇳, 🇲🇽, 🇨🇦. Global trade volume is expected to shrink by 0.2–1.5%. 📉
**Outlook:** ⛓️ Supply chain disruption is spreading. Global trade will stay under pressure without coordinated policy. 🌍➡️🌍
### Trump vs. Powell
Trump labeled Powell a "numbskull" for not cutting rates, suggesting he might "force something" if re-elected. 🗳️ The Fed maintains policy independence ahead of a critical June decision. 🏛️
**Outlook:** ⚔️ Political pressure on the Fed is mounting. Expect more friction as the election cycle heats up. 🔥
### U.S. Inflation
CPI rose 2.4% YoY in May (from 2.3%); Core CPI held steady at 2.8%. Monthly growth was modest at 0.1%. Key rises were seen in healthcare and vehicle prices. 🚗🏥
**Outlook:** Inflation is stable but sticky. 🚦 The Fed will likely hold rates steady until clearer disinflation signals appear. 📊
---
## Technical View 📐📈
### Market Structure:
Gold shows a clear **bullish market structure** with higher highs and higher lows. ⬆️ Recent price action suggests we're in a strong uptrend with institutional buying pressure. 🏦
### Key Levels:
* The chart shows a significant low around the **$3,245 area** (marked as "Low") which could act as a key institutional support level. 💪
* The current high near **$3,446** represents a potential institutional resistance zone. 🛑
* Look for potential **order blocks** around the **$3,380-$3,400 range** where price consolidated before the recent breakout. 🧱
### Fair Value Gaps (FVG):
There appear to be several gaps in the price action during volatile moves, particularly during strong rally phases. These could act as future support/resistance areas. 📉📈
### Gann Analysis:
The price movement shows strong adherence to Gann principles:
* The rally from the low follows a steep angle, suggesting strong momentum. 🚀
* Key Gann angles would place support around the **$3,300-$3,320 zone**. 📐
* The current price near **$3,436** is testing natural resistance levels based on Gann square calculations. 📏
### Fibonacci Levels:
From the significant swing low to the current high:
* 23.6% retracement: ~$3,395 📉
* 38.2% retracement: ~$3,370 📉
* 50% retracement: ~$3,345 📉
* 61.8% retracement: ~$3,320 📉
The golden ratio levels suggest key support on any pullback would be around the **$3,370-$3,345 zone**. ✨
### Institutional Levels:
* **Weekly/Monthly Levels:** The **$3,400** and **$3,450** areas appear to be significant institutional levels based on round numbers and previous price action. 🏦💰
* **Smart Money:** The accumulation pattern before the breakout suggests institutional participation. 🧠💡
### Cycle Timing:
Based on the timeframe (appears to be 30-minute bars from May 26-June 15):
* We're seeing approximately **3-week cycles** in the major moves. 🗓️
* The current rally phase appears to be in its mature stage. 🌳
* The next potential cycle turn could be approaching, suggesting caution for new longs at current levels. ⚠️
---
### Trading Considerations:
* Watch for rejection at current levels near **$3,446**. 📉
* Key support confluence around **$3,370-$3,345** for potential re-entry. 🎯
* Volume and momentum divergences would be critical for timing any reversal. 📊🔄
Other indicators tend to show bullish scenario enhancements. 🚀
Gold has formed a ** Standard Bullish Flag pattern ** over a time from early April till today. 🚩🐂
Also, the structure of a ** reverse Head & Shoulders ** is existing and has broken the neckline! 🔄🗣️
Another indicator is an existing "** Ascending Bull Flag **." ⬆️🚩
Please take the time to let me know what you think about this. 💬
-------------------------------------------------------------------------
This is just my personal market idea and not financial advice! 📢 Trading gold and other financial instruments carries risks – only invest what you can afford to lose. Always do your own analysis, use solid risk management, and trade responsibly.
Good luck and safe trading! 🚀📊

Turbulent Week Ahead? Gold Outlook June 9-13, 2025Hey fellow traders,
Let's dive into the OANDA:XAUUSD outlook for the upcoming week, June 9-13, 2025. The recent price action has been a rollercoaster 🎢, and the next few days promise even more fireworks 🎇.
Looking back at the 30-minute chart from May 22 to June 6, gold saw an initial consolidation, then a strong rally to multi-week highs near 3,420. However, this was followed by a sharp, dramatic reversal, pushing prices back below 3,300. This "bull trap" 🐂 pattern suggests underlying weakness and potential preemptive market positioning.
Another view on this could be the possibility that a gap on the chart at 3300-3295 of around $5 could get closed. Since strong support is right below this, it could serve as a good launchpad 🚀 for an upward rally. Let's see if the upcoming Asia session on Monday triggers this because its only - $14 from $3309.
Key Drivers for the Week Ahead:
📅 June 9, 2025 (Monday)
US-China High-Level Trade Talks Commence in London
High-level delegations from the United States and China began trade discussions in London. This meeting followed an announcement by President Donald Trump on Friday, June 6, 2025, who described a preceding 90-minute phone call with Chinese President Xi Jinping as "very positive".
The US delegation included Treasury Secretary Scott Bessent, Commerce Secretary Howard
Lutnick, and US Trade Representative Jamieson Greer, reflecting a coordinated approach to addressing complex trade issues. The talks were primarily aimed at resolving the ongoing bilateral trade war, with a particular focus on tariffs and the global supply of critical rare earth minerals.5 While no specific time for the commencement of talks was provided, it is understood they began during London's daytime, approximately (10:12 CEST / 04:12 EDT).
These discussions occurred in the context of a temporary 90-day agreement reached on May 12, 2025, which had seen the US reduce its tariffs on Chinese imports from 145% to 30%, and China reciprocate by lowering its tariffs on US goods from 125% to 10%.9 However, this temporary truce is set to expire in early August, and President Trump had recently accused China of violating the agreement, specifically regarding critical mineral exports. The broader bilateral relationship remains strained by issues extending beyond tariffs, including restrictions on advanced chips, student visas, and concerns over China's state-dominated economic model.
The prompt scheduling of these high-level talks immediately after a leader-to-leader call suggests a tactical move towards de-escalation of immediate trade tensions, aiming to prevent a full-blown trade war. The objective appears to be managing current conflicts rather than achieving a fundamental resolution, especially with the May 12 agreement nearing its expiration. The core disputes, such as control over rare earths and technology, are deeply entrenched and reflect a broader geopolitical competition rather than mere economic disagreements. This pattern of temporary de-escalation followed by persistent underlying tensions indicates a long-term,structural competition. It suggests that trade policy is increasingly intertwined with national security and geopolitical strategy, implying that businesses should anticipate continued volatility and strategic decoupling in certain sectors, rather than a return to pre-trade war normalcy.
Other big movers for gold will be the US inflation reports. 💥
📅 Wednesday, June 11 (14:30 CEST / 08:30 EDT):
We get the crucial US Consumer Price Index (CPI) data.
Watch for Core CPI (YoY) with a forecast of 2.9% and headline CPI (YoY) at 2.5%.
📅 Thursday, June 12 (14:30 CEST / 08:30 EDT):
The US Producer Price Index (PPI) follows.
Forecasts are for Core PPI (YoY) at 3.0% and headline PPI (YoY) at 2.6%.
📊 These numbers are critical. If inflation comes in hotter 🔥 than expected, it will likely strengthen the US Dollar 💵 and push real interest rates higher 📈, making gold less attractive. This could trigger further declines 📉, especially given the current market structure. Conversely, cooler 🧊 inflation could spark a significant rebound 🔄.
Beyond US data, keep an eye 👁️ on speeches from various European Central Bank (ECB) officials throughout the week, including President Lagarde on Tuesday (23:15 CEST / 17:15 EDT). Their collective tone 🎤 could influence EUR/USD dynamics and indirectly impact the US Dollar Index, offering a counterbalance ⚖️ or amplification to gold's movements.
Key Numbers and Technical Levels to Watch:
Gold is currently sitting on a substantial speculative net long position of 187.9K contracts. This is a massive amount of bullish bets 📊🐂, making gold highly vulnerable to rapid liquidation 💣 if the fundamental picture turns sour. A "long squeeze" could amplify any downside move.
Immediate Support: The 3,300 level is paramount. A decisive break below it would signal further weakness. Below that, 3,250 is strong technical support where we saw a bounce previously.
Overhead Resistance: Look for resistance at 3,350-3,360, and then the recent peak of 3,420. Reclaiming these levels would require a significant shift in sentiment.
Expect high volatility ⚡, especially around the US inflation releases. Trade smart 🧠, manage your risk ⚖️, and stay nimble! 🏃
Geopolitical News Landscape 🌍
India / Pakistan
The ceasefire from May 10 is holding, but diplomatic relations remain frosty. India has launched a global image campaign to gain support, while Pakistan insists on dialogue and accountability.
Outlook: Without substantial agreements on border terrorism and water issues, tensions will stay latently high, with potential for new escalation risks. ⚠️
Gaza Conflict
Violence escalated again in early June. Israel intensified attacks, killing civilians seeking aid in Gaza City, and at least six people were killed at a distribution point.
Outlook: The humanitarian situation continues to worsen 🚨, and international mediation efforts are urgently needed. However, an immediate ceasefire seems unrealistic. ❌
Russia / Ukraine
In the first week of June, Russia launched one of its largest series of attacks: hundreds of drones and missiles hit Kharkiv and Kyiv, resulting in civilian casualties. Simultaneously, a planned prisoner exchange has stalled.
Outlook: Strategic air attacks will likely continue 💥, and the prisoner exchange remains deadlocked. Without a diplomatic initiative, the conflict will stay entrenched. 🕳️
U.S.–China Trade War
Following talks between Trump and Xi, new negotiation rounds are expected in London. China has opened up rare earth exports, a sign of cautious de-escalation.
Outlook: If dialogue channels open 🗣️, systemic trust could grow, but genuine reforms remain uncertain. 🤔
🌐 Global Trade War
The OECD has lowered its growth outlook to 2.9%, warning of protectionism 🧱 and delayed investments. The ECB is also maintaining synchronization with the FED.
Outlook: Without de-escalation, the world faces a global economic slowdown 🐌 and permanent fragmentation of supply chains. 🔗
🏛 Trump vs. Powell
Trump has again complained about the FOMC's hesitancy, nicknaming Powell “Too Late,” and demanding a full 1% interest rate cut.
Outlook: Pressure is mounting 📣. Whether the Fed yields depends on if inflation and labor data allow for a loose policy. 🎯
💵 U.S. Inflation – May 2025
Forward-looking data shows a weakening services sector and consumer prices rising again as tariffs pass through. Official CPI data for May 2025 will be released on June 11.
Outlook: Higher inflation could halt the Fed's "dereflexion" course — a dilemma ⚖️ between growth 📈 and price stability. 🛑
Technical View 📐
Regarding the major Head and Shoulders (H&S) reversal pattern on the 4H chart I shared previously, I'd like to explain some new developments that are altering its potential outcome.
Since the price has re-entered and fallen below the neckline, I activated my "second brain cell" 🧠 to guess what could be next. This led me to revise the larger 4-hour chart structure with the adjustments shown in the accompanying image.
As you can also see in the updated version below, a reversed H&S pattern remains a possibility, as the proportions still appear valid. 🔄
Potential Scenarios for Gold 🧩
Under this revised idea, Gold could potentially reach the neckline entry at 3397 (+88) from the current price. This is one plausible scenario. ✅
Alternatively, the price could drop further to the "Head" at 3120 (-191 from the current 3309), which would, of course, invalidate this H&S pattern. ❗
While this is speculative 🔮, given that trading often involves psychological movements and their resulting impacts, I believe this is a favorable approach to forecasting.
Another reason to see it as bullish is the formed standard bull flag 🚩🐂.
Please take the time to let me know what you think about this. 💬
-------------------------------------------------------------------------
This is just my personal market idea and not financial advice! 📢 Trading gold and other financial instruments carries risks – only invest what you can afford to lose. Always do your own analysis, use solid risk management, and trade responsibly.
Good luck and safe trading! 🚀📊

Looks like a Bull Flag forming on Gold againDespite the RSI on the Monthly indicating gold being in over-bought territory, the daily chart on Gold is forming a bull flag pattern. The measured move up and target price for Gold if it breaks out of the $3400 area is $3900/oz.

ETH — Bull Flag or Trap? Trade Plan with TargetsETH is setting the stage for its next major move — and the chart is packed with clues.
After completing Wave 3 at $2738.50, ETH has entered a corrective phase, forming what looks like a bullish flag. But beneath the surface, smart money levels are aligning: VWAP, Fibs, key levels, and liquidity traps are all converging around one high-probability zone.
This analysis breaks down both the long and short setups, backed by real confluence and clean R:R opportunities. Whether you’re planning to snipe the reversal near support or fade the rally at resistance, you’ll walk away with a clear trade plan and deeper insight into how price reacts at precision levels.
Let’s get into it.
🟢 Bullish Scenario: Long Setup with Deep Confluence
After a fakeout pump into the golden pocket of this minor downtrend (typical for a Sunday), ETH rejected cleanly at the upper resistance of the bull flag channel.
We're now watching for the swing low at $2406.63 to be swept, setting up a potential SFP (Swing Failure Pattern) at a highly confluent support zone:
🔍 Confluence at the $2390–$2360 Zone:
Anchored VWAP from the Wave 3 origin at $1752 is sitting at $2390
Trend-Based Fib Extension 1:1 of the correction lands at $2386.84
Liquidity pool just under the recent swing low
0.382 Fib retracement of the entire Wave 3 at $2361.66
0.618 Fib Speed Resistance Fan intersects this zone
Lower bull flag support line also aligns
This makes the $2390–$2362 zone a high-probability bounce area.
📌 Plan:
Laddered long entries between $2390–$2362, watching closely for a clean SFP or reversal signal.
Target 1: $3000 psychological level
Target 2: 0.618 Fib retracement at $3067.71 (potential Wave 5 top)
Stop-loss: Below previous yearly open (can be tightened after confirmation)
R:R: 1:5 or better after SL adjustment
🔴 Bearish Scenario: Short Setup at Key Rejection Zone
If ETH makes a move up to complete the 5th wave, we monitor $3067.71 — the 0.618 retracement of the entire corrective leg — as a key resistance.
If price rejects here with momentum loss or bearish structure:
📌 Plan:
Short on confirmed rejection of $3067.71
Stop-loss: Above $3211 (above 0.666 Fib)
Target: Previous high near $2700 or lower
R:R: 1:2 or better depending on entry and structure
🧠 Educational Insight: Why Confluence Increases Probability
Many traders chase setups based on single indicators. Real edge comes from stacking independent tools: VWAPs, Fibs, FVGs etc... When they align, the setup isn’t random — it’s high conviction.
This strategy gives you a framework to anticipate where price is likely to move and why, rather than reacting emotionally.
Patience and preparation will always outperform panic and reaction. Trade the plan — not the impulse.
___________________________________
If you found this helpful, leave a like and comment below! Got requests for the next technical analysis? Let me know.
