DOGE – At Weekly Support… But Not Bullish YetDOGE is currently approaching a major weekly support zone $0.08 – $0.05 .
This area has previously acted as a strong demand zone, so it’s definitely a level to watch. However, structure still matters.
Price remains bearish, trading inside the falling red channel with clear lower highs and lower lows.
For the bulls to take over again, we need:
- A clean break above the falling red channel
- Followed by a shift in structure on lower timeframes
Until that happens, this is simply a test of support within a broader bearish correction.
⚠️ Disclaimer: This is not financial advice. Always do your own research and manage risk properly.
📚 Stick to your trading plan regarding entries, risk, and management.
Good luck! 🍀
All Strategies Are Good; If Managed Properly!
~Richard Nasr
Bullish Patterns

GBPUSD - Trend Still IntactGBPUSD has been overall bullish, printing higher highs and higher lows inside the rising blue channel.
Now price is pulling back into a key intersection:
• The lower bound of the blue trendline
• The green support zone
As long as this confluence holds , we’ll be looking for trend-following longs, in line with the dominant momentum.
Bullish structure remains valid until proven otherwise.
⚠️ Disclaimer: This is not financial advice. Always do your own research and manage risk properly.
📚 Stick to your trading plan regarding entries, risk, and management.
Good luck! 🍀
All Strategies Are Good; If Managed Properly!
~Richard Nasr

XAUUSD BULLISH ANALYSIS ()READ CAPTIONHi trader's what do you think about gold
Gold is currently maintaining a bullish market structure, supported by strong buying interest at key demand zones. The overall momentum favors buyers, and short-term pullbacks are considered potential buying opportunities within the broader uptrend.
🟢 Support Zone 1: 4,940
The 4,940 level is acting as an immediate bullish support. As long as price holds above this zone, upward continuation remains likely.
🟢 Support Zone 2: 4,888
The 4,888 level represents a deeper demand and accumulation area. If price retraces toward this zone, buyers may step in again. A break below this level would weaken the bullish outlook.
🔴 Resistance: 4,997
The 4,997 level is the nearest resistance where temporary rejection or consolidation may occur.
🔴 Supply Zone: 5,085
The 5,085 level is a major supply zone and a potential upside target if bullish momentum continues.
📈 Market Bias
Above 4,940 → Bullish structure remains active
Pullbacks toward 4,940 – 4,888 → Buy-on-dips opportunity
Break below 4,888 → Bullish setup invalidated
Upside targets → 4,997 then 5,085
Overall, Gold favors a buy-on-dips strategy while price remains above key support zones.
please don't forget to like comment and follow

Tesla: Corrective Dip Before The Next Bullish Leg?Tesla staged an impressive recovery from its April 2025 lows, extending the rally to fresh highs near the 500 level. However, the beginning of 2026 has introduced a notable retracement, raising questions about whether this marks a larger reversal or simply a pause within a broader uptrend.
From an Elliott Wave perspective, the current decline appears to be part of a corrective wave four. The pullback has unfolded in three visible subwaves so far, suggesting that the correction may be approaching completion. While the retracement has been deeper than initially expected, it still fits within the structure of a healthy consolidation phase following a strong impulsive advance.
A key technical area to monitor lies between 400 and 370. This zone is particularly significant as it aligns with the previous fourth wave of lesser degree and the former swing high from May 2025—both common areas for corrective pullbacks to find support. Such confluence strengthens the probability of a bullish reaction if price stabilizes within this range.
Momentum indicators further support this view. The Elliott Wave Oscillator has declined to levels comparable to those seen during the July and November 2025 consolidations, both of which preceded renewed upside momentum. This similarity suggests that bearish pressure may be fading and that buyers could soon attempt another push higher.
As long as Tesla remains above the 275–277 invalidation zone, the broader bullish structure remains intact. A sustained hold above key support could pave the way for the next impulsive move to new highs.
Highlights
Key support zone: 400–370
Current pullback: Likely part of wave four, potentially nearing completion
Momentum signal: Elliott Wave Oscillator approaching historical support levels
Bullish structure valid above: 275–277 invalidation zone

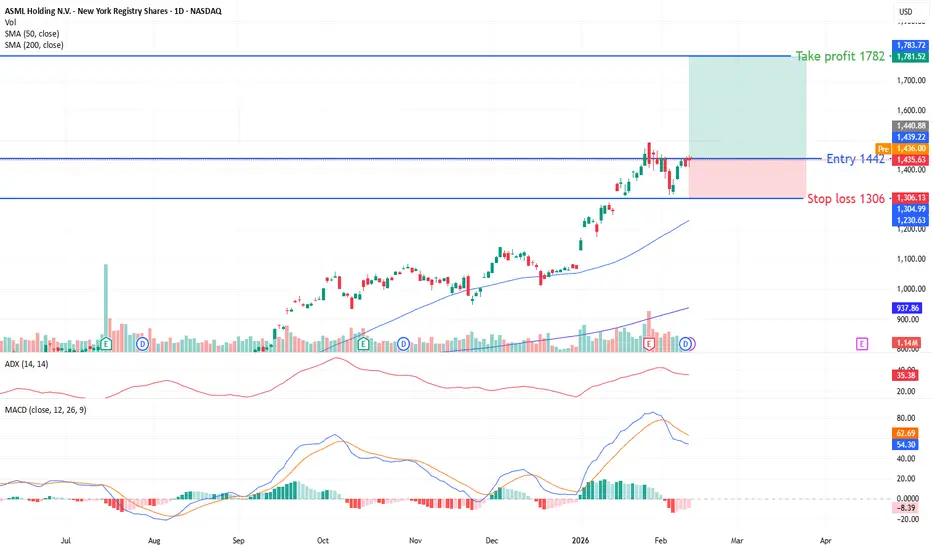
ASML — Trend Continuation Long SetupBias: Bullish trend continuation while above structural support
Buy aligned with the prevailing trend-continuation structure. The medium-term technical backdrop remains constructive: price holds firmly above the 50- and 200-day SMAs, the 4H EMA cluster continues to act as dynamic support, and ADX (~35) confirms a healthy directional environment rather than a range regime. Momentum is elevated but not overheated, with hourly and daily RSI readings signaling strength without reaching exhaustion territory.
Sentiment remains modestly positive and meets the entry threshold required for new positioning, while order-flow analysis shows no visible signs of distribution. The primary tactical consideration is participation: 1H volume has been relatively low, so any breakout attempt should be accompanied by a clear expansion in volume to validate continuation.
Key Levels
Major Support: 1316
Primary Resistance / Breakout Trigger: 1493
Trade Plan
Look for continuation entries on pullbacks holding above trend support or on confirmed breakout above 1493 with expanding volume.
Monitor ADX and participation metrics; weakening momentum or declining participation during advances would increase the probability of consolidation and require reassessment.
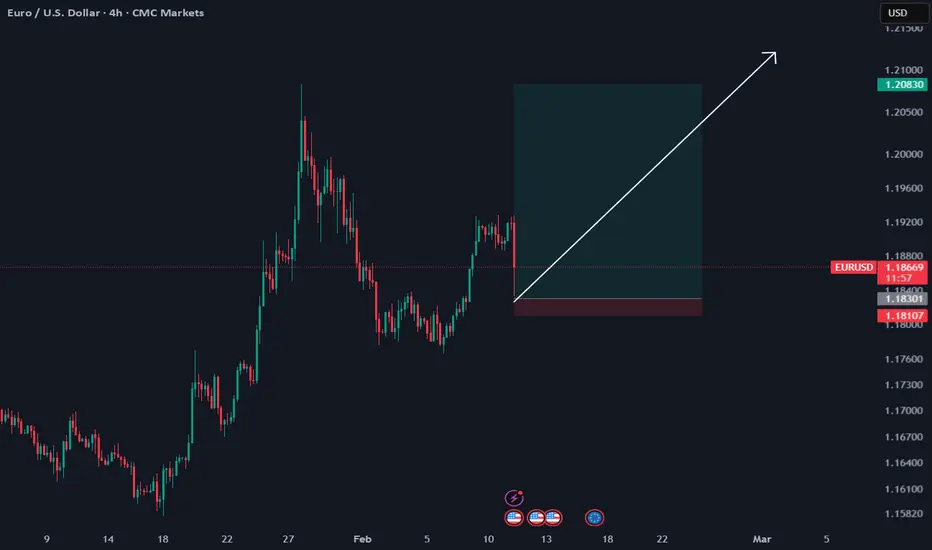
EURUSD is Nearing a Decent Support!Hey Traders, in today's trading session we are monitoring EURUSD for a buying opportunity around 1.18200 zone, EURUSD is trading in an uptrend and currently is in a correction phase in which it is approaching the trend a 1.18200 support and resistance area.
Trade safe, Joe.

Euro will go upsome might say dollar will be strong because we have strong nfp,meanwhile, i think dxy has other plans... OANDA:EURUSD
EURCHF Readies An Inverse Head and ShouldersOANDA:EURCHF has exhibited strong indications of a Bullish Reversal possible with the formation of an Inverse Head and Shoulders!
Price has made it back to the "Neckline" or Resistance @.9138, that has been holding price down and helping form the pattern which is not completed!
If price is successful in making a Breakout of the Neckline, this will generate Long Opportunities to take from the Neckline up to the next Resistance level!

EUR/GBP BULLS WILL DOMINATE THE MARKET|LONG
EUR/GBP SIGNAL
Trade Direction: long
Entry Level: 0.870
Target Level: 0.871
Stop Loss: 0.870
RISK PROFILE
Risk level: medium
Suggested risk: 1%
Timeframe: 1h
Disclosure: I am part of Trade Nation's Influencer program and receive a monthly fee for using their TradingView charts in my analysis.
✅LIKE AND COMMENT MY IDEAS✅

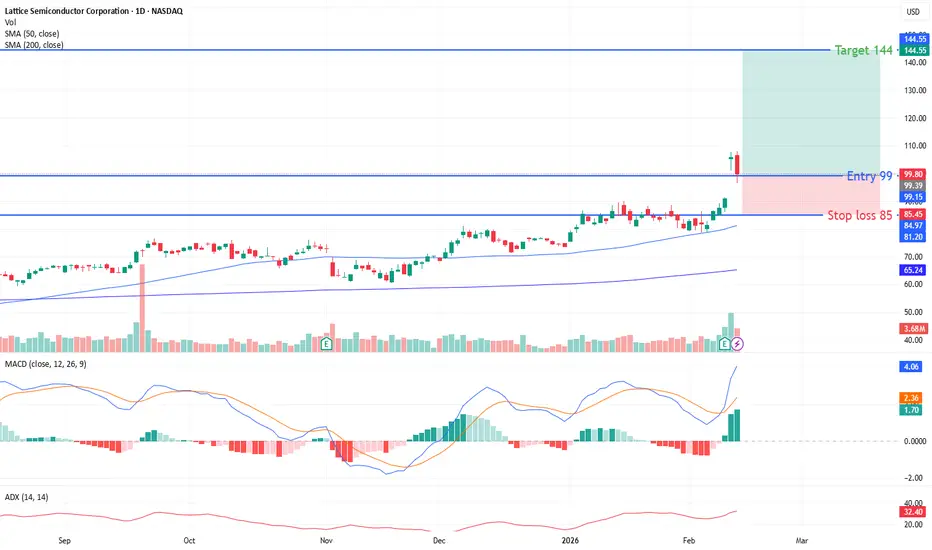
LSCC — Buy | Trend Continuation SetupBias: Bullish (Buy / Trend Continuation)
Entry zone: $99.27 – $100.38
Stop-loss: $85.41
Target 1 (conservative): $108.08
Target 2 (primary): $133.92
Estimated R:R: ~1:2.3 (to primary target)
Trade thesis:
LSCC remains in a strong uptrend, trading well above the 50- and 200-day moving averages while ADX (~32) confirms healthy directional strength. The recent pullback has occurred on very low volume, indicating constructive consolidation rather than distribution and supporting a continuation setup. Sentiment remains supportive following positive earnings developments and continued AI / data-center demand narratives, providing a catalyst aligned with the bullish technical structure.
What to watch:
A decisive move through $108 resistance should ideally be accompanied by volume expansion to confirm breakout continuation. Elevated daily RSI may lead to short-term pauses, but as long as price holds above the entry structure and participation improves on upside moves, the continuation thesis remains intact.
MANTA/USDC - quick bounce, next targets in sight?From deep discount to first resistance cleared. Speculative path toward 6–14% Fib extensions if no immediate rejection.

RENDER – Major Support Zone Swing SetupRENDER has entered a major support zone, where buyers are beginning to show signs of strength. We are currently laddering into a long swing position within this area, aiming to build exposure gradually rather than committing full size at once. This zone has previously acted as demand and could provide a foundation for a potential upside move.
⚒ Strategy Setup:
Entry (Ladder In): $1.20 – $1.40
Take Profit Targets:
TP1: $1.60 – $1.85
TP2: $2.20 – $2.70
Stop Loss: Below $1.12
The focus is on structured risk management, with clearly defined invalidation below support. If price holds and momentum builds, the upside targets align with key resistance levels, offering a favorable risk-to-reward swing setup.

NZD/JPY BEST PLACE TO BUY FROM|LONG
Hello, Friends!
It makes sense for us to go long on NZD/JPY right now from the support line below with the target of 93.553 because of the confluence of the two strong factors which are the general uptrend on the previous 1W candle and the oversold situation on the lower TF determined by it’s proximity to the lower BB band.
Disclosure: I am part of Trade Nation's Influencer program and receive a monthly fee for using their TradingView charts in my analysis.
✅LIKE AND COMMENT MY IDEAS✅

Bitcoin Cash: Signs Of A Potential Bottom FormingBitcoin Cash (BCH) appears to be in the final stages of a higher-degree A-B-C irregular flat correction, labeled as wave (2) on the daily chart. Price recently tested a strong support zone and responded with a sharp rebound, suggesting that corrective pressure may be fading and that wave (2) could already be complete.
On the 4-hour chart, BCH seems to have completed a five-wave bearish impulse within wave C of the correction. This type of structure often signals downside exhaustion, increasing the probability that a meaningful support level is now in place. A recovery and hold above the 563 level would further strengthen this bullish case.
For now, however, the recovery is best viewed as a minimum three-wave move, as bullish momentum has not yet been fully confirmed. From a technical perspective, a clear break and acceptance above the 670 area would be required to confirm a broader trend reversal rather than a temporary corrective bounce.
Key Levels to Watch
Support: Recent wave C lows
Initial confirmation: Above 563
Bullish confirmation: Above 670
Until price reclaims the upper resistance zone, BCH may continue to consolidate or recover in a corrective manner. Still, the completed wave structure and sharp rebound from support suggest that downside risk is increasingly limited, making this area technically important for upcoming price action.

Herbalife (HLF) — Turnaround + Product-Led GrowthCompany Overview
Global nutrition brand selling weight management, wellness, and personal care via a large direct-selling network.
Turnaround in Motion
Q3’25 sales $1.3B (+2.7% YoY) with North America back to growth as execution stabilizes, distributor engagement improves, and focus returns to core nutrition.
Management guides to mid-single-digit revenue growth in 2026, signaling healthier, sustainable momentum.
Innovation & Digital
New products (HL/Skin, MultiBurn) align with personalized wellness demand.
Upgraded digital tools/platforms lift distributor productivity and customer retention across key markets.
Profitability & Balance Sheet
Q3 adj. EPS $0.50 (beat) on fewer promos, stronger full-price sell-through, and tighter opex.
Ongoing debt reduction enhances flexibility to reinvest in high-growth categories.
Investment View NYSE:HLF
Bullish above: $14.50–$15.00
Upside target: $30–$32 — supported by product-led growth, digital modernization, and margin discipline.

GBP/CHF LONG FROM SUPPORT
Hello, Friends!
Previous week’s red candle means that for us the GBP/CHF pair is in the downtrend. And the current movement leg was also down but the support line will be hit soon and lower BB band proximity will signal an oversold condition so we will go for a counter-trend long trade with the target being at 1.056.
Disclosure: I am part of Trade Nation's Influencer program and receive a monthly fee for using their TradingView charts in my analysis.
✅LIKE AND COMMENT MY IDEAS✅

EU Bulls Raise A FlagFX:EURUSD has fallen into a Consolidation after quite an impressive rally and what we could be seeing is a popular Continuation pattern, the Bull Flag!
With a Bull Flag, we should expect price to deliver a Bullish Breakout of the Falling Resistance of the Channel, accompanied with a Retest of that Breakout.
Once a valid Breakout and successful Retest is made, this pattern should generate Long Opportunities.

Litecoin is primed for a massive price explosionI’m thinking we’ll see a big pump on Litecoin. I love this multi-year accumulation pattern. A lot of people don’t realize how held back this coin has been—when it starts pumping, it will be insane.
As always, stay profitable.
- Dalin Anderson

Three Inside Up For AUOANDA:AUDUSD on the close of the 8Hr Candle has formed a Three Inside Up candlestick pattern!
The Three Inside Up is a Bullish Reversal Candlestick Pattern that consists of:
1) Large Bearish Candle
2) Bullish Candle that takes back 50% of the First Candle
3) Large Bullish Candle that Closes with a Gap Up from the High of the First Candle
Long Opportunity is generated on the Open of the proceeding candle with a Stop Loss set Below the Low of the Pattern.

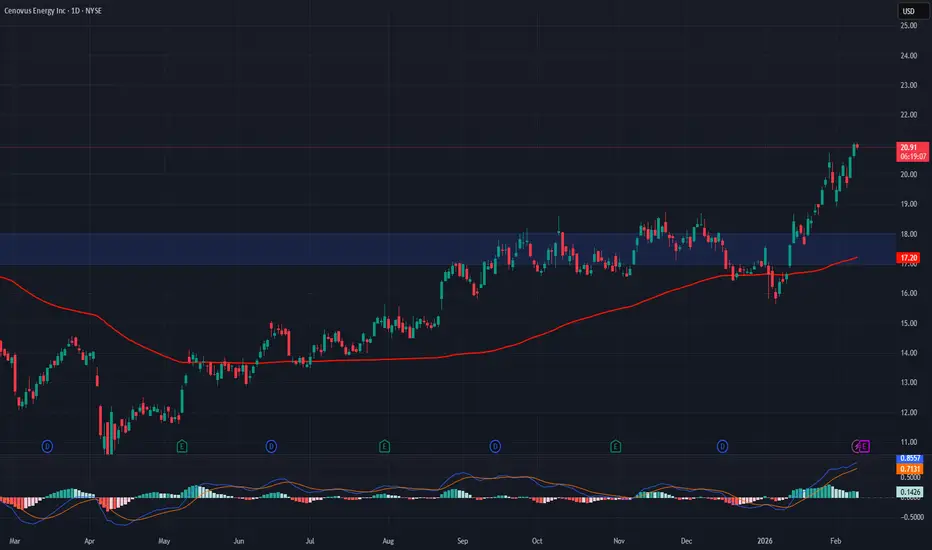
Cenovus (CVE) — Scale, Integration, and Cash-Flow ResilienceThesis
Cenovus NYSE:CVE is a leading integrated producer with top-tier oil sands, upstream, and refining assets across Canada & the U.S.—delivering stable cash flow and leverage to long-duration heavy oil demand.
Key Drivers
MEG Acquisition = Step-Change Scale: Integration of MEG Energy lifts 2026 upstream guidance to ~945–985k BOE/d, improving margins & FCF. Targeted refinery utilization of 91%–95% further enhances integrated cash generation.
Portfolio Optimization: A potential Deep Basin divestiture (up to ~C$3B) would accelerate deleveraging post-deal and reallocate capital toward higher-return oil sands & downstream.
Operational Execution: Ongoing cost control, margin uplift, and improved Lima/Toledo refinery performance support durable cash flow—even in softer pricing.
Why It Matters
Integrated model buffers volatility
Larger, more efficient upstream base post-MEG
Clear levers for balance-sheet strength and capital returns
View & Levels
Bullish above: $17–$18
Target: $30–$32 — underpinned by MEG-driven scale, high utilization, and asset-mix upgrades.
TAO: ready for a bounce? key levels to watch this weekTAO. Tired of watching this AI darling bleed out every 4H candle? After a crazy run on the AI narrative, headlines now talk about profit taking and rotation into “safer” majors, and the chart shows exactly that mood: a controlled grind down with no real capitulation yet.
On the 4H chart price is sitting right on the local demand around 150, with RSI parked in the 30‑35 zone and starting to show a mild bullish divergence. Volume profile is empty below and thick above, so I’m leaning toward a relief pop rather than an immediate cliff. For me the key short term box is 150‑170 – lose it and sellers stay in full control.
My base plan: I’m stalking a bounce long from this demand, targeting the 175‑185 area first, maybe 200 if momentum finally wakes up ✅. If 150 breaks and holds below, I drop the long idea and expect a slide toward 140 and even 130, where the next real liquidity sits. I might be wrong, but right now fading panic here looks better to me than chasing the downside.

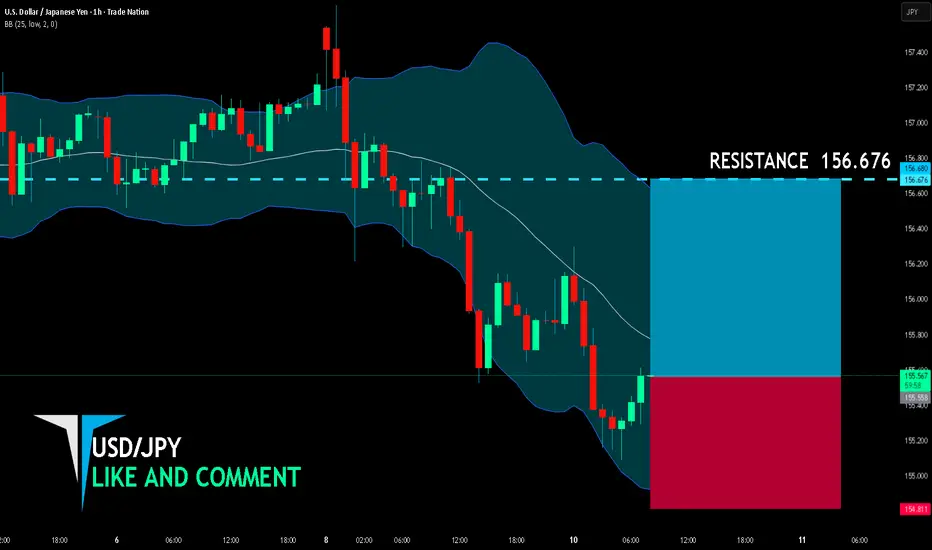
USD/JPY BULLISH BIAS RIGHT NOW| LONG
USD/JPY SIGNAL
Trade Direction: long
Entry Level: 155.558
Target Level: 156.676
Stop Loss: 154.811
RISK PROFILE
Risk level: medium
Suggested risk: 1%
Timeframe: 1h
Disclosure: I am part of Trade Nation's Influencer program and receive a monthly fee for using their TradingView charts in my analysis.
✅LIKE AND COMMENT MY IDEAS✅
CADJPY LONGS CONTINUATIONCADJPY has been in a strong upside trend.
We can see that price has found some minor support at 114.535 expecting the next leg up to continue from here.
TP1: 115.899
TP2: 118.00
TP3: 118.600
